1295
High-Frequency Oscillation-Based Rotary Saturation: a functional imaging technique for epilepsy lateralization in MRI-negative patients1Institute for Diagnostic and Interventional Neuroradiology, Support Center for Advanced Neuroimaging (SCAN), University of Bern, Bern, Switzerland, 2High Field MR Center, Department of Biomedical Imaging and Image-guided Therapy, Medical University of Vienna, Vienna, Austria, 3Department of Neurology, Functional Brain Diagnostics and Therapy, High Field MR Center, Medical University of Vienna, Vienna, Austria
Synopsis
Keywords: Epilepsy, Bioeffects & Magnetic Fields, Spin-lock, Novel Contrast Mechanisms
Motivation: Delineation of the seizure onset zone (SOZ) in surgical planning for drug-resistant epilepsy requires invasive procedures. The Stimulus-Induced Rotary Saturation (SIRS) sequence targets biomagnetic field associated with epileptic discharges.
Goal(s): To evaluate the efficiency of SIRS in epilepsy lateralization using high-frequency oscillations (HFOs) as biomarkers and compare it with EEG and clinical seizure semiology.
Approach: We investigated 11 epilepsy patients using SIRS at a 120 Hz spin-lock frequency, assessing the localizing value at hemispheric and lobar levels.
Results: SIRS-identified activations were above threshold in 8 of 11 patients, offering potential for improved SOZ localization. Hemispheric concordance was found with EEG in 7 cases.
Impact: Spin-lock based rotary saturation imaging lateralized brain areas in epilepsy patients with negative MRI findings in concordance with EEG and seizure semiology. Combined with state-of-the-art non-invasive methods such as EEG, it offers potential for improved seizure lateralization.
Introduction
Accurate delineation of the seizure onset zone is critical for successful surgical outcomes in drug-resistant epilepsy patients [1]. Traditional non-invasive neurophysiological methods such as electroencephalography (EEG) and magnetoencephalography are limited by spatial accuracy [2,3]. Stimulus induced rotary saturation enables non-invasive detection of biomagnetic fields induced by neuronal activity [4]. During the application of a Spin-lock pulse, the rotary saturation sequence lowers the effective resonance frequency of the spin system to match the frequency of the target biomagnetic field. When the resonance condition is fulfilled, the magnetization is locally saturated. For an ideal sinusoidal wave, the resulting contrast is dependent on the amplitude of the field, its initial phase, and the duration of the resonance condition [5]. In this study, we explore the use of SIRS to target high-frequency oscillations (HFOs) at 120 Hz as SOZ biomarkers [6-8].Methods
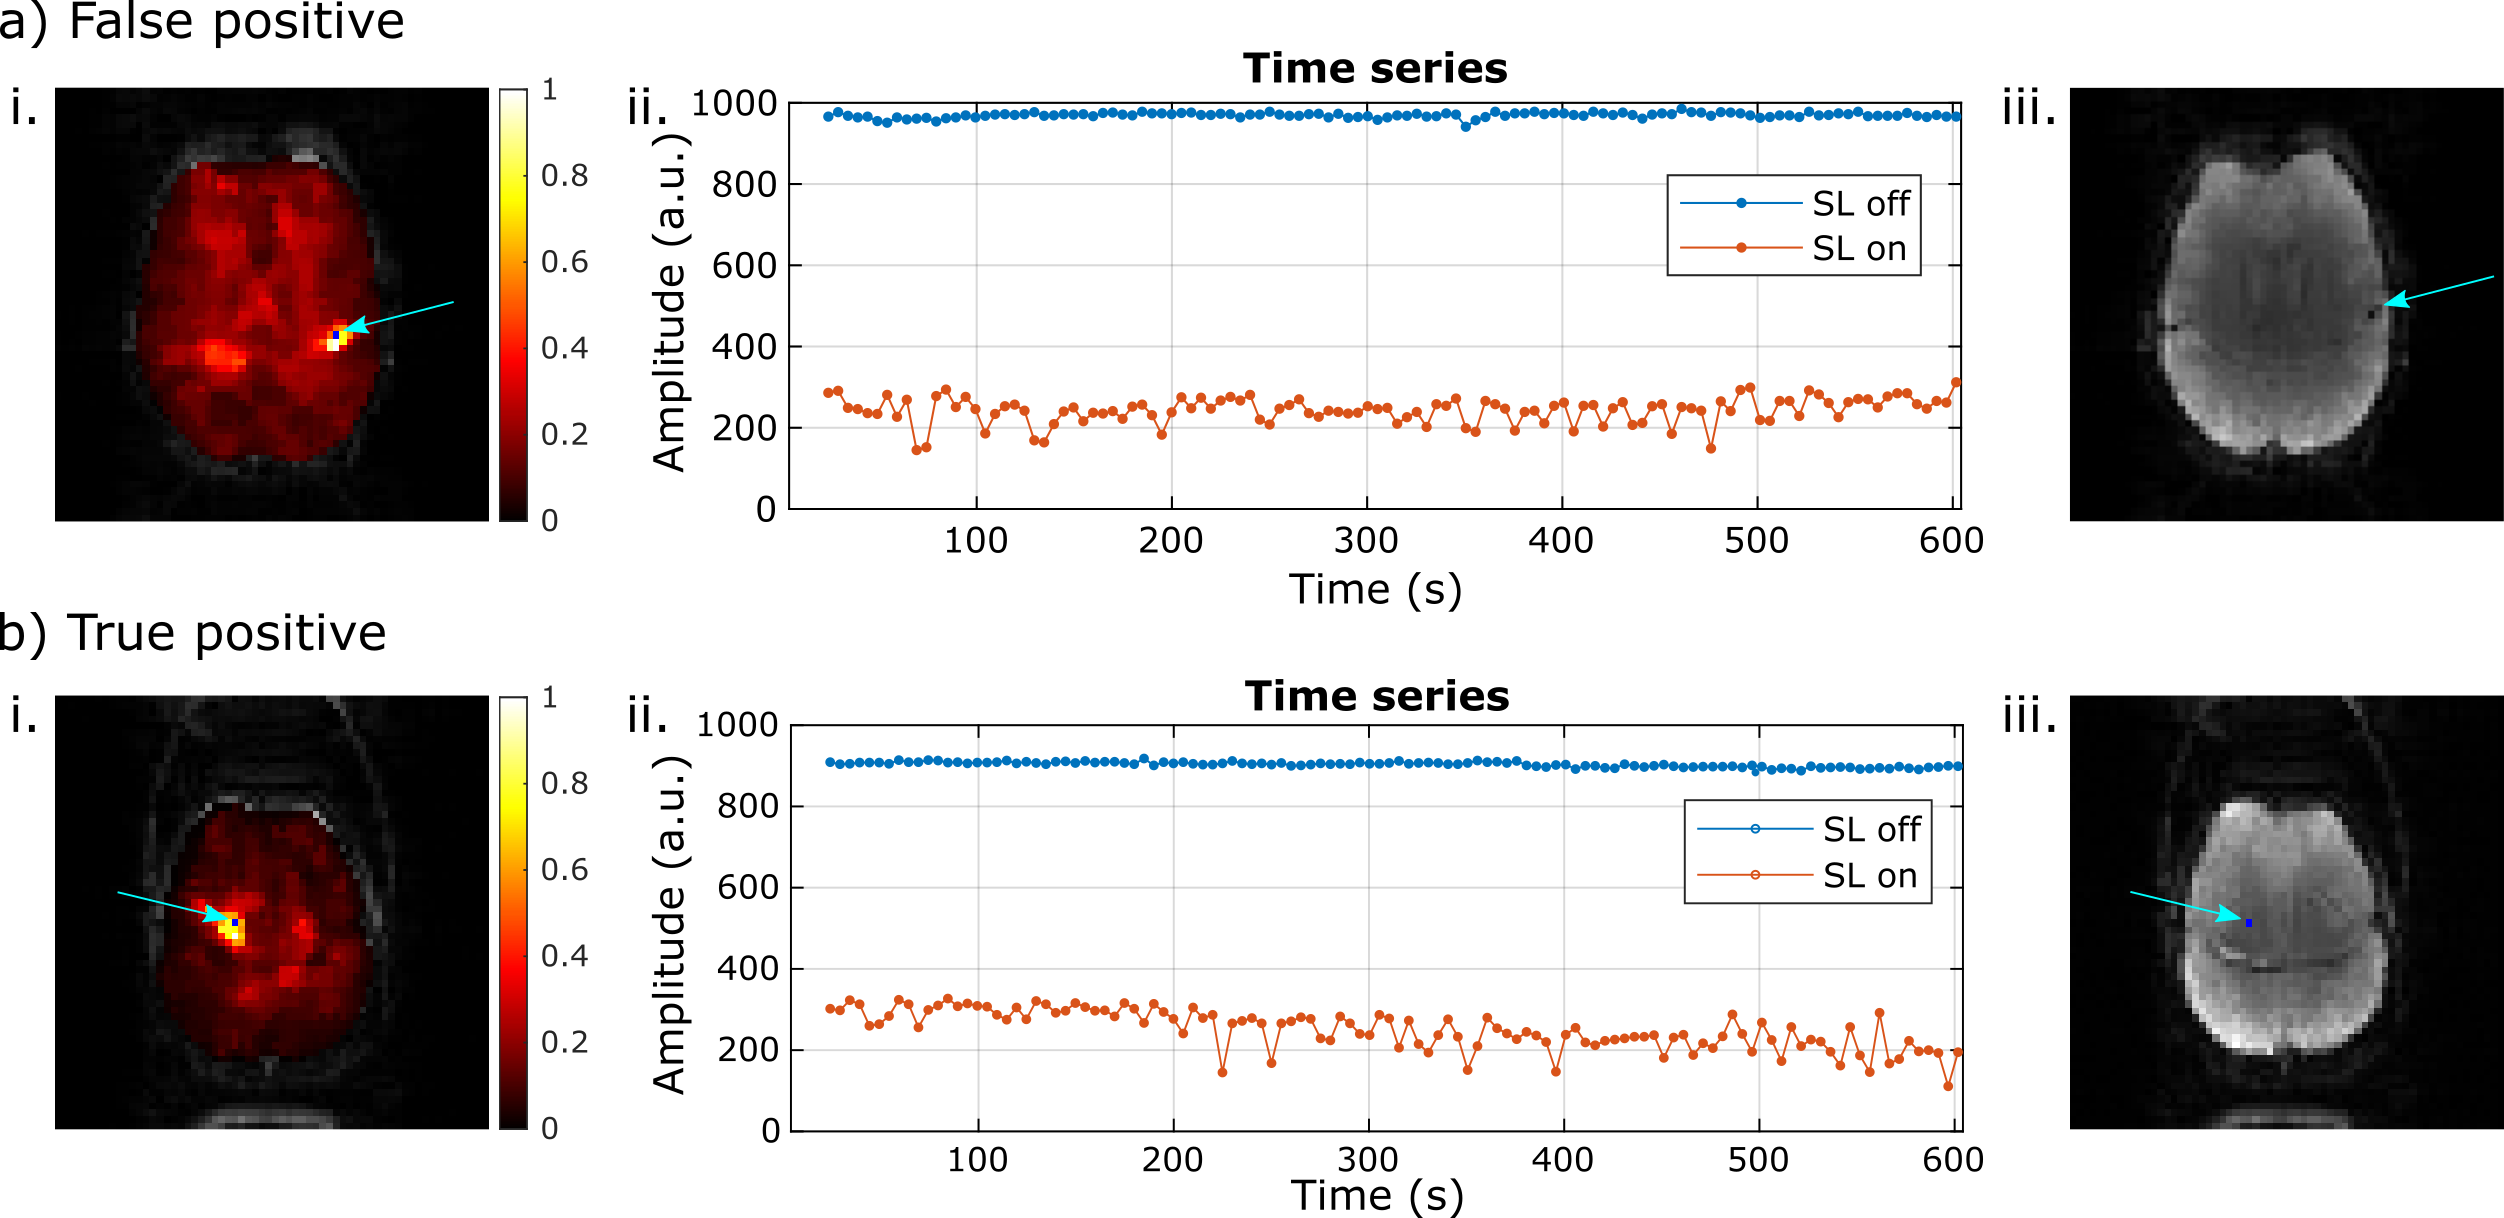
11 epilepsy patients with negative MRI (no pathological findings in high-resolution anatomical images) and 24 healthy volunteers were imaged using a RESL-SIRS sequence on a 3T whole-body scanner (Prisma, Siemens, Erlangen, Germany). The sequence alternates SL on and SL off (only EPI) measurements (Fig 1a). For SL on acquisitions, two preparations occurred before slices 1 and 10. Each measurement consisted of 240 repetitions and a total time of 10 min. Imaging parameters included: TSL = 70 ms, FSL = 120 Hz, 18 slices, matrix size = 64x64, and TReff = 2.5 s. Based on previous phantom and simulations studies [5], due to the magnetization dynamics during the RESL preparation in resonance condition (Fig 1b), the signal in time for a voxel exposed to a resonant sporadic biomagnetic field will exhibit higher variance, as shown by a Bloch simulation in Fig 1c. Contrast maps were generated using the standard deviation of point-to-point division (ppd) between SL on and SL off acquisitions, normalized by the SL off standard deviation [5]. The first and last two slices were excluded from the analysis due to the presence of strong artifacts and non-brain regions. For each remaining slice, a significant threshold was determined as the mean maximum value, observed among all healthy volunteers, above which no contrast was detected within a 5-pixel cluster size. Activations in patient data exceeding the healthy threshold plus one standard deviation for each respective slice were identified. Due to its conservative nature, this approach resulted in numerous activations being retained in both patient and healthy groups after thresholding. However, our primary aim was to investigate potential correlations between regions with heightened variance in the patient group and EEG output. Subsequently, a clinician visually examined the remaining activations in the patient group, excluding those originating from image artifacts. Fig 2a shows a contrast example discarded due to a visible chemical shift artifact in the activated region. Fig 2b illustrates an above-threshold activation with no artifacts present in the activated region, which is therefore considered a likely true activation. The remaining activations were then compared to the EEG results for localization analysis. Two paired t-test were performed to compare the activations detected in patients and healthy subjects both for the whole group and for each considered slice.Results
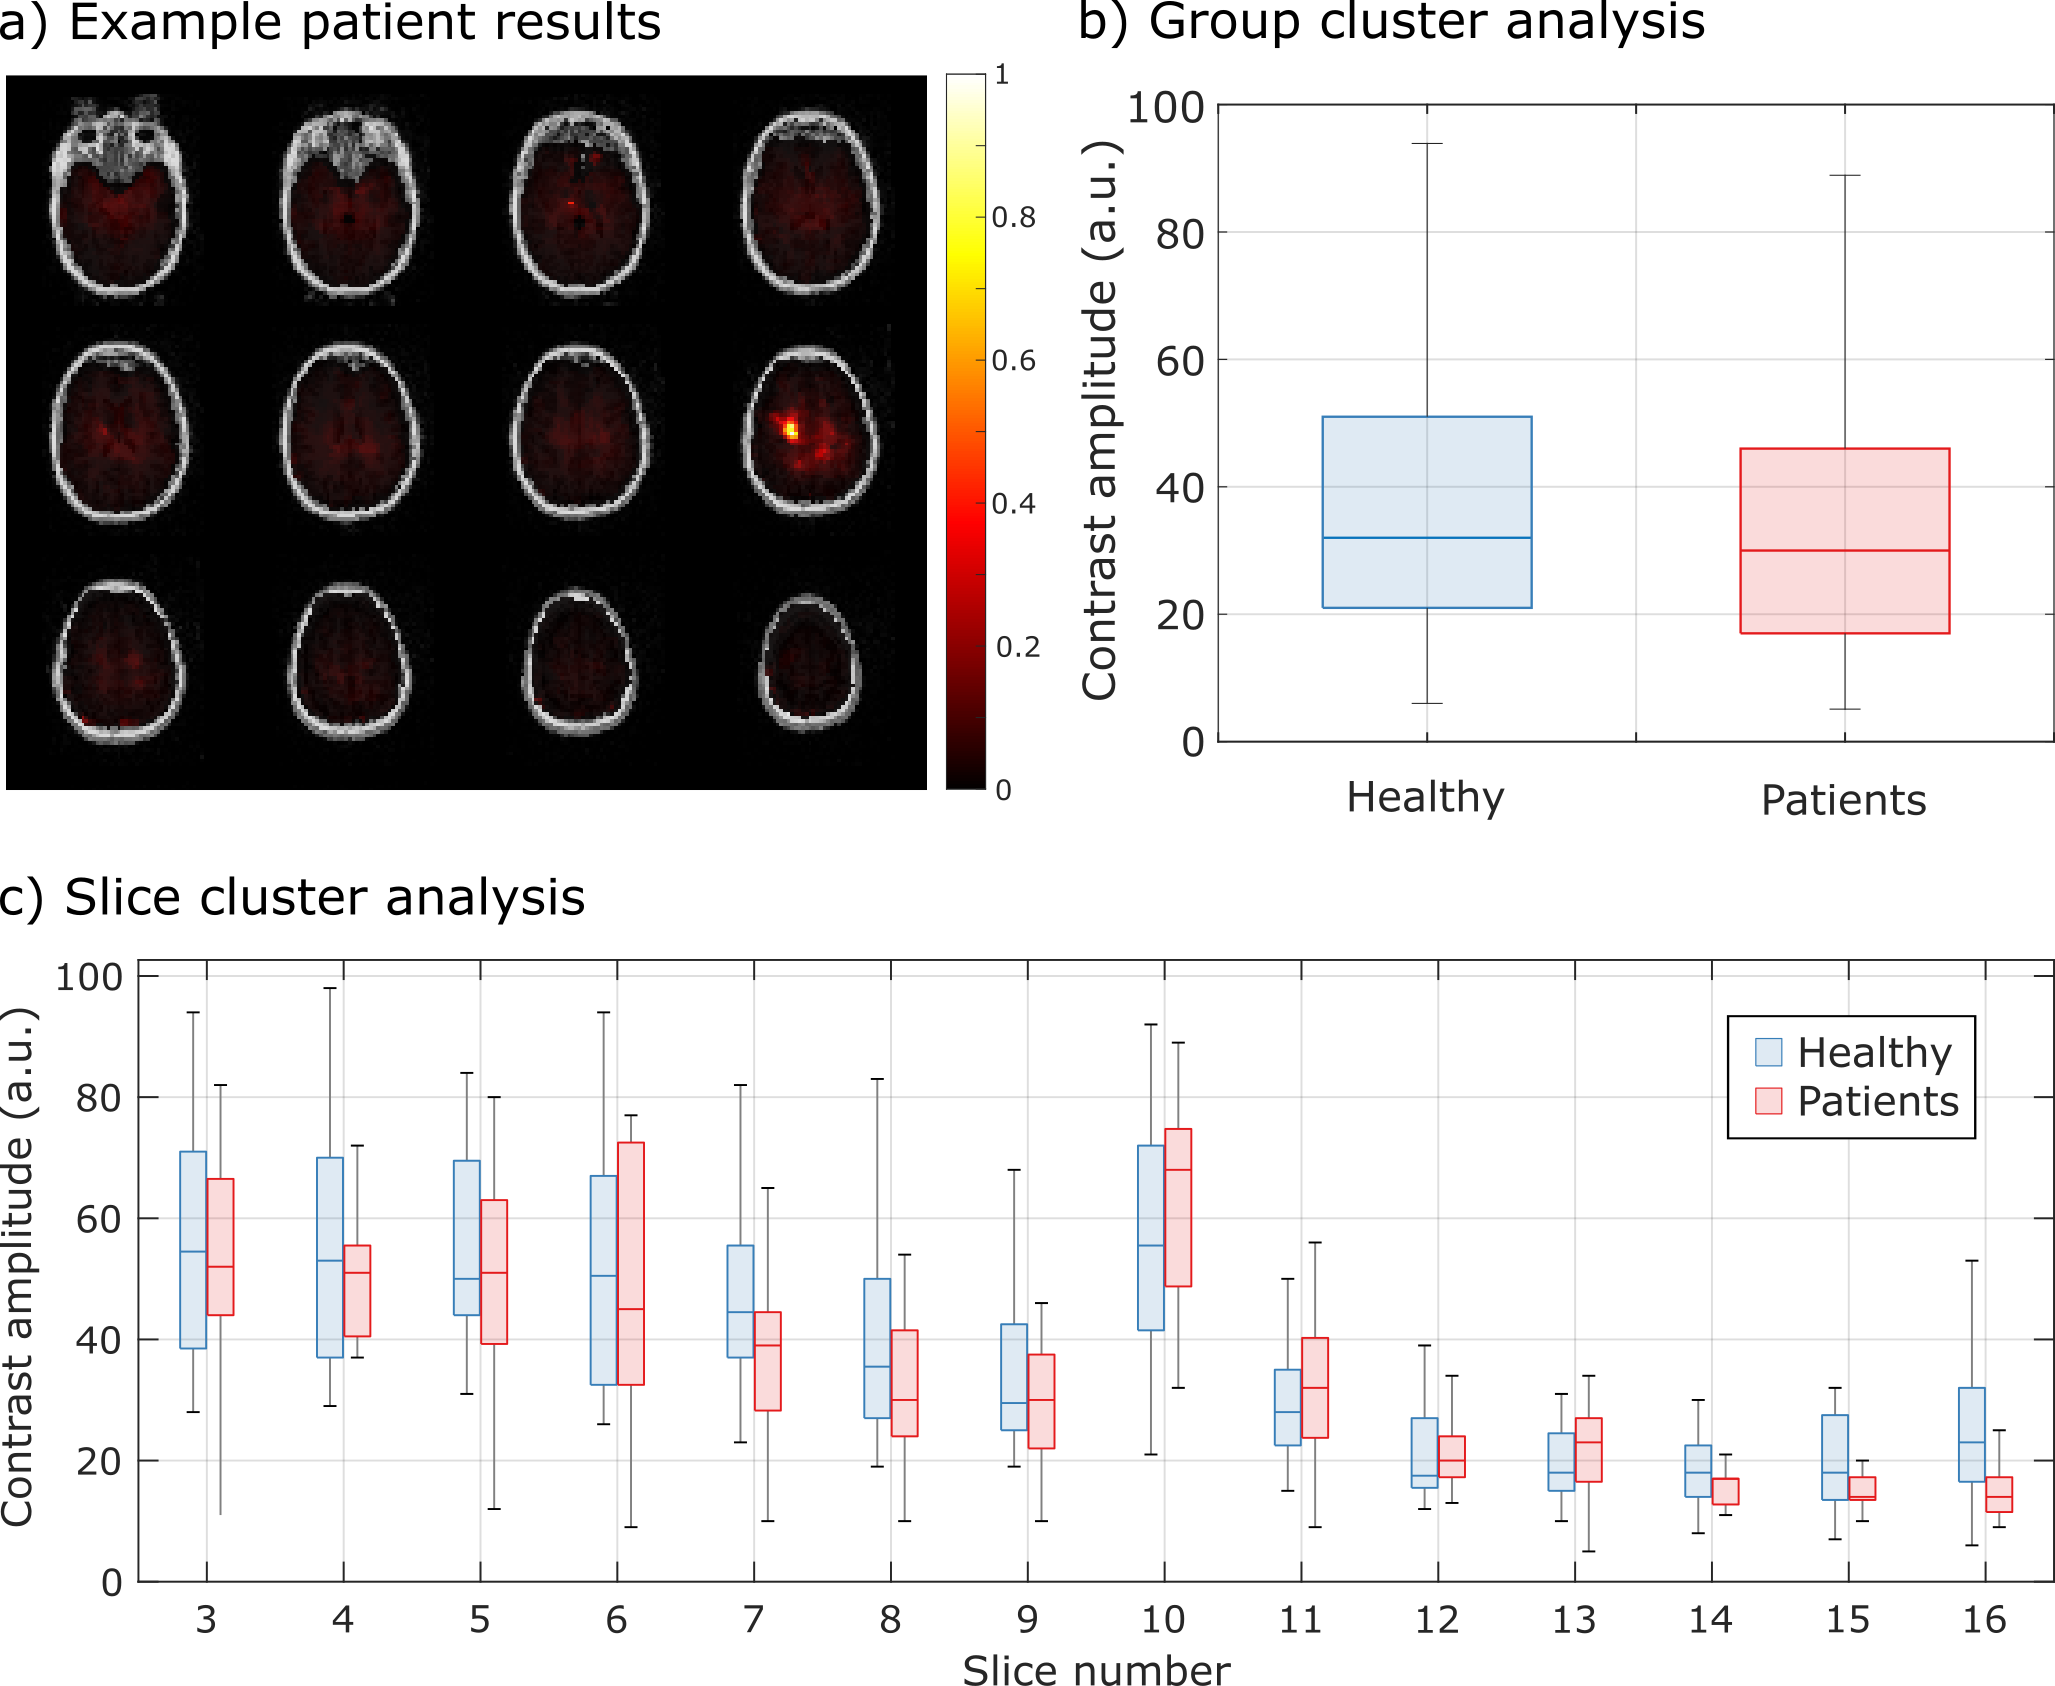
Above-threshold activations were found in 8 of 11 epilepsy patients with negative MRI. Hemispheric concordance with the EEG- and semiology-based presumed SOZ was observed in 7 patients, concordant at the lobar level in 4 (Example in Fig 4a). One patient had a false-negative result (no threshold-exceeding activations despite confirmed epilepsy), and 5 patients presented above-threshold activations not topographically correlated with EEG findings (considered false positives). The amplitudes of activations on the RESL-SIRS contrast did not differ statistically between patients and healthy controls (Fig 4b, 4c). Artifact-induced activations contaminated statistical analysis, necessitating visual inspection of the data. However, the observed correlation between the detected activations and EEG findings suggests that a portion of the identified activations originate from activity at the targeted frequency. In addition, most observed activations are found in slice 10 (Fig 4c), which is acquired directly after the second SL preparation and has, therefore, higher sensitivity. This is a promising finding as it indicates that the SL-based method can complement existing state-of-the-art techniques, in particular, if structural MRI is negative.Conclusions
High-Frequency Oscillation-Based Rotary Saturation represents a promising approach for the non-invasive delineation of the seizure onset zone in epilepsy patients, particularly those with negative MRI findings. This study demonstrated the ability of SIRS to highlight activated areas in 8 out of 11 cases, displaying high concordance with EEG findings and indicating its potential as a valuable tool in clinical practice.Acknowledgements
This project was funded by the Swiss National Science Foundation via the SINERGIA project 180365: The SWISS FIRST study, the Schweizerische Epilepsiestiftung and the Bernese Kernen Foundation.References
[1] Anyanwu, C., & Motamedi, G. K. (2018). Diagnosis and surgical treatment of drug-resistant epilepsy. Brain sciences, 8(4), 49.
[2] Barkley, G. L., & Baumgartner, C. (2003). MEG and EEG in epilepsy. Journal of Clinical Neurophysiology, 20(3), 163-178.
[3] Ahlfors, S. P., Han, J., Belliveau, J. W., & Hämäläinen, M. S. (2010). Sensitivity of MEG and EEG to source orientation. Brain topography, 23, 227-232.
[4] Witzel, T., Lin, F. H., Rosen, B. R., & Wald, L. L. (2008). Stimulus-induced Rotary Saturation (SIRS): a potential method for the detection of neuronal currents with MRI. Neuroimage, 42(4), 1357-1365.
[5] Capiglioni, M., Turco, F., Wiest, R., & Kiefer, C. (2022). Analysis of the robustness and dynamics of spin-locking preparations for the detection of oscillatory magnetic fields. Scientific reports, 12(1), 16965.
[6] Khosravani, H., Mehrotra, N., Rigby, M., Hader, W. J., Pinnegar, C. R., Pillay, N., ... & Federico, P. (2009). Spatial localization and time‐dependant changes of electrographic high frequency oscillations in human temporal lobe epilepsy. Epilepsia, 50(4), 605-616.
[7] Charupanit, K., Sen-Gupta, I., Lin, J. J., & Lopour, B. A. (2020). Amplitude of high frequency oscillations as a biomarker of the seizure onset zone. Clinical Neurophysiology, 131(11), 2542-2550.
[8] Jacobs, J., LeVan, P., Chander, R., Hall, J., Dubeau, F., & Gotman, J. (2008). Interictal high‐frequency oscillations (80–500 Hz) are an indicator of seizure onset areas independent of spikes in the human epileptic brain. Epilepsia, 49(11), 1893-1907.
Figures
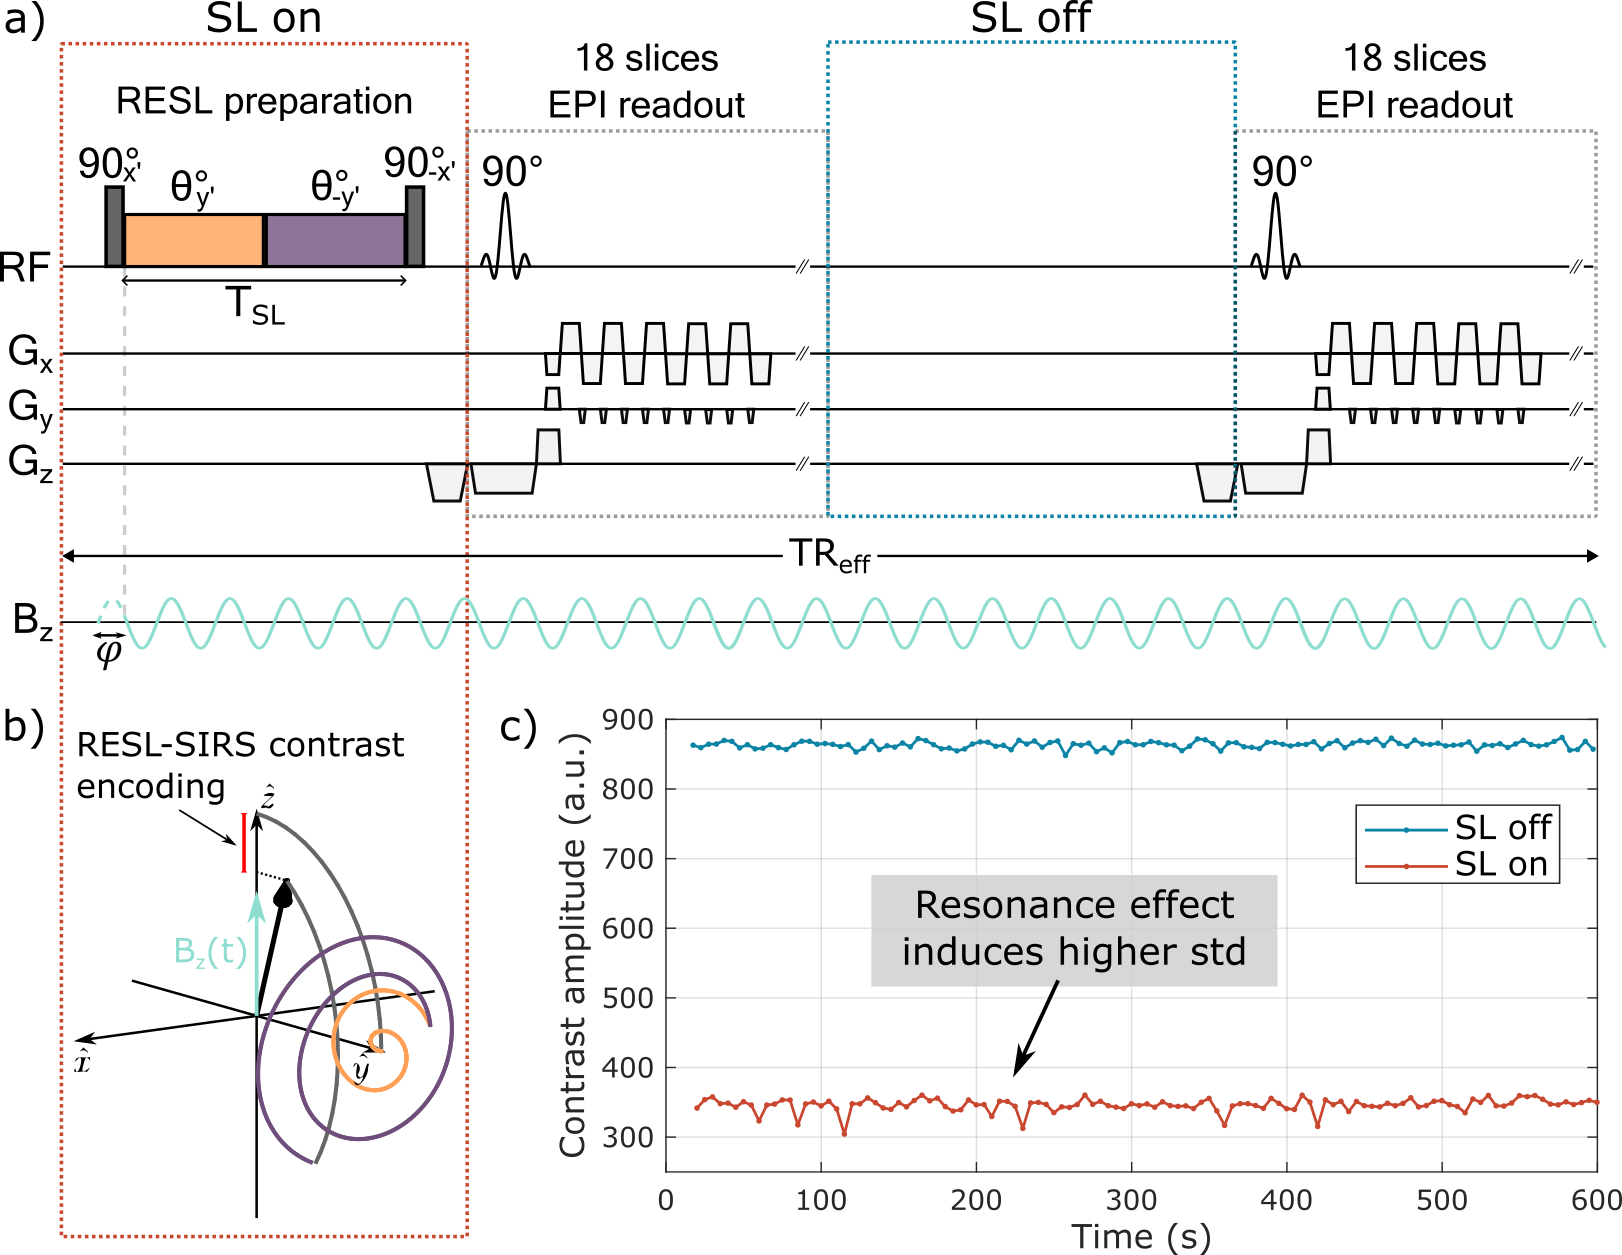
Figure 1: a) Diagram of the RESL-SIRS sequence (θ=πFSLTSL represents the SL-induced angle). b) Magnetization dynamics during RESL-SIRS preparation with a resonant biomagnetic field. c) Bloch simulation of the signal with a 25 nT sporadic target field (activated in 1 s blocks at 120 Hz randomly distributed in the acquisition time), showing higher SL on signal variability during sporadic biomagnetic field sampling.