1294
Functional connectome through the human life span1State Key Laboratory of Cognitive Neuroscience and Learning, Beijing Normal University, Beijing, China
Synopsis
Keywords: Functional Connectivity, Brain Connectivity, brain chart, brain atlas, lifespan, connectomics
Motivation: The normative developmental and aging trajectory of the functional connectome in the human brain remains unknown.
Goal(s): To establish the normative growth trajectory of functional connectome from the largest, quality-controlled multimodal neuroimaging dataset.
Approach: We aggregated 33,809 task-free fMRI scans from 32,328 individuals aged 32 postmenstrual weeks to 80 years from 119 global sites, and quantified lifespan growth charts using generalized additive models for location, scale, and shape (GAMLSS).
Results: We uncovered nonlinear connectome growth at the whole cortex, system, and regional levels, identified critical developmental inflection points, and demonstrated substantial individual heterogeneities in patients with ASD and patients with MDD.
Impact: Our findings elucidate for the first time the lifespan evolution of the functional connectome and serve as a normative reference for quantifying individual variation in patients with neuropsychiatric disorders.
Introduction
The emergence, development, and aging of the intrinsic connectome architecture enables the dynamic reorganization of functional specialization and integration throughout the lifespan, contributing to continuous changes in human cognition and behavior 1-4. Understanding the spatiotemporal growth process of the typical functional connectome is critical for elucidating network-level developmental principles in healthy individuals and for pinpointing periods of heightened vulnerability or potential. Disruption of these normative connectome patterns, especially during specific time windows, can predispose individuals to a spectrum of neurodevelopmental 5-7, neurodegenerative 8, and psychiatric disorders 9-11. The growth chart framework provides an invaluable tool for charting normative reference curves in the human brain 12-15. However, the normative growth trajectory of the functional brain connectome across the human lifespan remains unknown.Methods
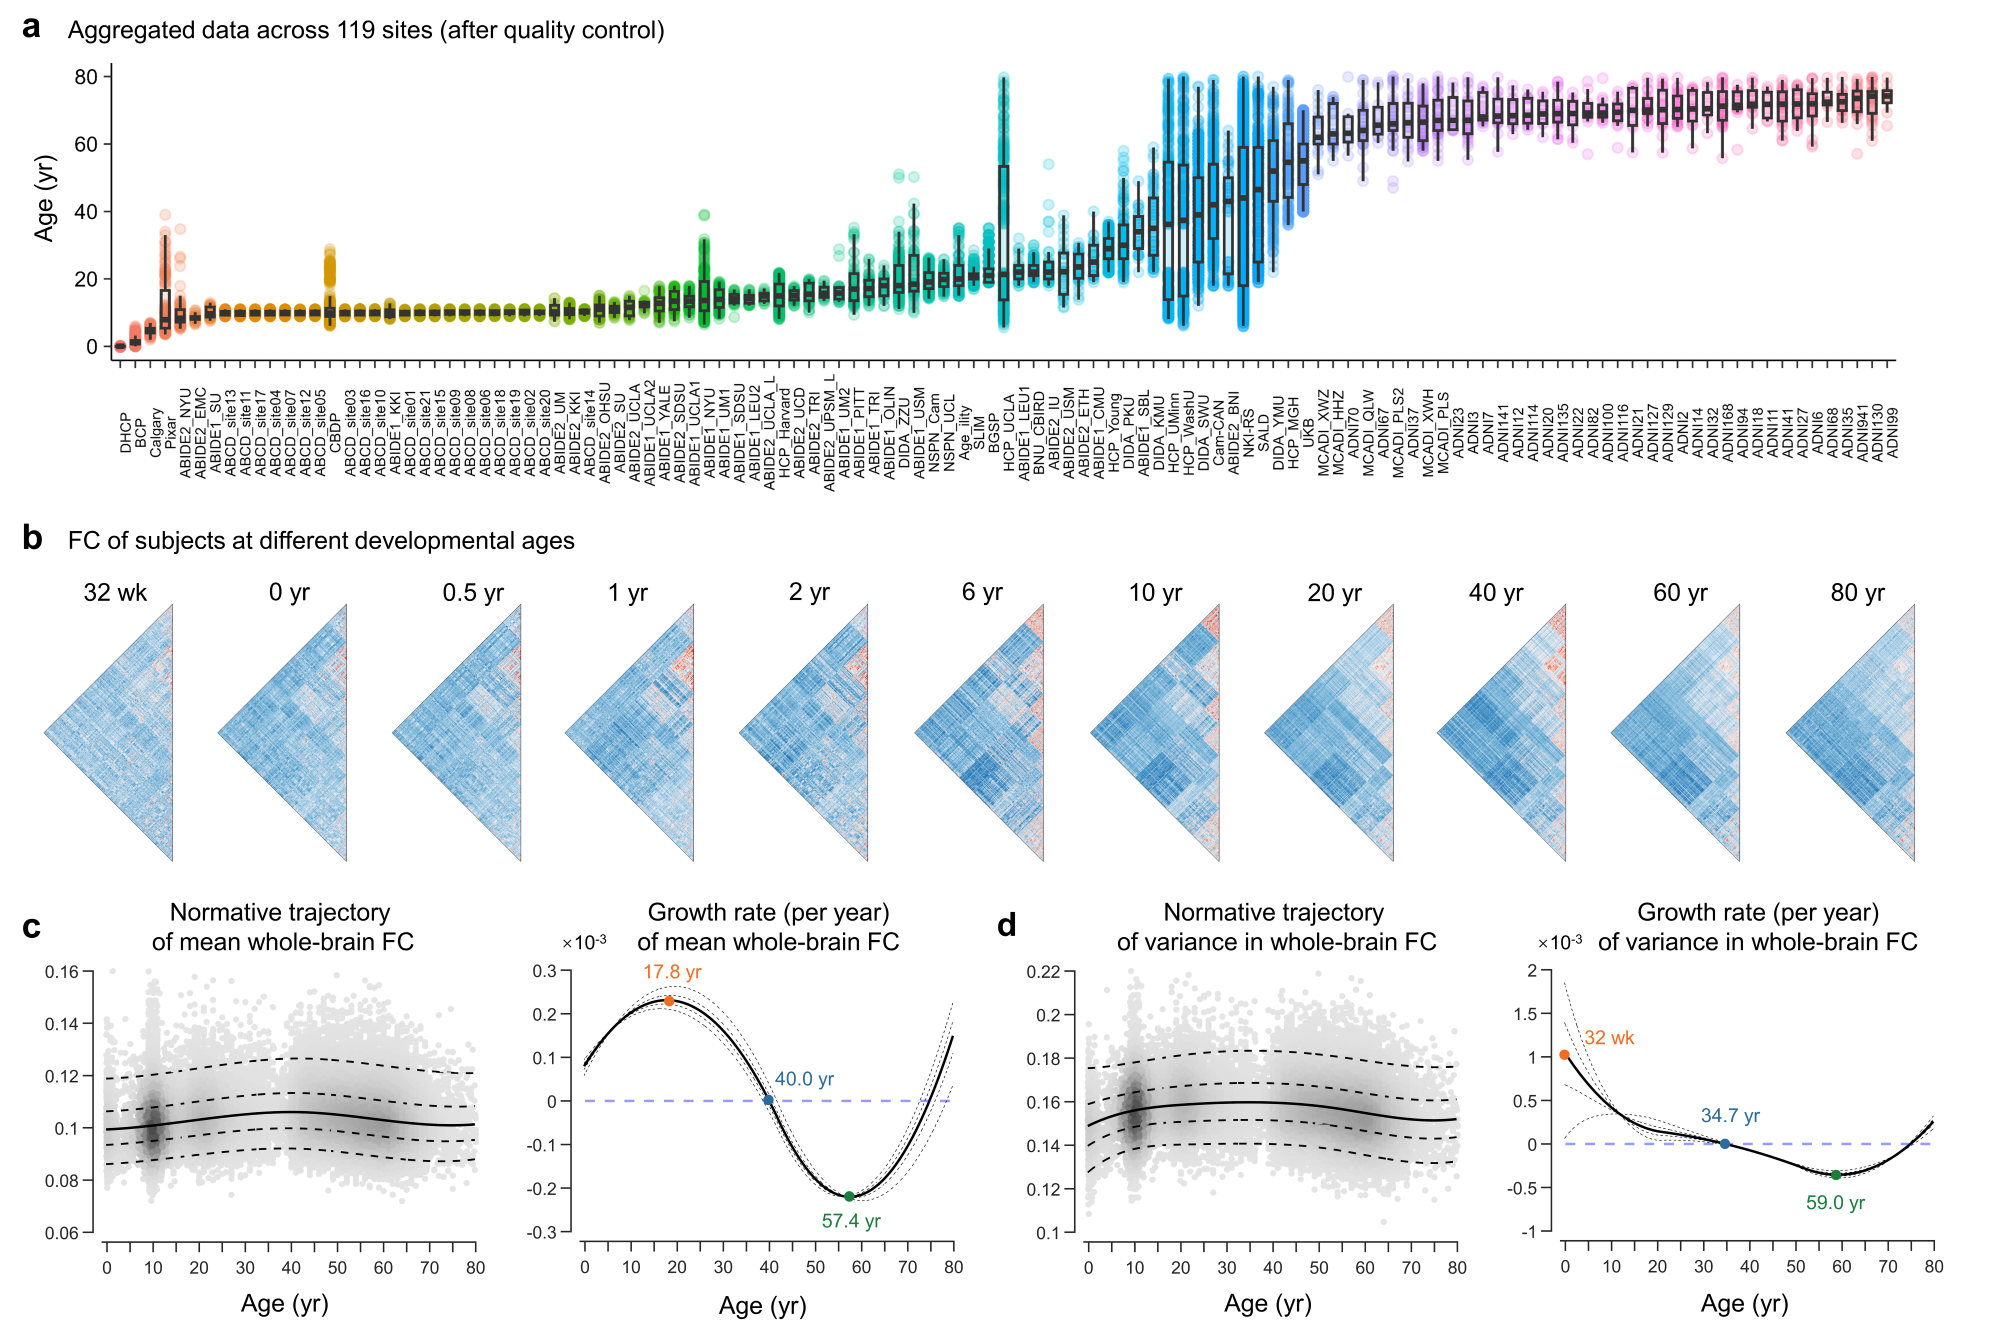
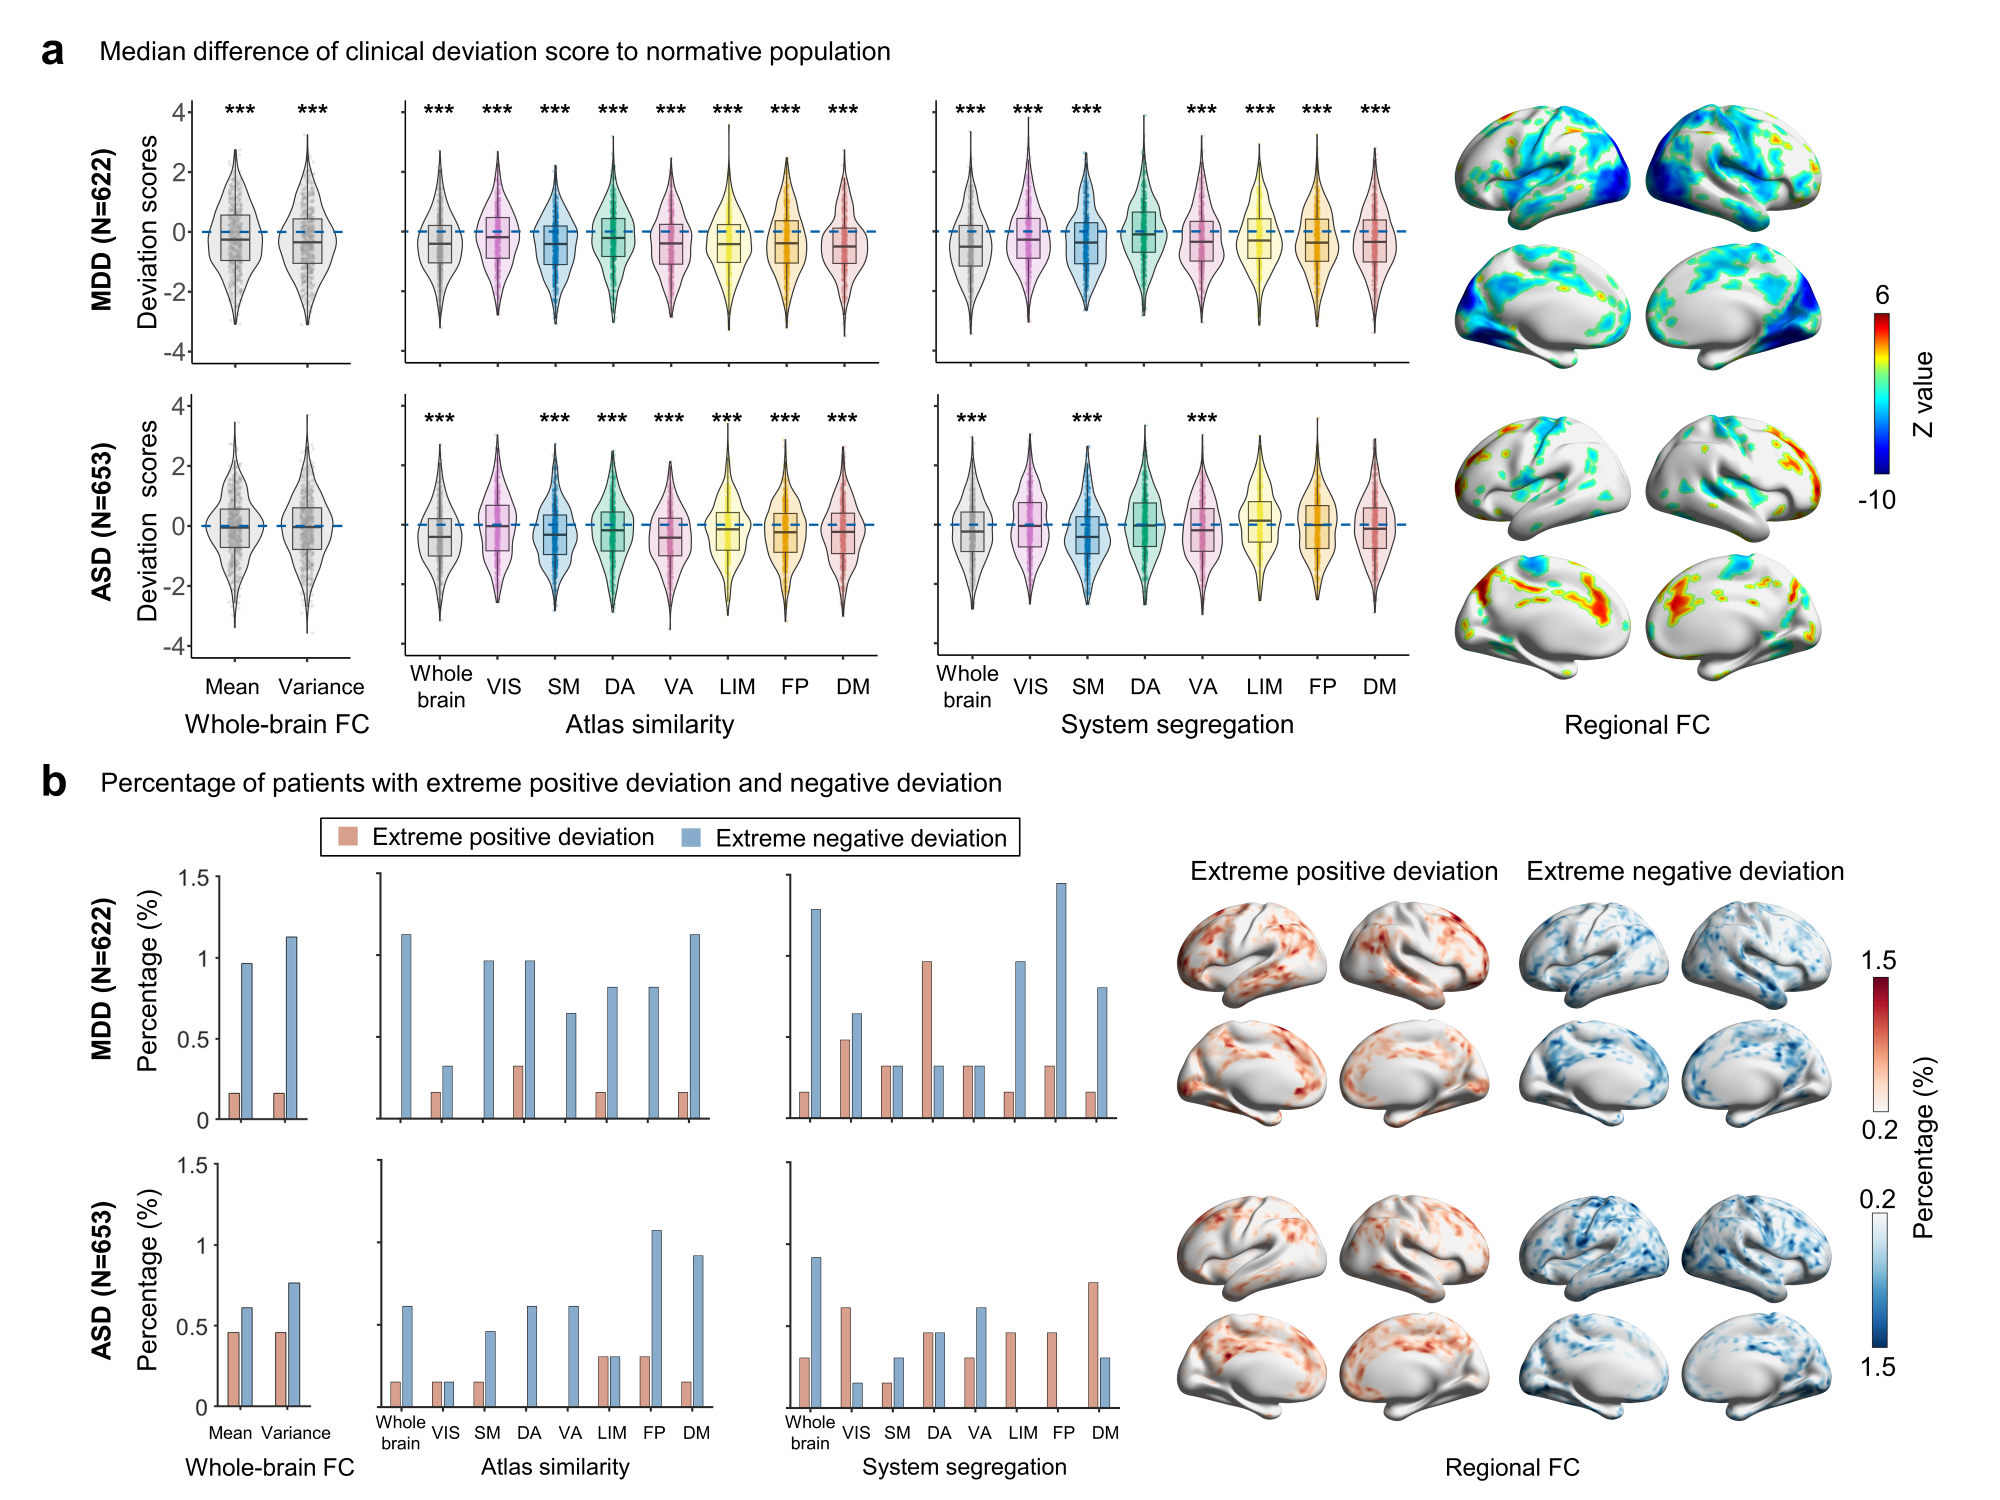
We employed a comprehensive data quality control framework that combined automated assessment tools and expert manual review to assess both structural and functional images across all 45,525 scans. The final sample included 35,084 scans with high-quality images from 119 sites, including 33,809 scans (N = 32,328) from HCs, 653 scans (N = 653) from individuals diagnosed with autism spectrum disorder (ASD), and 622 scans (N = 622) from individuals diagnosed with major depressive disorder (MDD) (Fig. 1a). Using the standardized and highly uniform processing pipeline, we obtained the surface-based preprocessed blood oxygenation level-dependent signals in fsaverage4 space for each individual. We then constructed a vertexwise 4,6094,609 functional connectome matrix by calculating the Pearson correlation coefficient between the time courses of each vertex. Next, we examined the individual connectome at the whole-brain, system, and regional levels, harmonizing all measures across sites. Guided by the World Health Organization recommendation 16, we used GAMLSS to elucidate the age-related nonlinear trajectories for healthy populations, with sex and in-scanner head motion as fixed effects. To assess the rate of change (velocity) and inflection points, we calculated first derivatives of the trajectories. By proposing a Gaussian-weighted iterative age-specific group atlas generation approach, we established a set of continuous growth atlases with accurate system correspondences across the life course. Based on the normative modeling framework, we comprehensively characterized the individualized deviation score of each functional metric in MDD patients (N = 622) and ASD patients (N = 653).Results
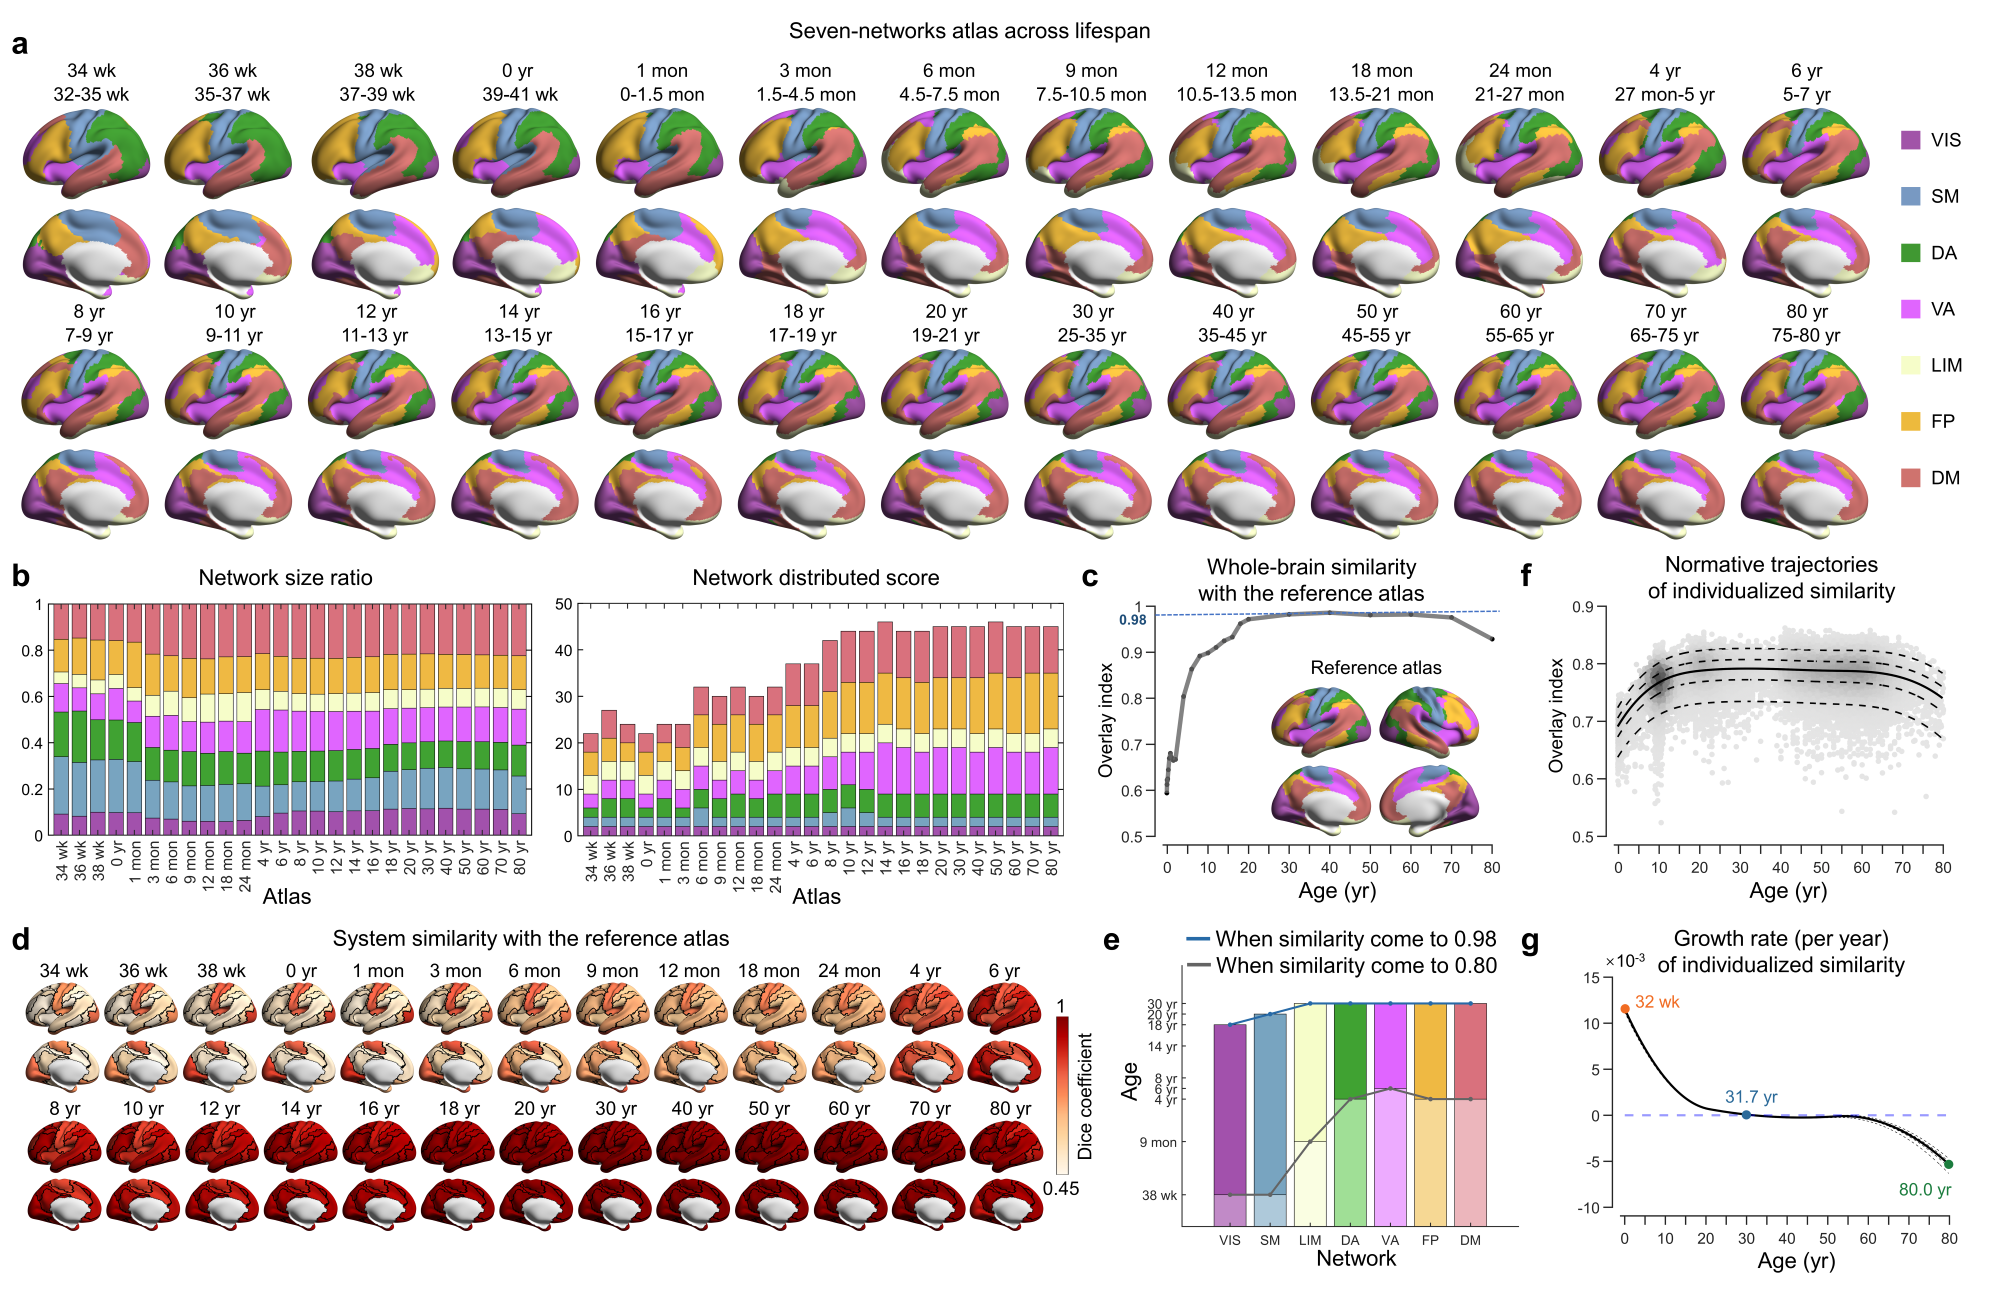
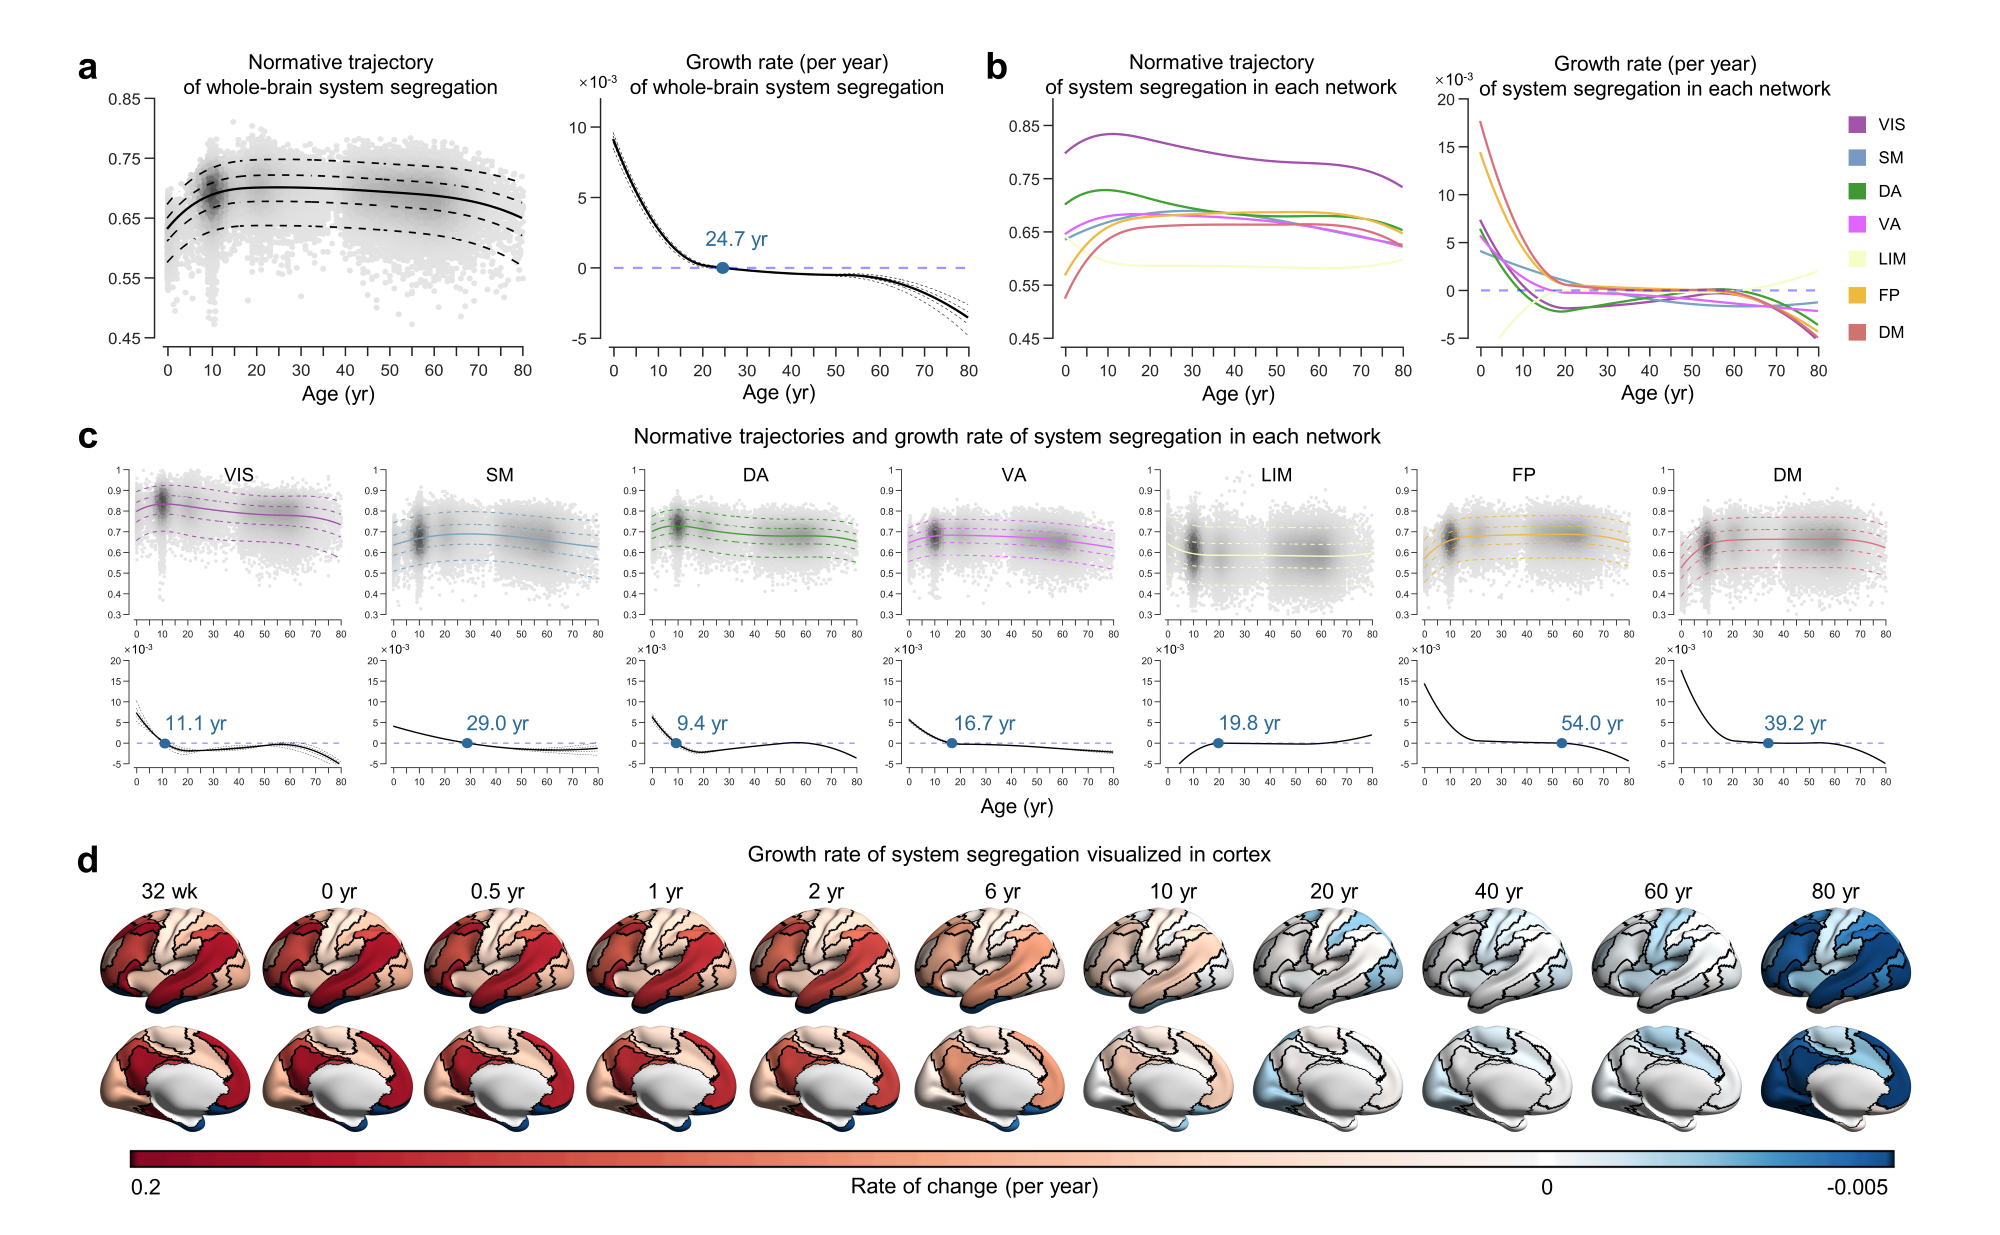
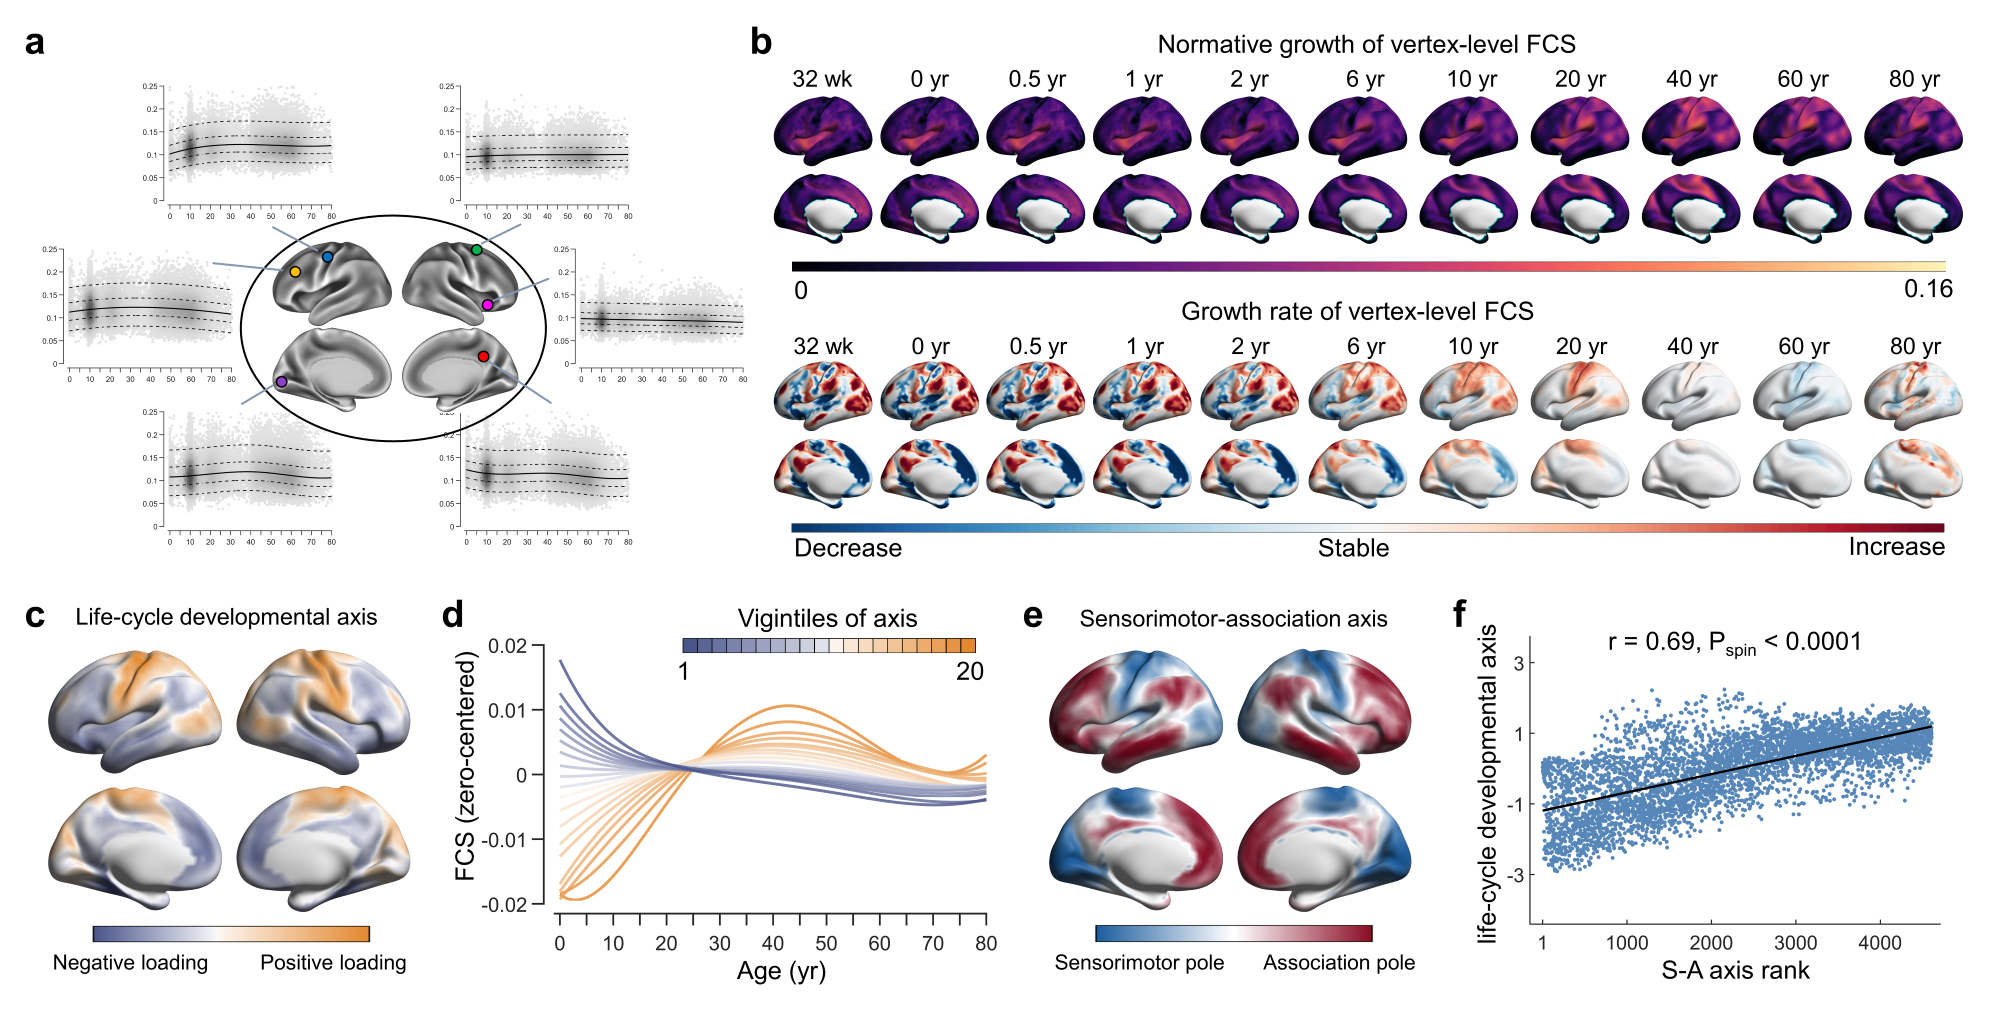
The lifespan curve of global mean functional connectivity (Fig. 1c) showed a nonlinear increase from 32 postmenstrual weeks onward, peaking at 40.0 years (95% bootstrap confidence interval (CI) 39.4-40.5), followed by a nonlinear decline. The peak of the increased rate of growth occurred at 17.8 years (95% bootstrap CI 14.8-20.0), while the maximum rate of decline was observed at 57.4 years (95% bootstrap CI 55.8-59.9). Global variance in whole-brain functional connectivity (Fig. 1d) also showed a nonlinear growth pattern, peaking in adulthood at 34.7 years (95% bootstrap CI 32.4-37.2), with maximum rates of increase and decline occurring at 32 postmenstrual weeks and 59.0 years (95% bootstrap CI 57.4-62.9), respectively. By dividing participants from 32 postmenstrual weeks to 80 years of age into 26 distinct age groups, we created the first set of age-specific brain atlases spanning the lifespan (Fig. 2a). Consistent with the developmental pattern of the age-specific atlas (Fig. 2b-2e), the normative growth trajectories showed that the similarity of the individualized atlas to the reference increased from 32 postmenstrual weeks, peaked at 31.7 years (95% bootstrap CI 30.7-32.6), remained stable until 54.1 years (95% bootstrap CI 53.7-54.6), and then continuously declined at an accelerated rate until 80 years of age (Fig. 2f and 2g). Whole-brain system segregation across all systems peaked at 24.7 years (95% bootstrap CI 23.0-26.0) and showed a more pronounced accelerated decline around the sixth decade of life (Fig. 3a). Different networks manifested heterochronous growth patterns (Fig. 3b-3d). Lifespan growth of functional connectivity at the regional level reveals a spatial gradient pattern (Fig. 4). Compared to the healthy control group, patients with ASD and patients with MDD showed significant deviations in functional connectome metrics (p < 0.001, false discovery rate (FDR) corrected, Fig. 5).Conclusion
Through systematic analysis at the whole-brain, system, and regional levels, we charted the multiscale, nonlinear trajectories of the functional connectome and revealed previously unidentified key growth milestones. To provide a lifespan characterization of functional brain systems, we created age-specific atlases spanning 32 postmenstrual weeks to 80 years of age, serving as a foundational resource for future research on brain network development and aging. Using two large disease datasets, we explored the utility of the connectome-based normative model in capturing individual heterogeneity within these clinical populations, underscoring its potential to advance our understanding of neuropsychiatric disorders.Acknowledgements
This work was supported by the National Natural Science Foundation of China (Nos. 82021004, 31830034, 31521063, 31221003, 61431012, 81571062, 81471120, 8143003, 61633018, 81972160, 82172018, 81971690, 81920108019, 82330058, 32130045), Changjiang Scholar Professorship Award (No. T2015027). We are grateful to the Adolescent Brain Cognitive Development (ABCD) Study, the Autism Brain Imaging Data Exchange (ABIDE) Initiative, the Alzheimer’s Disease Neuroimaging Initiative (ADNI), the Age_ility Project, the Baby Connectome Project (BCP), the Brain Genomics Superstruct Project (BGSP), the Calgary Preschool MRI Dataset, the Cambridge Centre for Ageing and Neuroscience (Cam-CAN) Dataset, the developing Human Connectome Project (dHCP), the Human Connectome Project (HCP), the Lifespan Human Connectome Project (HCPA & HCPD), the Nathan Kline Institute-Rockland Sample (NKI-RS) Dataset, the Neuroscience in Psychiatry Network (NSPN) Dataset, the Pixar Dataset, the Southwest University Adult Lifespan Dataset (SALD), the Southwest University Longitudinal Imaging Multimodal (SLIM) Brain Data Repository, the UK Biobank (UKB) Brain Imaging Dataset, the Disease Imaging Data Archiving: major depressive disorder (DIDA-MDD) Working Group (PI: Yong He, Lingjiang Li, Jingliang Cheng, Qiyong Gong, Ching-Po Lin, Jiang Qiu, Shijun Qiu, Tianmei Si, Yanqing Tang, Fei Wang, Peng Xie, Xiufeng Xu, and Mingrui Xia), the Multi-center Alzheimer Disease Imaging (MCADI) Consortium (PI: Yong Liu, Xi Zhang, Yuying Zhou, Ying Han, and Qing Wang). We thank the National Center for Protein Sciences at Peking University in Beijing, China, for assistance with MRI data acquisition.References
1. Cao, M., Huang, H. & He, Y. Developmental Connectomics from Infancy through Early Childhood. Trends Neurosci 40, 494-506 (2017).
2. Gao, W., Lin, W., Grewen, K. & Gilmore, J.H. Functional Connectivity of the Infant Human Brain: Plastic and Modifiable. Neuroscientist 23, 169-184 (2017).
3. Zuo, X.N., et al. Human Connectomics across the Life Span. Trends Cogn Sci 21, 32-45 (2017).
4. Grayson, D.S. & Fair, D.A. Development of large-scale functional networks from birth to adulthood: A guide to the neuroimaging literature. Neuroimage 160, 15-31 (2017).
5. Di Martino, A., et al. Unraveling the miswired connectome: a developmental perspective. Neuron 83, 1335-1353 (2014).
6. Ecker, C., Bookheimer, S.Y. & Murphy, D.G.M. Neuroimaging in autism spectrum disorder: brain structure and function across the lifespan. The Lancet Neurology 14, 1121-1134 (2015).
7. Di Martino, A., et al. Shared and distinct intrinsic functional network centrality in autism and attention-deficit/hyperactivity disorder. Biol Psychiatry 74, 623-632 (2013).
8. Perovnik, M., Rus, T., Schindlbeck, K.A. & Eidelberg, D. Functional brain networks in the evaluation of patients with neurodegenerative disorders. Nat Rev Neurol 19, 73-90 (2023).
9. Chai, Y., et al. Functional connectomics in depression: insights into therapies. Trends Cogn Sci (2023).
10. Fornito, A., Zalesky, A. & Breakspear, M. The connectomics of brain disorders. Nat Rev Neurosci 16, 159-172 (2015).
11. Gong, Q. & He, Y. Depression, neuroimaging and connectomics: a selective overview. Biol Psychiatry 77, 223-235 (2015).
12. Cole, T.J. The development of growth references and growth charts. Ann Hum Biol 39, 382-394 (2012).
13. Bethlehem, R.A.I., et al. Brain charts for the human lifespan. Nature (2022).
14. Rutherford, S. Charting brain growth and aging at high spatial precision. eLife (2021).
15. Chen, L.Z., Holmes, A.J., Zuo, X.N. & Dong, Q. Neuroimaging brain growth charts: A road to mental health. Psychoradiology 1, 272-286 (2021).
16. Borghi, E., et al. Construction of the World Health Organization child growth standards: selection of methods for attained growth curves. Stat Med 25, 247-265 (2006).
Figures