1293
Functional conductivity imaging: quantitative mapping of brain activity1Neuroscience Research Australia, UNSW, Randwick, Australia, 24. Pathfinder Exploration LLC, Reno, NV, United States, 3Philips Australia and New Zealand, Sydney, Australia
Synopsis
Keywords: Task/Intervention Based fMRI, Brain
Motivation: Theory and modelling suggest that detection of neuronal activity may be feasible using phase sensitive MRI methods.
Goal(s): To demonstrate successful application of phase-based MREPT to functional tasks in brain
Approach: Using bFFE optimised for fast acquisition, data were acquired from 5 participants undertaking visual stimulation or somatosensory stimulation. Electrical conductivity values extracted from phase images were fitted with the measured stimulus response function.
Results: Images showed consistent activation of visual circuitry (~0.1 S/m) in both grey and white matter with similar circuit responses to somatosensory stimulation. Conductivity increased with stimulus duration or increased contrast and was faster, temporally, than BOLD.
Impact: Functional conductivity imaging (funCI) reveals activity in both grey and white matter. The sensitivity, repeatability and time course of funCI shows that MRI can detect brain activation beyond changes in blood supply.
Introduction
Theory and modelling suggest that detection of neuronal activity may be feasible using phase sensitive MRI methods. Successful detection of neuronal activity both in vitro and in vivo has been described while others have reported negative results. Magnetic resonance electrical properties tomography has been applied as a functional variant to regions of interest in the brain, with changes reported upon activation 1,2. Here, we adapted a static measure of brain electrical tissue conductivity3 for use as a dynamic functional imaging tool.Methods
Participants: Data for visual and somatosensory stimulation was acquired from five different healthy participants for each of visual, finger and toe stimulation.Image acquisition: All images were acquired at 3T using a 32 channel digital head coil (Ingenia CX, Philips, Best, The Netherlands) and two channel parallel transmit SENSE. B_1^+ mapping used single-slice 2D DREAM4. T1-weighted structural images were acquired using 3D T1-turbo field echo (TR/TE/TI = 5.89/2.76/850 ms, resolution 1×1×1 mm^3, sagittal slices, FOV 240×240 mm^2, flip angle 8° compressed SENSE factor 4). Tissue conductivity was estimated from images acquired using a 3D non-selective balanced fast field echo sequence (TR/TE 1.89/0.78 ms, 25° flip angle, compressed SENSE factor 4, 3 mm isotropic resolution, FOV = 240 x 240, sagittal acquisition, 220 dynamics and 5 dummy scans.
Image processing: T1w TFE map was segmented into WM/GM/CSF and co-registered to realigned bFFE scans. Within each tissue type, an average parabolic phase fitting method was used to reconstruct conductivity maps from phase, using , where is conductivity, denotes the transceive phase, is the magnetic permeability of free space, is angular frequency (Larmor frequency) and is the Laplacian operator. For each stimulus cycle, the zero-time point was taken as the starting time of the stimulus. The conductivity calculated from each dynamic scan was assumed to be at the halfway point of the scan acquisition (time to acquire half of k-space). By offsetting each stimulus cycle, the temporal resolution of the conductivity signal was improved up to 100 ms. The conductivity response function was estimated via a 10th order discrete Laguerre polynomial fitted using the least squares method. Conductivity images for activation mapping were processed using a first level (general linear model) GLM and convolving the signal using the derived conductivity response function. The obtained T-value maps were co-registered to and overlaid on the high-resolution T1W images in SPM 12
Results
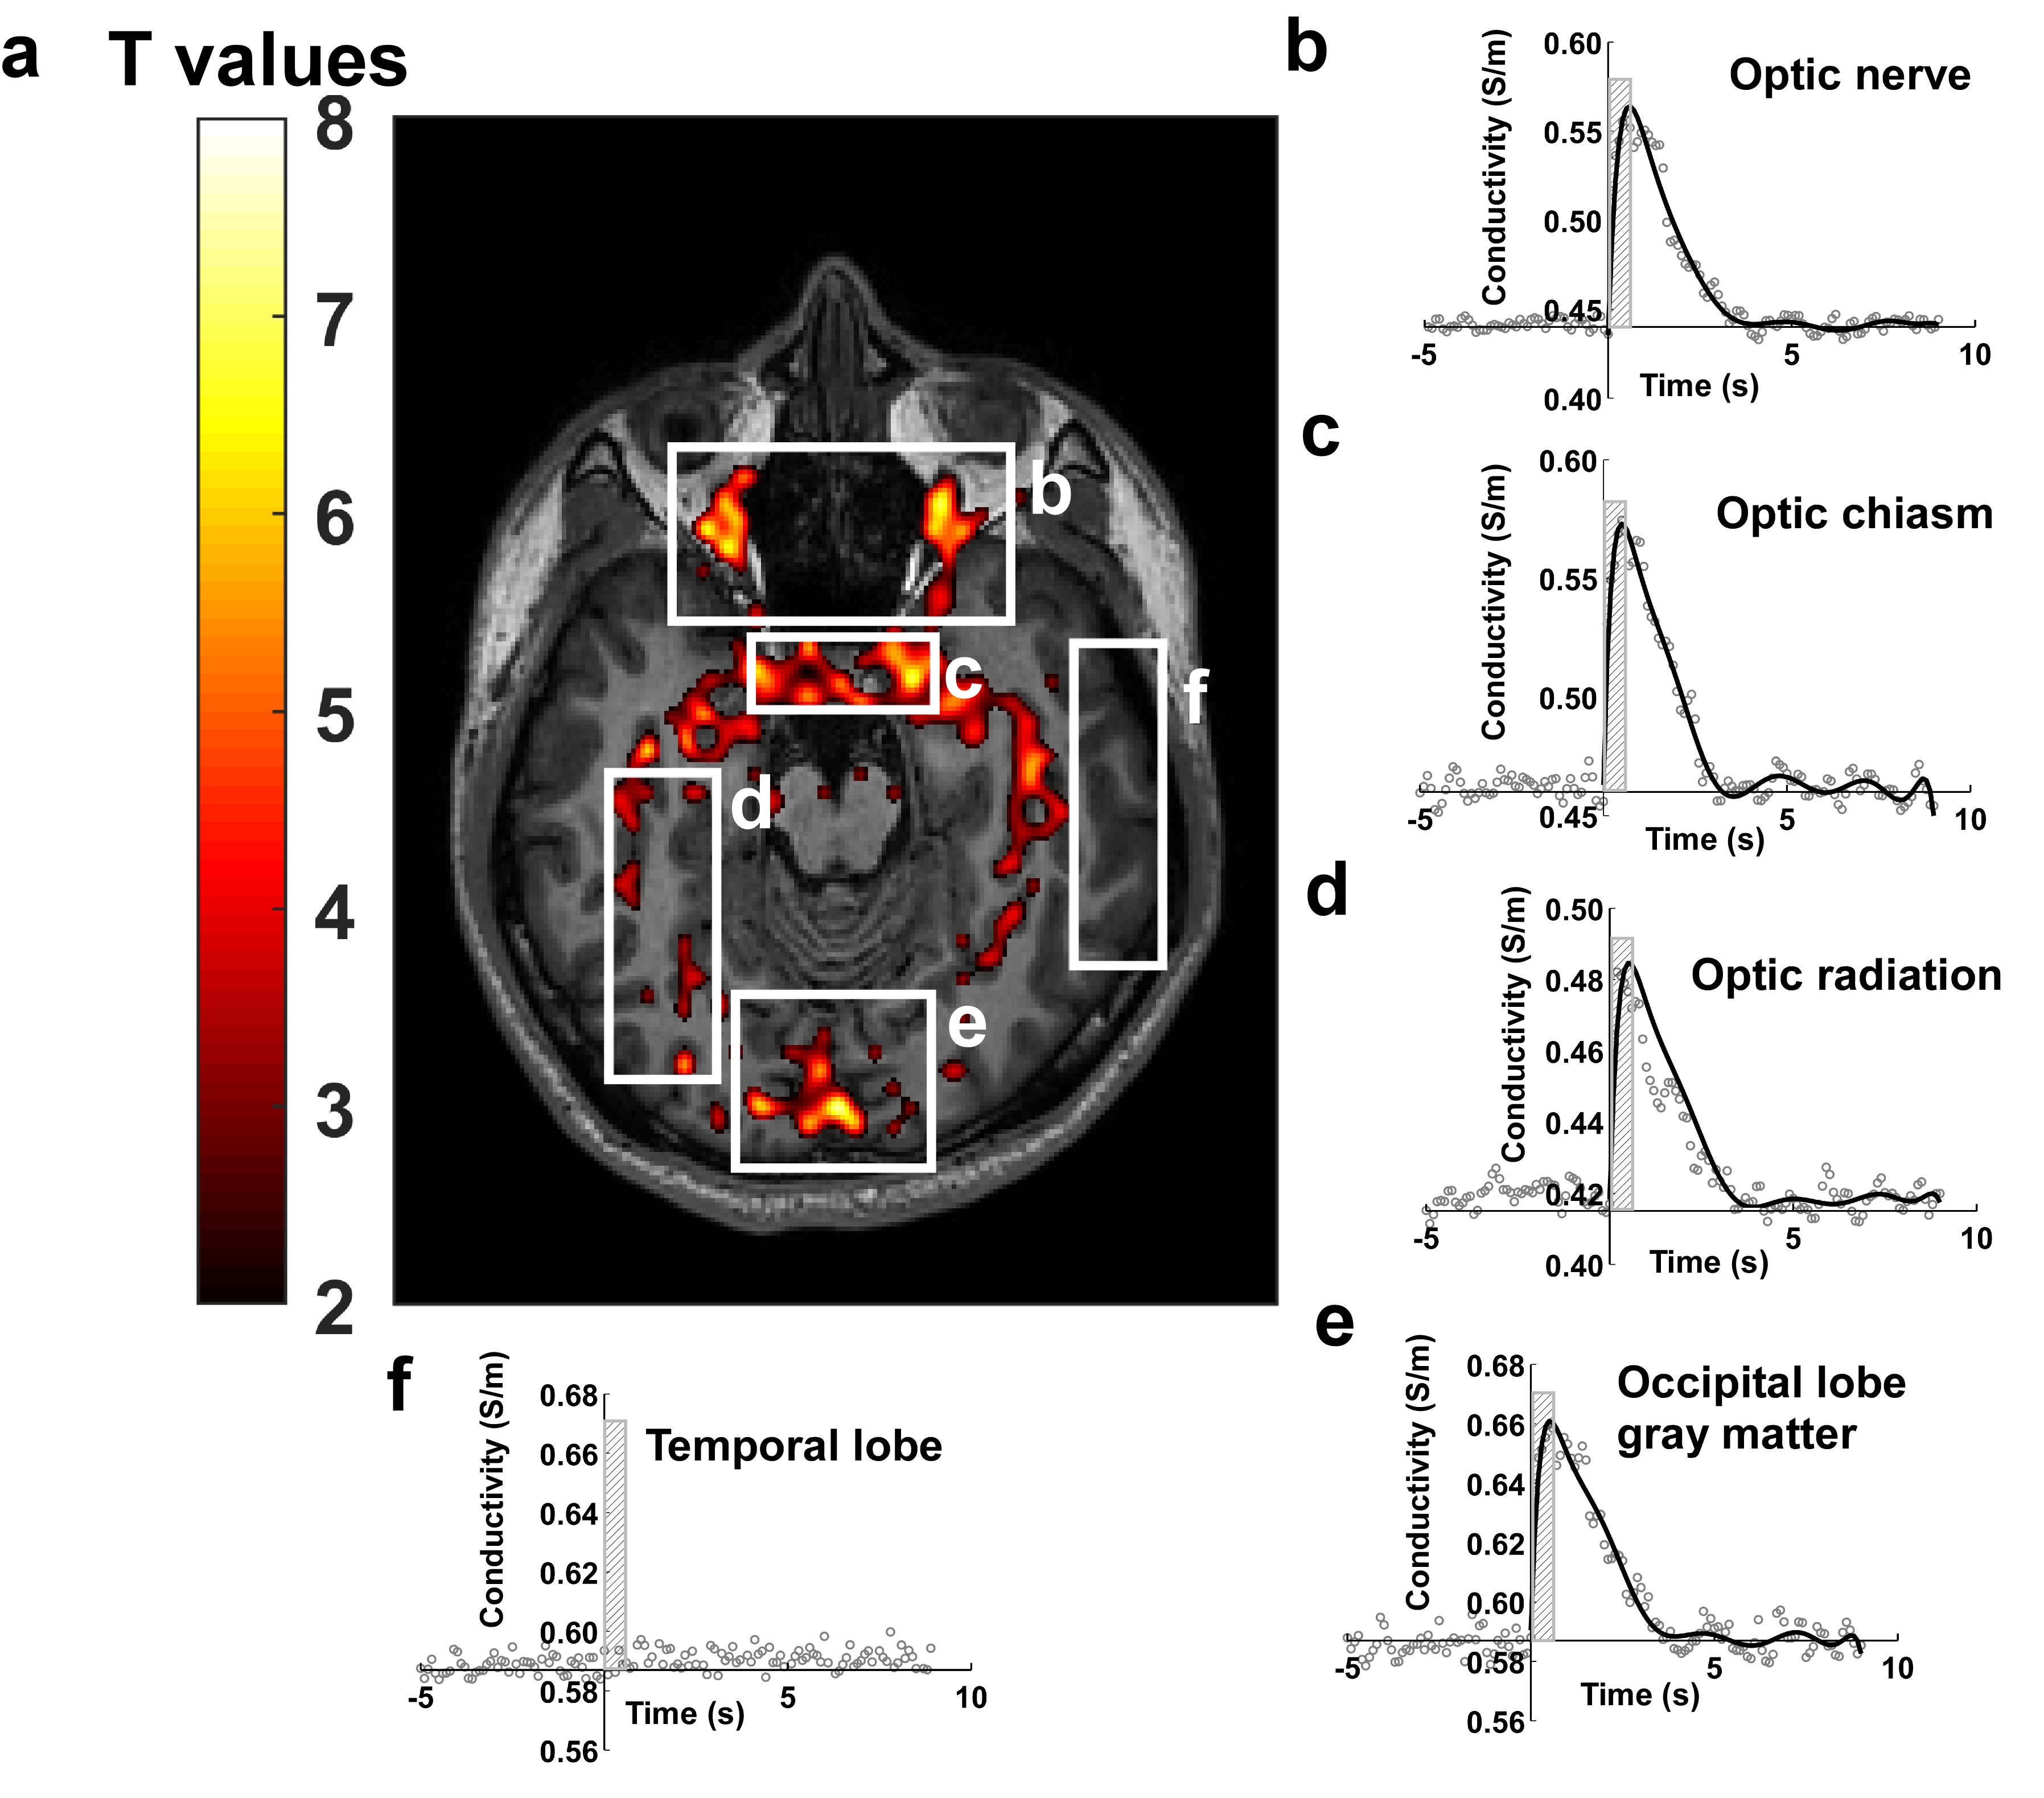
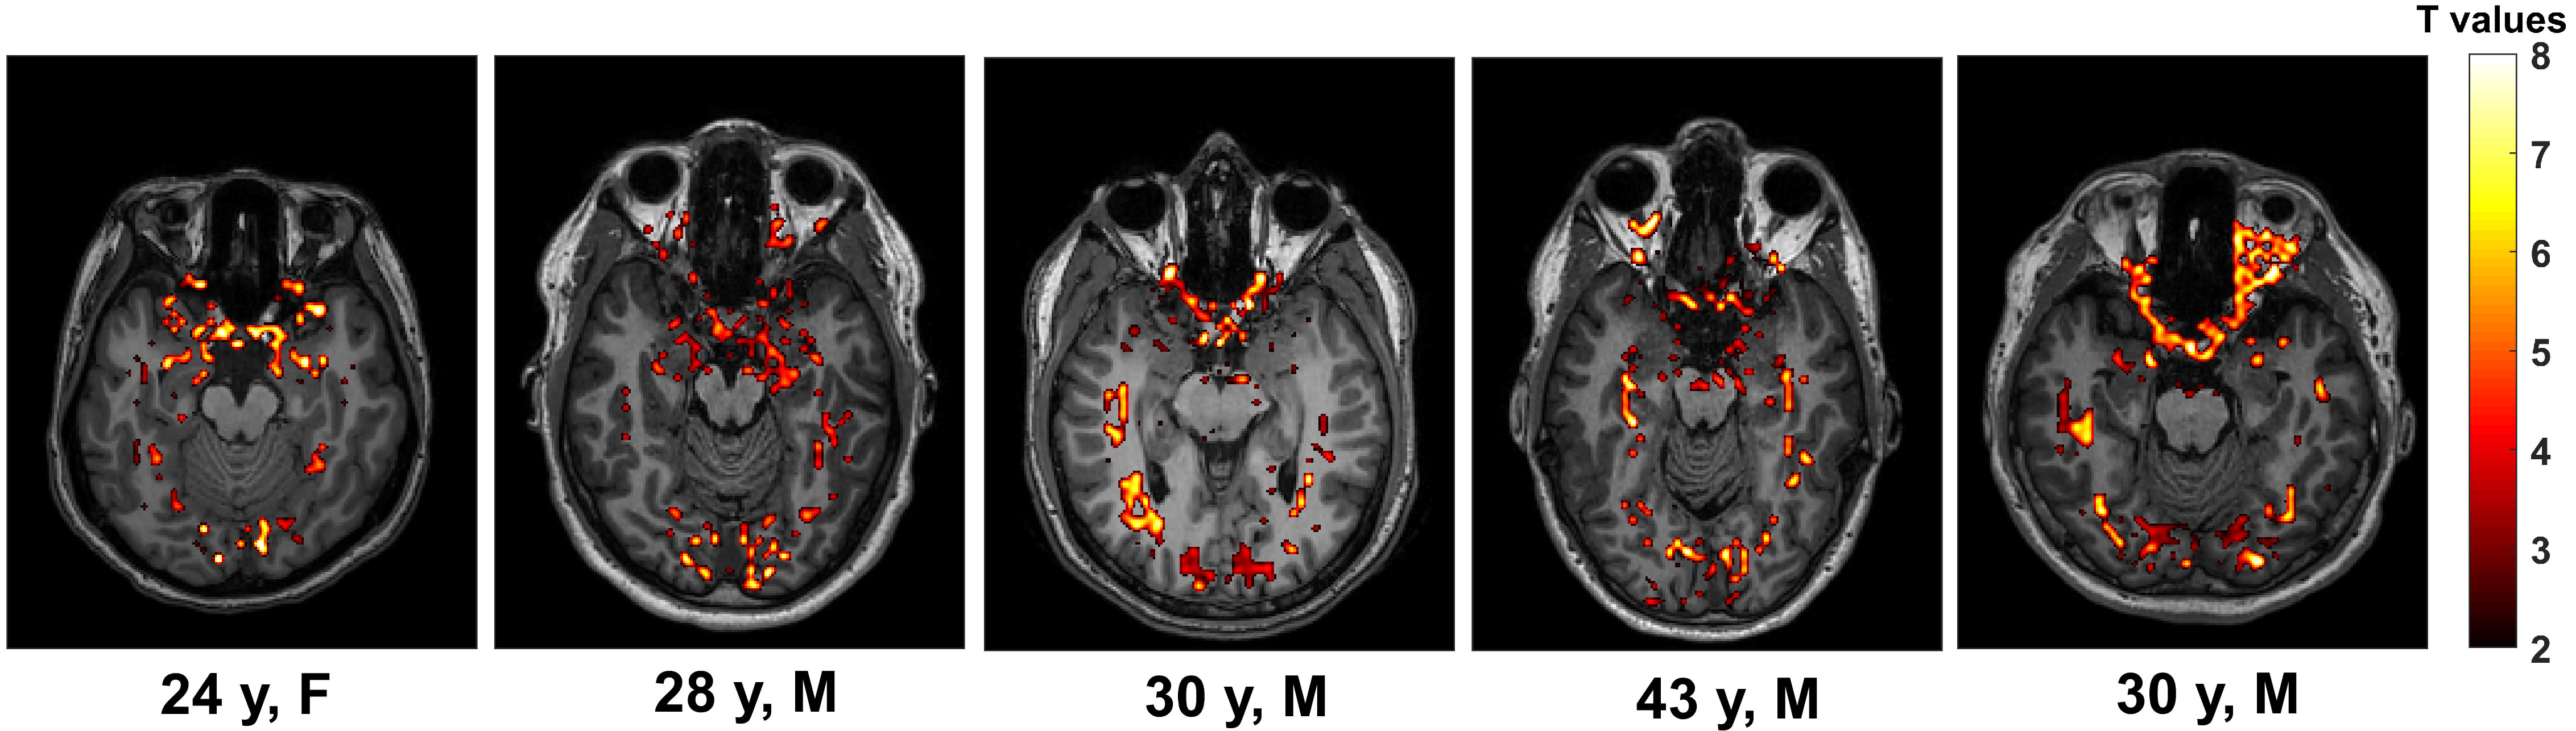
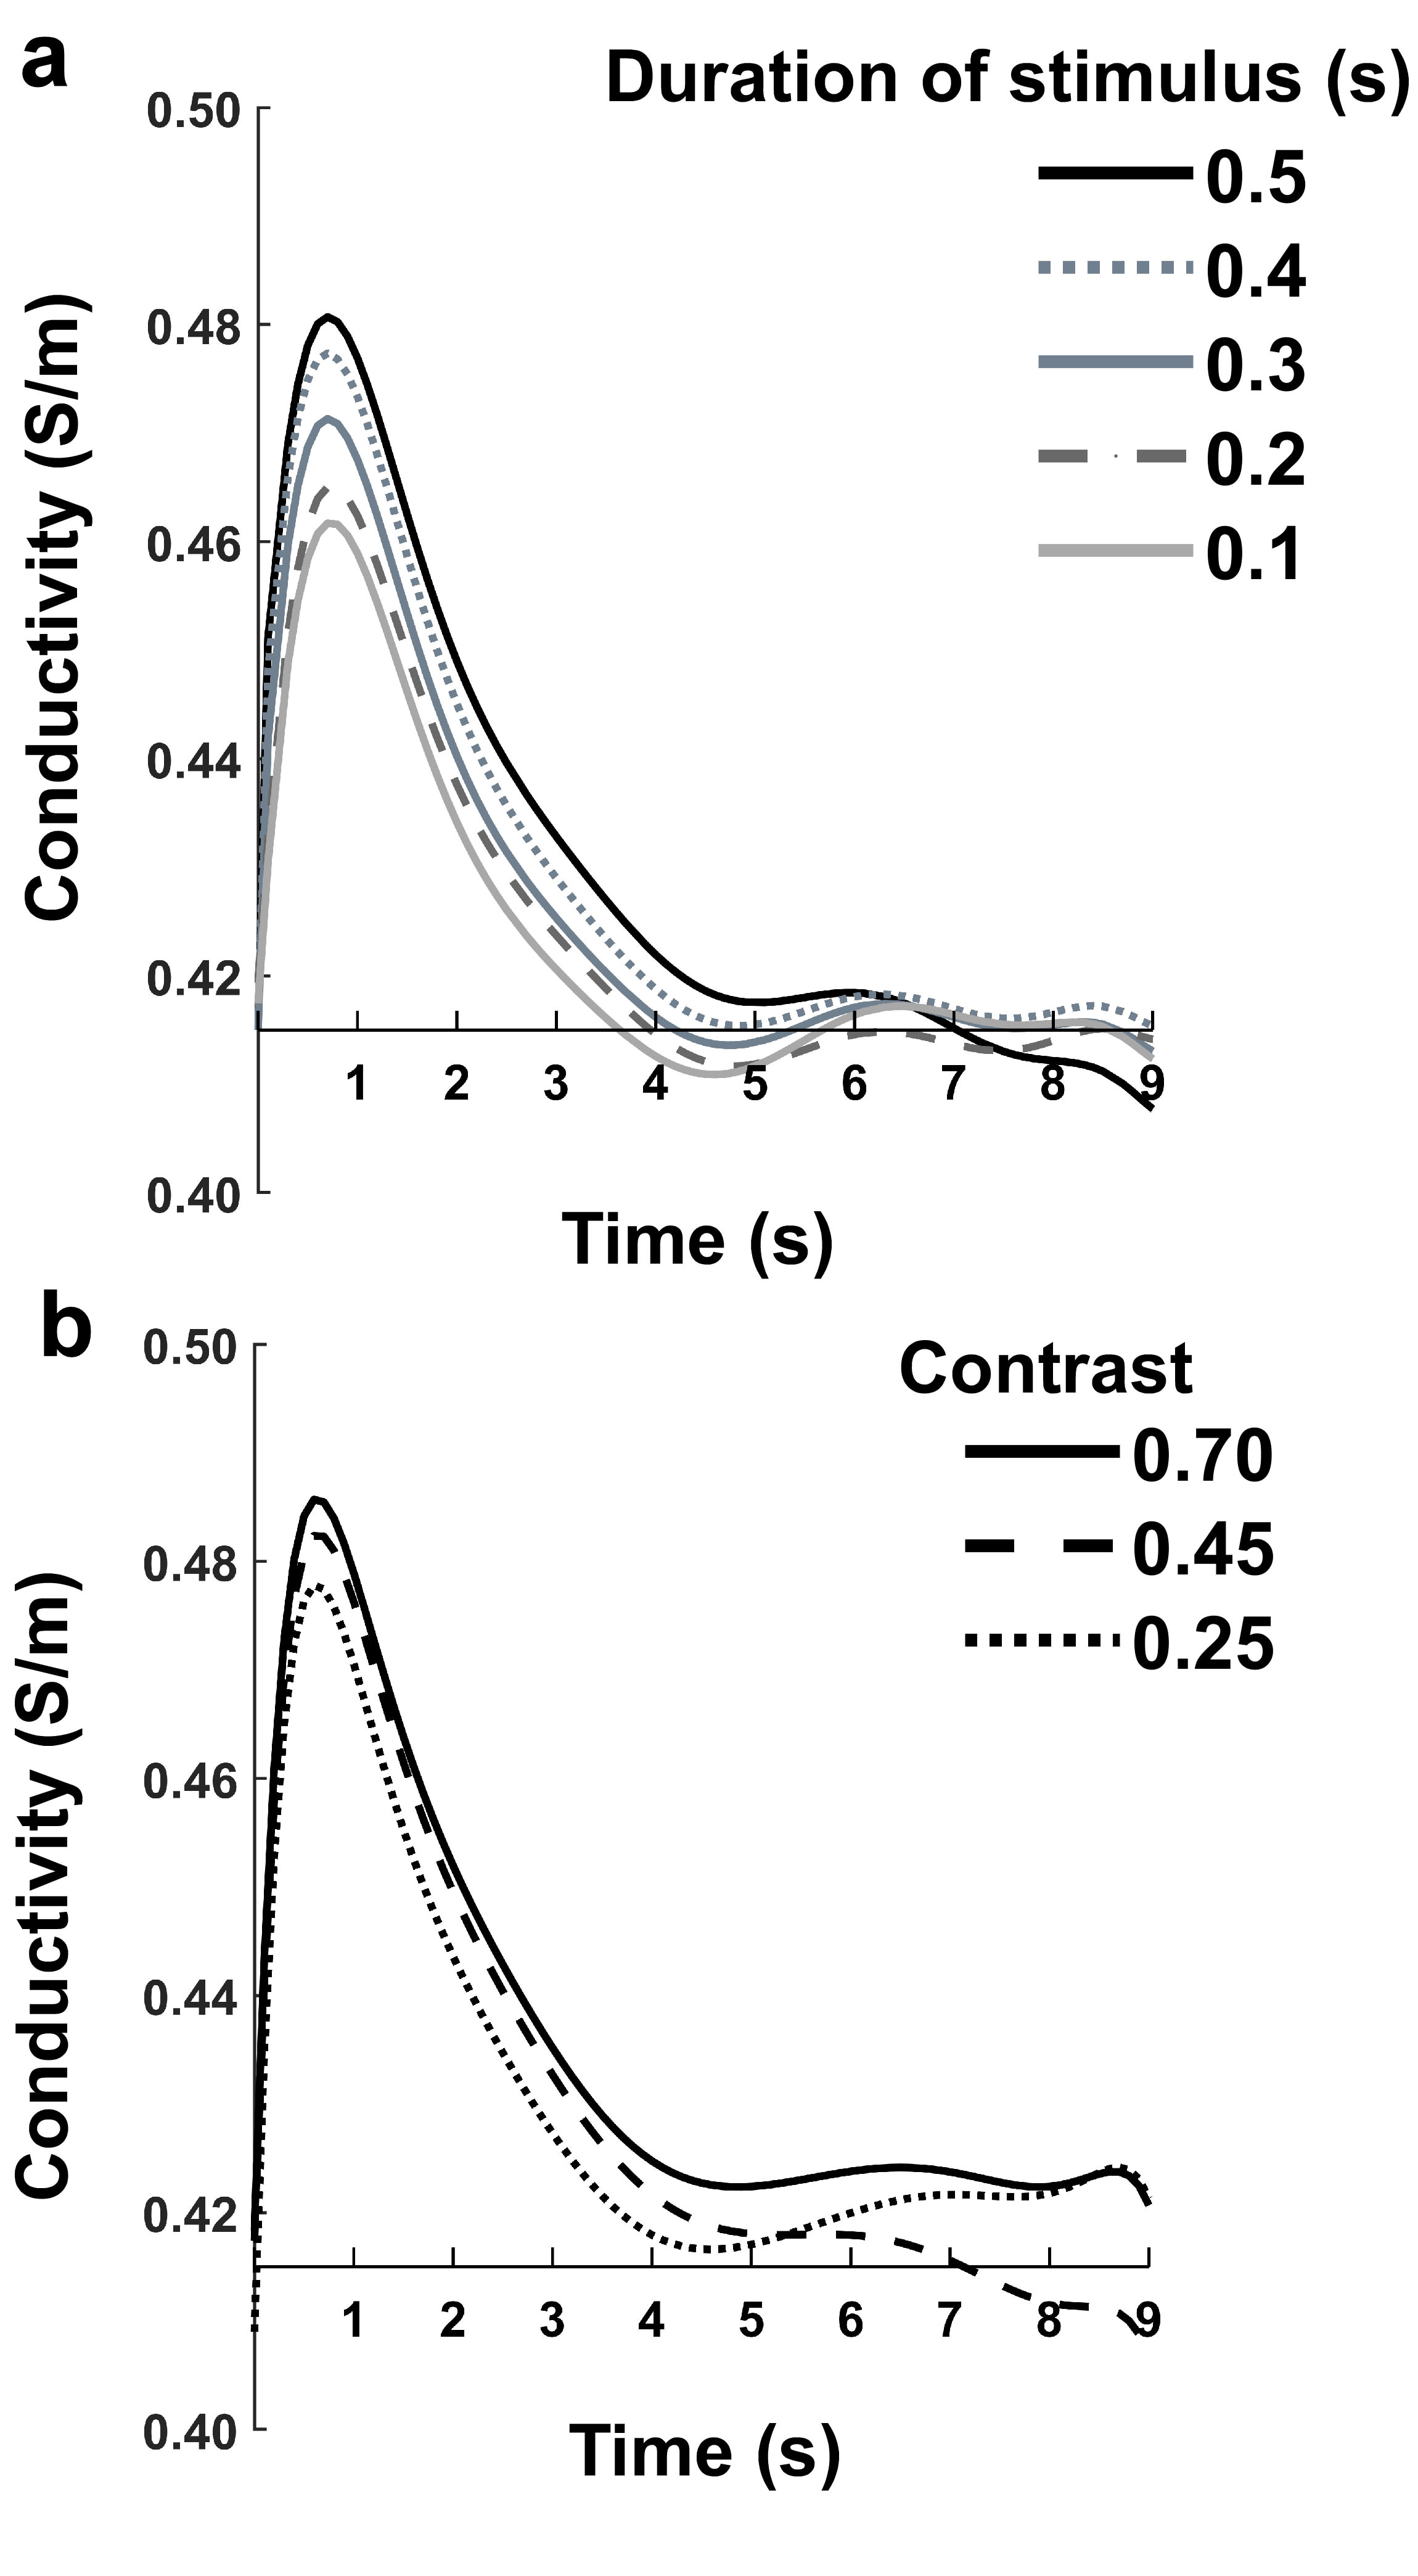
Stimulating the visual system with a flashing grey-scale checkerboard for 0.5 s produced significant increases (~0.1 siemens/m) in tissue conductivity in areas of the brain associated with the visual system, including around the optic nerve, optic chiasm, optic radiation and in the white and grey matter of the occipital cortex (Fig. 1). Individual responses to this stimulus in five different individuals are shown in native space in Fig. 2 indicative of good repeatability. The estimated funCI response function to this stimulus in the main regions of the brain involved in visual response is shown in Fig. 1 where similar (0.1 S/m) responses are seen in activated regions, while no significant change is seen in, for example, temporal lobe. Repeat measurement of response functions in the two different participants on the same day or on different days showed good intraclass correlation (≥0.89 depending on region).Figure 3 shows the stimulus and contrast responses from optic nerve and occipital lobe white and grey matter to increasing stimulus duration (0.1-1.5 s) or increasing contrast (greyscale 0.25, 0.45 and 0.7).
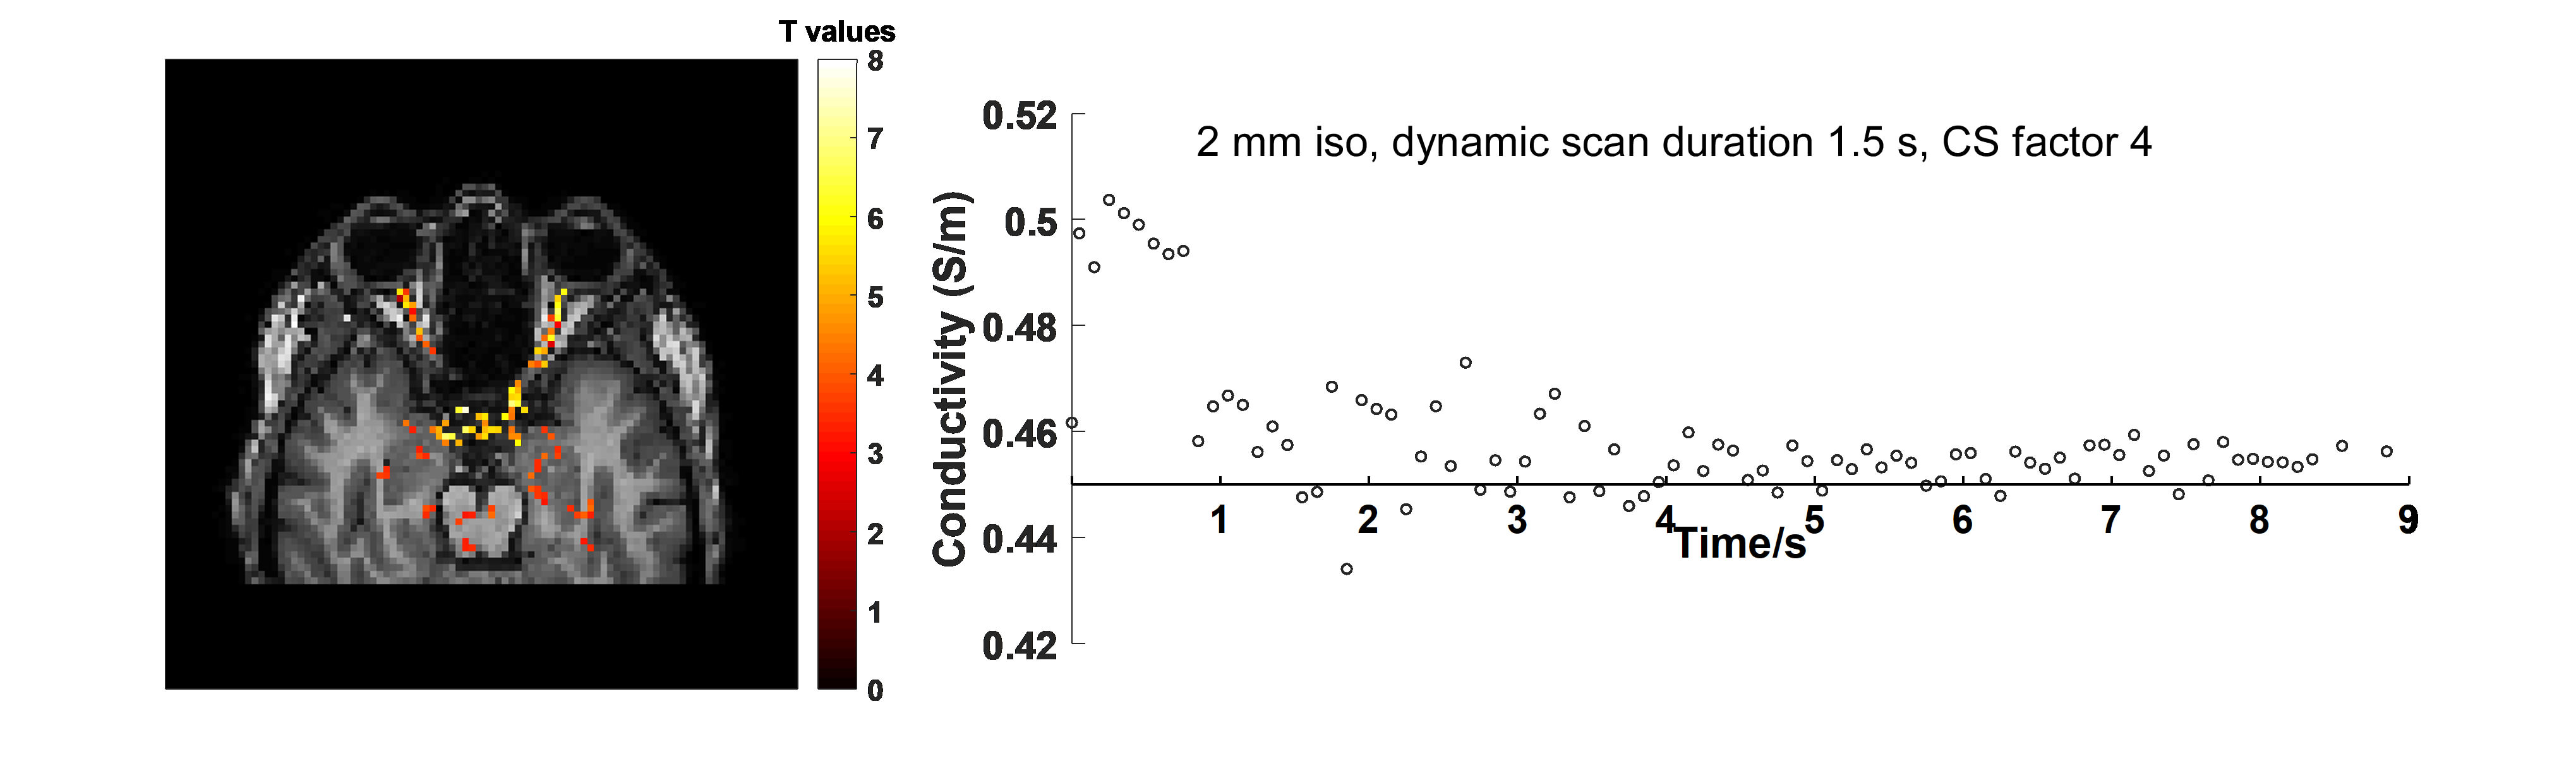
As the analysis method can result in some smoothing effects which may result in lack of clarity of the anatomical activation, we repeated the visual stimulation at higher resolution across the orbits with the results (Fig. 4) indicating that finer acquisition resolution improves anatomical precision, as would be expected.
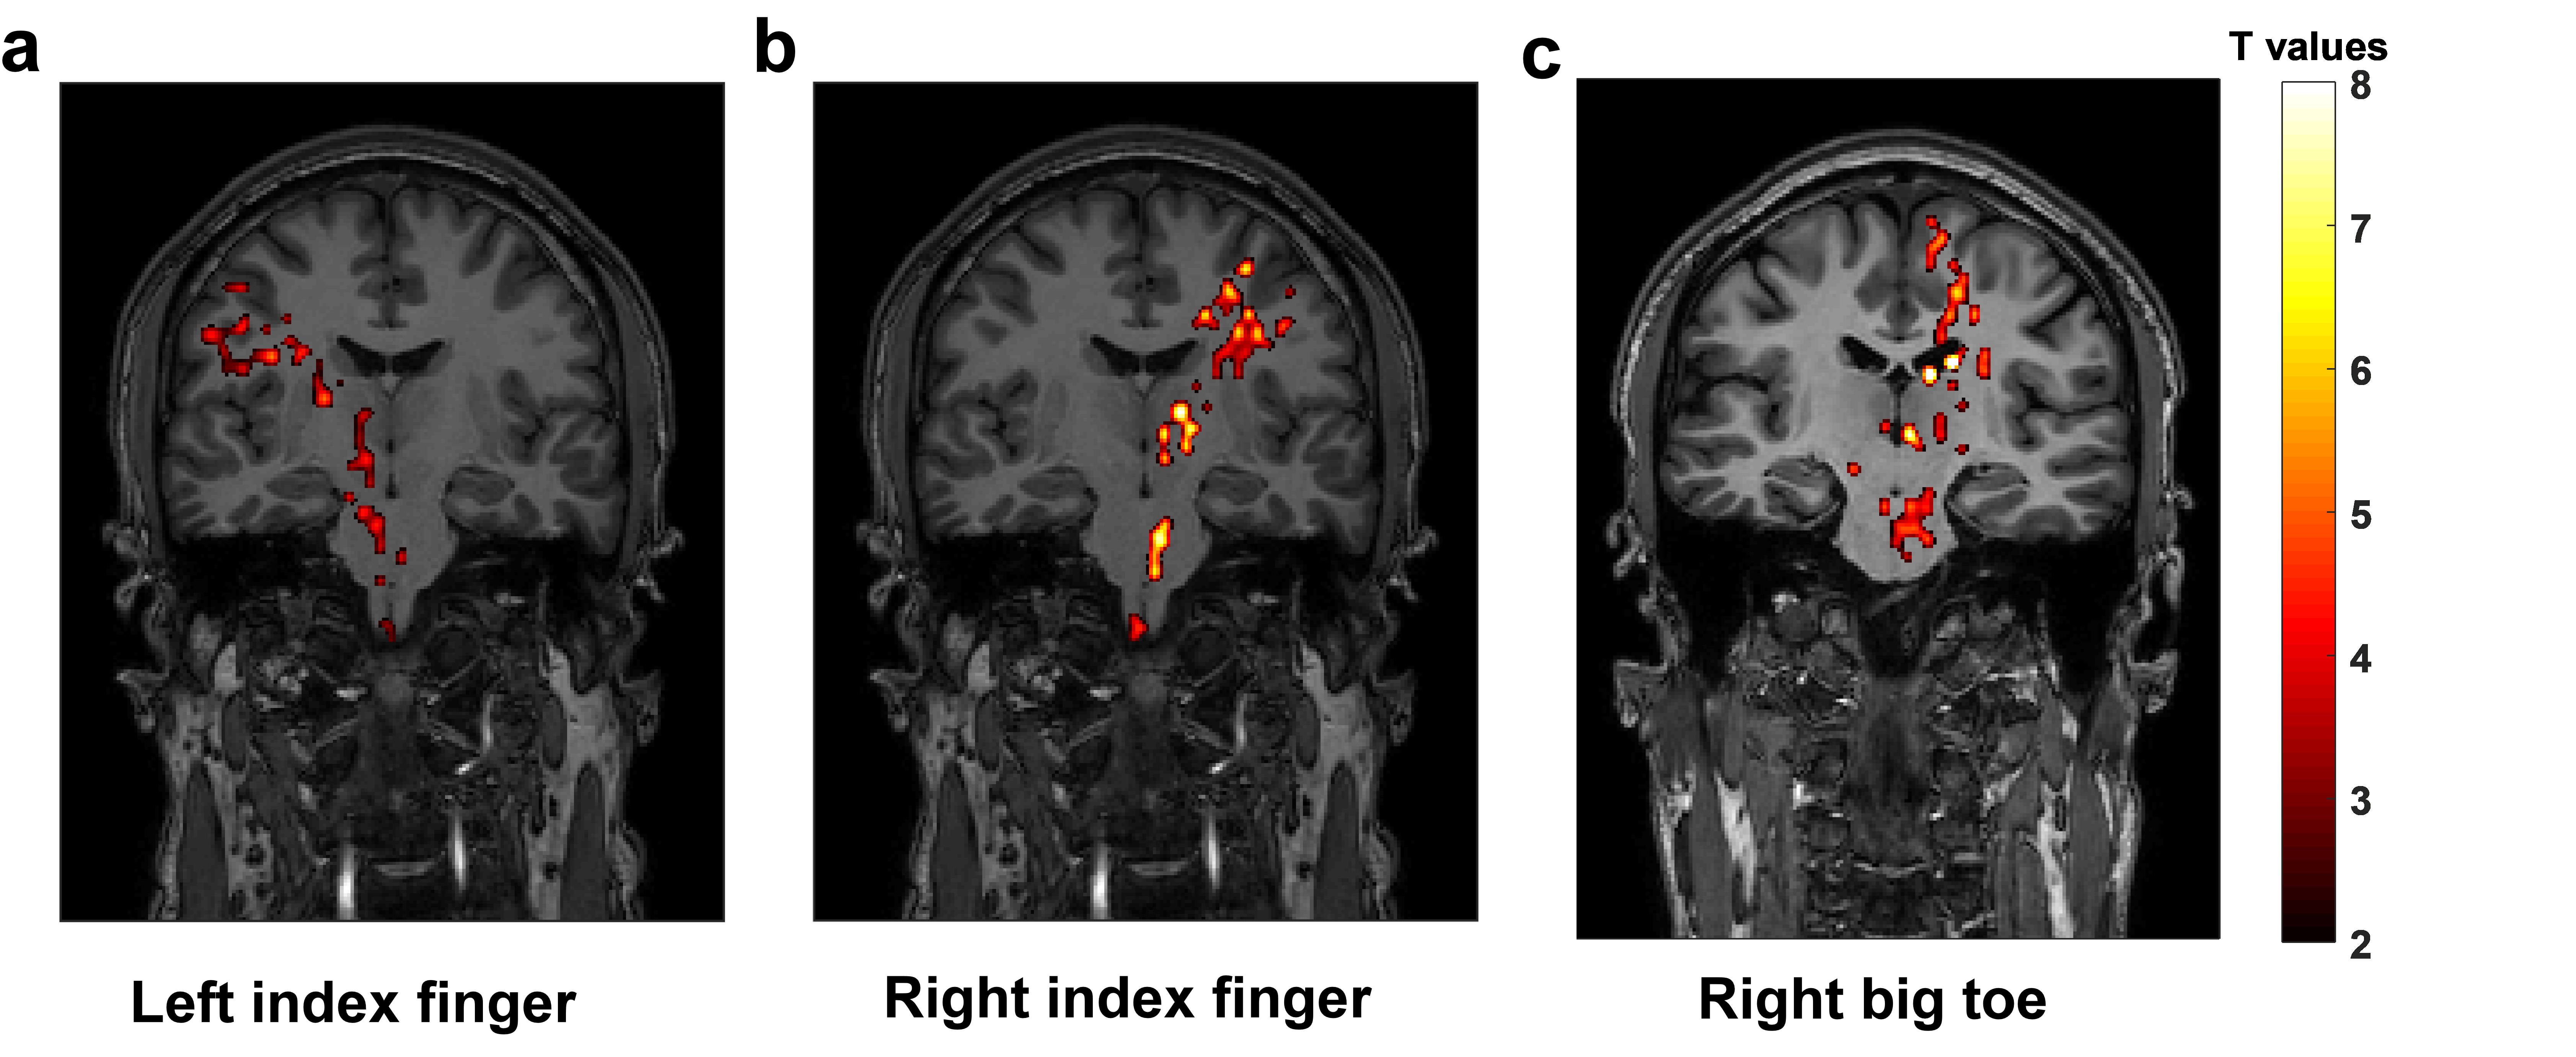
The response to having the left index finger (fig. 5a), right index finger (5b) and right big toe (5c) scraped with a plastic fork is shown in Fig 5, revealing activation in the corticospinal tract, thalamus and the relevant anatomical position in the somatosensory homunculus.
Discussion
funCI delivers consistent quantitative activation in both grey and white matter, of around 0.1 S/m on a time course which is different to that of the BOLD response, with activation decreasing immediately upon cessation of the stimulus. Given the reported values of blood conductivity5 including in the oxy- and de-oxy state6, the change is unlikely to be due to vascular effects.Acknowledgements
The authors acknowledge the facilities and scientific and technical assistance of the National Imaging Facility, a National Collaborative Research Infrastructure Strategy (NCRIS) capability, at the NeuRA Imaging, NeuRA, UNSW Node.References
1. Helle M, Katscher U. Electrical properties tomography based functional magnetic resonance imaging (EPT-fMRI). 2019. p 3759.
2. Schmidt R. Electrical conductivity as a potential mean to decouple the hemodynamic response from fMRI. 2019. p 3777.
3. Cao J, Ball I, Humburg P, Dokos S, Rae C. Repeatability of brain phase-based magnetic resonance electric properties tomography methods and effect of compressed SENSE and RF shimming. Physical and Engineering Sciences in Medicine 2023;46:753-766.
4. Nehrke K, Börnert P. DREAM—a novel approach for robust, ultrafast, multislice B1 mapping. Magn Reson Med 2012;68(5):1517-1526.
5. Gabriel C, Gabriel S, Corthout Y. The dielectric properties of biological tissues: I. Literature survey. Phys Med Biol 1996;41(11):2231.
6. Hirsch FG, Texter EC, Wood LA, Ballard WC, Horan FE, Wright IS. The electrical conductivity of blood: I. Relationship to Erythrocyte Concentration. Blood 1950;5(11):1017-1035.
Figures