1292
Resting-State Functional Quantitative Susceptibility Mapping (rsfQSM)1Medical Physics and Biomedical Engineering, University College London, London, United Kingdom, 2Dementia Research Center, Institute of Neurology, University College London, London, United Kingdom
Synopsis
Keywords: Functional Connectivity, Quantitative Susceptibility mapping, Brain connectivity, resting-state fQSM
Motivation: Task-based functional Quantitative Susceptibility Mapping (fQSM) shows more localized brain activations than fMRI. Resting-state fMRI reveals brain connectivity networks but resting-state analysis of QSM has not yet been performed and may provide complementary information.
Goal(s): To perform a resting-state functional analysis using QSM (rsfQSM) and compare it to rsfMRI, focusing on the Default Mode Network (DMN).
Approach: We used seed-based and ICA-based analyses for rsfQSM and assessed the similarity of the DMN to that in rsfMRI with quantitative metrics.
Results: The DMN was detected in rsfQSM with spatial similarities to the DMN in rsfMRI. rsfQSM showed weaker and less extensive functional connectivity.
Impact: We computed resting-state functional connectivity from magnetic susceptibility maps for the first time, revealing similarities in the default-mode network compared to rsfMRI. This paves the way for new QSM-based explorations of brain function to potentially deepen understanding of neurological diseases.
Introduction
Resting-state functional magnetic resonance imaging (rsfMRI) has advanced our understanding of the brain's intrinsic functional architecture by revealing resting-state networks (RSNs) [1], [2], including the Default Mode Network (DMN) [3]. As changes in blood susceptibility underlie Blood-Oxygen-Level-Dependent (BOLD) fMRI [4] and given that Quantitative Susceptibility Mapping (QSM) has been used in task-based functional QSM (fQSM) to reveal more localized, complementary activations [5]–[8], we investigated whether QSM can probe resting-state functional connectivity, rsfQSM. Here, we performed the first resting-state analysis using QSM and compared it to conventional rsfMRI, focusing on the DMN.Methods
Image acquisition: 70 volumes of multi-echo 2D GRE EPI [9] were acquired in a healthy 25-year-old male volunteer on a 3T Siemens Prisma using a 64-channel head coil, with 1.3 mm isotropic resolution; GRAPPA=4; MB=3; partial Fourier 6/8; TE=14.8, 39.33, 68.86 ms; TR=4034 ms; TA = 6 min 15 s. Structural T1-weighted images were acquired for anatomical reference. The participant was instructed to keep their eyes open while focusing on a red cross displayed on a projector screen [10].Data analysis:
The complex multi-echo data were denoised using MP-PCA [11], [12]. For the rsfMRI analysis, the multi-echo magnitude images were combined using T2*-weighted echo summation [13].
QSM was calculated at each timepoint [14]: the total field map was calculated using a non-linear fit of the complex data [15] plus Laplacian unwrapping [16]; brain masks were calculated for each volume using FSL-BET [17] on the magnitude images from the second echo; background fields were removed with 2D + 3D VSHARP [18] and susceptibility maps were calculated using non-linear total variation regularisation (FANSI, a = 2 x 10⁻⁴) [19].
Absolute susceptibility maps were used for resting-state analysis to minimise the impact of opposite sign susceptibility cancellation of neighbouring voxels on smoothing [20].
Resting-state analysis:
Seed-based connectivity maps (SBC) were computed with 164 HCPICA networks using CONN [21]. We used CONN's default preprocessing and denoising pipelines including spatial smoothing with an 8-mm FWHM kernel. The strength of functional connectivity was expressed using Fisher-transformed bivariate correlation coefficients obtained by fitting a weighted general linear model (GLM) [22].
Independent Component Analysis (ICA) was performed using FSL MELODIC [23] with its default preprocessing and denoising pipelines. The smoothing kernel’s FWHM was changed to 8 mm to match that used in CONN. The statistical significance of each independent component is measured with z-scores.
Default-Mode Network analysis:
SBC: The DMN using the Medial Prefrontal Cortex (MPFC) seed was compared between rsfMRI and rsfQSM by calculating the Pearson correlation coefficient for the un-thresholded SBC maps and the Intersection Over Union (IOU) for SBC maps at two different thresholds: 0 to include all positive correlations, and 0.25 matched to CONN's default overlay threshold. These approaches are similar to template correlation employed in previous studies [24], [25].
ICA: All independent components (ICs) derived from rsfQSM were compared to the visually selected DMN IC from rsfMRI using the same metrics described above.
Results and discussion
Figure 1 displays rsfMRI and rsfQSM SBC maps of the DMN. The DMN derived from rsfQSM, shows weaker and less extensive connectivity than the rsfMRI DMN but is significantly spatially correlated with the rsfMRI DMN (Table 1).Figure 2 also illustrates the spatial similarity of rsfMRI and rsfQSM SBC maps, which was greatest in MPFC seed region, as expected.
The independent component analysis is presented in Figures 3 and 4 with the rsfMRI DMN visually identified as component #14 from a total of 23 ICs. This component explains 3.3% of the total variance. The rsfQSM DMN component was selected as that with the highest Pearson correlation coefficient and IOU with the rsfMRI DMN component. It was component #3 of a total of 12 ICs and explains 3.24% of the total variance. The rsfQSM DMN component is again weaker and less extensive than the rsfMRI DMN although with a significant similarity according to the Pearson correlation coefficient and IOU values (Table 1).
Both rsfMRI and rsfQSM DMN components had a dominant frequency of ~0.01 Hz. Interestingly, the spectrum of the rsfQSM DMN component showed several frequencies, possibly due to physiological noise.
Conclusions
This study introduces the first resting-state functional quantitative susceptibility mapping (rsfQSM) analysis and demonstrates its potential as a complementary technique to resting-state fMRI (rsfMRI). The rsfQSM functional connectivity in the default mode network from seed-based correlation and independent component analysis was spatially similar in to rsfMRI but showed weaker, less extensive functional connectivity. This novel rsfQSM approach offers a new perspective on functional brain connectivity for future neuroimaging research and may contribute to a deeper understanding of neurological disorders.Acknowledgements
This study was supported by the European Research Council Consolidator Grant DiSCo MRI SFN 770939.References
[1] M. P. van den Heuvel and H. E. Hulshoff Pol, “Exploring the brain network: a review on resting-state fMRI functional connectivity,” Eur. Neuropsychopharmacol. J. Eur. Coll. Neuropsychopharmacol., vol. 20, no. 8, pp. 519–534, Aug. 2010, doi: 10.1016/j.euroneuro.2010.03.008.
[2] M. H. Lee, C. D. Smyser, and J. S. Shimony, “Resting-State fMRI: A Review of Methods and Clinical Applications,” Am. J. Neuroradiol., vol. 34, no. 10, pp. 1866–1872, Oct. 2013, doi: 10.3174/ajnr.A3263.
[3] M. E. Raichle, A. M. MacLeod, A. Z. Snyder, W. J. Powers, D. A. Gusnard, and G. L. Shulman, “A default mode of brain function,” Proc. Natl. Acad. Sci. U. S. A., vol. 98, no. 2, pp. 676–682, Jan. 2001, doi: 10.1073/pnas.98.2.676.
[4] V. Jain, O. Abdulmalik, K. J. Propert, and F. W. Wehrli, “Investigating the magnetic susceptibility properties of fresh human blood for noninvasive oxygen saturation quantification,” Magn. Reson. Med., vol. 68, no. 3, pp. 863–867, 2012, doi: 10.1002/mrm.23282.
[5] D. Z. Balla et al., “Functional quantitative susceptibility mapping (fQSM),” NeuroImage, vol. 100, Jun. 2014, doi: 10.1016/j.neuroimage.2014.06.011.
[6] P. S. Özbay et al., “Probing neuronal activation by functional quantitative susceptibility mapping under a visual paradigm: A group level comparison with BOLD fMRI and PET,” NeuroImage, vol. 137, pp. 52–60, Aug. 2016, doi: 10.1016/j.neuroimage.2016.05.013.
[7] H. Sun, P. Seres, and A. H. Wilman, “Structural and functional quantitative susceptibility mapping from standard fMRI studies,” NMR Biomed., vol. 30, no. 4, Apr. 2017, doi: 10.1002/nbm.3619.
[8] Z. Chen and V. D. Calhoun, “Task-evoked brain functional magnetic susceptibility mapping by independent component analysis (χICA),” J. Neurosci. Methods, vol. 261, pp. 161–171, Mar. 2016, doi: 10.1016/j.jneumeth.2016.01.007.
[9] “Center for Magnetic Resonance Research Department of Radiology. Multi-Band Accelerated EPI Pulse Sequences. https://www.cmrr.umn.edu/multiband/.” Accessed: Nov. 06, 2023. [Online]. Available: https://www.cmrr.umn.edu/multiband/
[10] R. Patriat et al., “The effect of resting condition on resting-state fMRI reliability and consistency: A comparison between resting with eyes open, closed, and fixated,” NeuroImage, vol. 78, pp. 463–473, Sep. 2013, doi: 10.1016/j.neuroimage.2013.04.013.
[11] J. Veraart, D. S. Novikov, D. Christiaens, B. Ades-Aron, J. Sijbers, and E. Fieremans, “Denoising of diffusion MRI using random matrix theory,” NeuroImage, vol. 142, pp. 394–406, Nov. 2016, doi: 10.1016/j.neuroimage.2016.08.016.
[12] L. Doniza et al., “MP-PCA image denoising technique for high resolution quantitative susceptibility mapping (QSM) of the human brain in vivo,” Proc. ISMRM SMRT Annu. Meet., 2023.
[13] B. A. Poser, M. J. Versluis, J. M. Hoogduin, and D. G. Norris, “BOLD contrast sensitivity enhancement and artifact reduction with multiecho EPI: Parallel‐acquired inhomogeneity‐desensitized fMRI,” Magn. Reson. Med., vol. 55, no. 6, pp. 1227–1235, Jun. 2006, doi: 10.1002/mrm.20900.
[14] J. Nassar, oliver Kiersnowski, P. Fuchs, and K. Shmueli, “Preliminary Functional Quantitative Susceptibility Mapping with Multi-Echo EPI,” Proc. ISMRM SMRT Annu. Meet., 2023.
[15] T. Liu, C. Wisnieff, M. Lou, W. Chen, P. Spincemaille, and Y. Wang, “Nonlinear formulation of the magnetic field to source relationship for robust quantitative susceptibility mapping,” Magn. Reson. Med., vol. 69, no. 2, pp. 467–476, Feb. 2013, doi: 10.1002/mrm.24272.
[16] M. A. Schofield and Y. Zhu, “Fast phase unwrapping algorithm for interferometric applications,” Opt. Lett., vol. 28, no. 14, pp. 1194–1196, Jul. 2003, doi: 10.1364/OL.28.001194.
[17] S. M. Smith, “Fast robust automated brain extraction,” Hum. Brain Mapp., vol. 17, no. 3, pp. 143–155, Nov. 2002, doi: 10.1002/hbm.10062.
[18] H. Wei, Y. Zhang, E. Gibbs, N. K. Chen, N. Wang, and C. Liu, “Joint 2D and 3D phase processing for quantitative susceptibility mapping: application to 2D echo-planar imaging,” NMR Biomed., vol. 30, no. 4, Apr. 2017, doi: 10.1002/nbm.3501.
[19] C. Milovic, B. Bilgic, B. Zhao, J. Acosta-Cabronero, and C. Tejos, “Fast nonlinear susceptibility inversion with variational regularization,” Magn. Reson. Med., vol. 80, no. 2, pp. 814–821, Aug. 2018, doi: 10.1002/mrm.27073.
[20] M. J. Betts, J. Acosta-Cabronero, A. Cardenas-Blanco, P. J. Nestor, and E. Düzel, “High-resolution characterisation of the aging brain using simultaneous quantitative susceptibility mapping (QSM) and R2* measurements at 7T,” NeuroImage, vol. 138, pp. 43–63, Sep. 2016, doi: 10.1016/j.neuroimage.2016.05.024.
[21] A. Nieto-Castanon and S. Whitfield-Gabrieli, CONN functional connectivity toolbox: RRID SCR_009550, release 22. 2022. doi: 10.56441/hilbertpress.2246.5840.
[22] A. Nieto-Castanon, Handbook of functional connectivity Magnetic Resonance Imaging methods in CONN. 2020. doi: 10.56441/hilbertpress.2207.6598.
[23] C. F. Beckmann and S. M. Smith, “Probabilistic independent component analysis for functional magnetic resonance imaging,” IEEE Trans. Med. Imaging, vol. 23, no. 2, pp. 137–152, Feb. 2004, doi: 10.1109/TMI.2003.822821.
[24] M. D. Greicius, G. Srivastava, A. L. Reiss, and V. Menon, “Default-mode network activity distinguishes Alzheimer’s disease from healthy aging: evidence from functional MRI,” Proc. Natl. Acad. Sci. U. S. A., vol. 101, no. 13, pp. 4637–4642, Mar. 2004, doi: 10.1073/pnas.0308627101.
[25] A. R. Franco, A. Pritchard, V. D. Calhoun, and A. R. Mayer, “Interrater and intermethod reliability of default mode network selection,” Hum. Brain Mapp., vol. 30, no. 7, pp. 2293–2303, Jul. 2009, doi: 10.1002/hbm.20668.
Figures
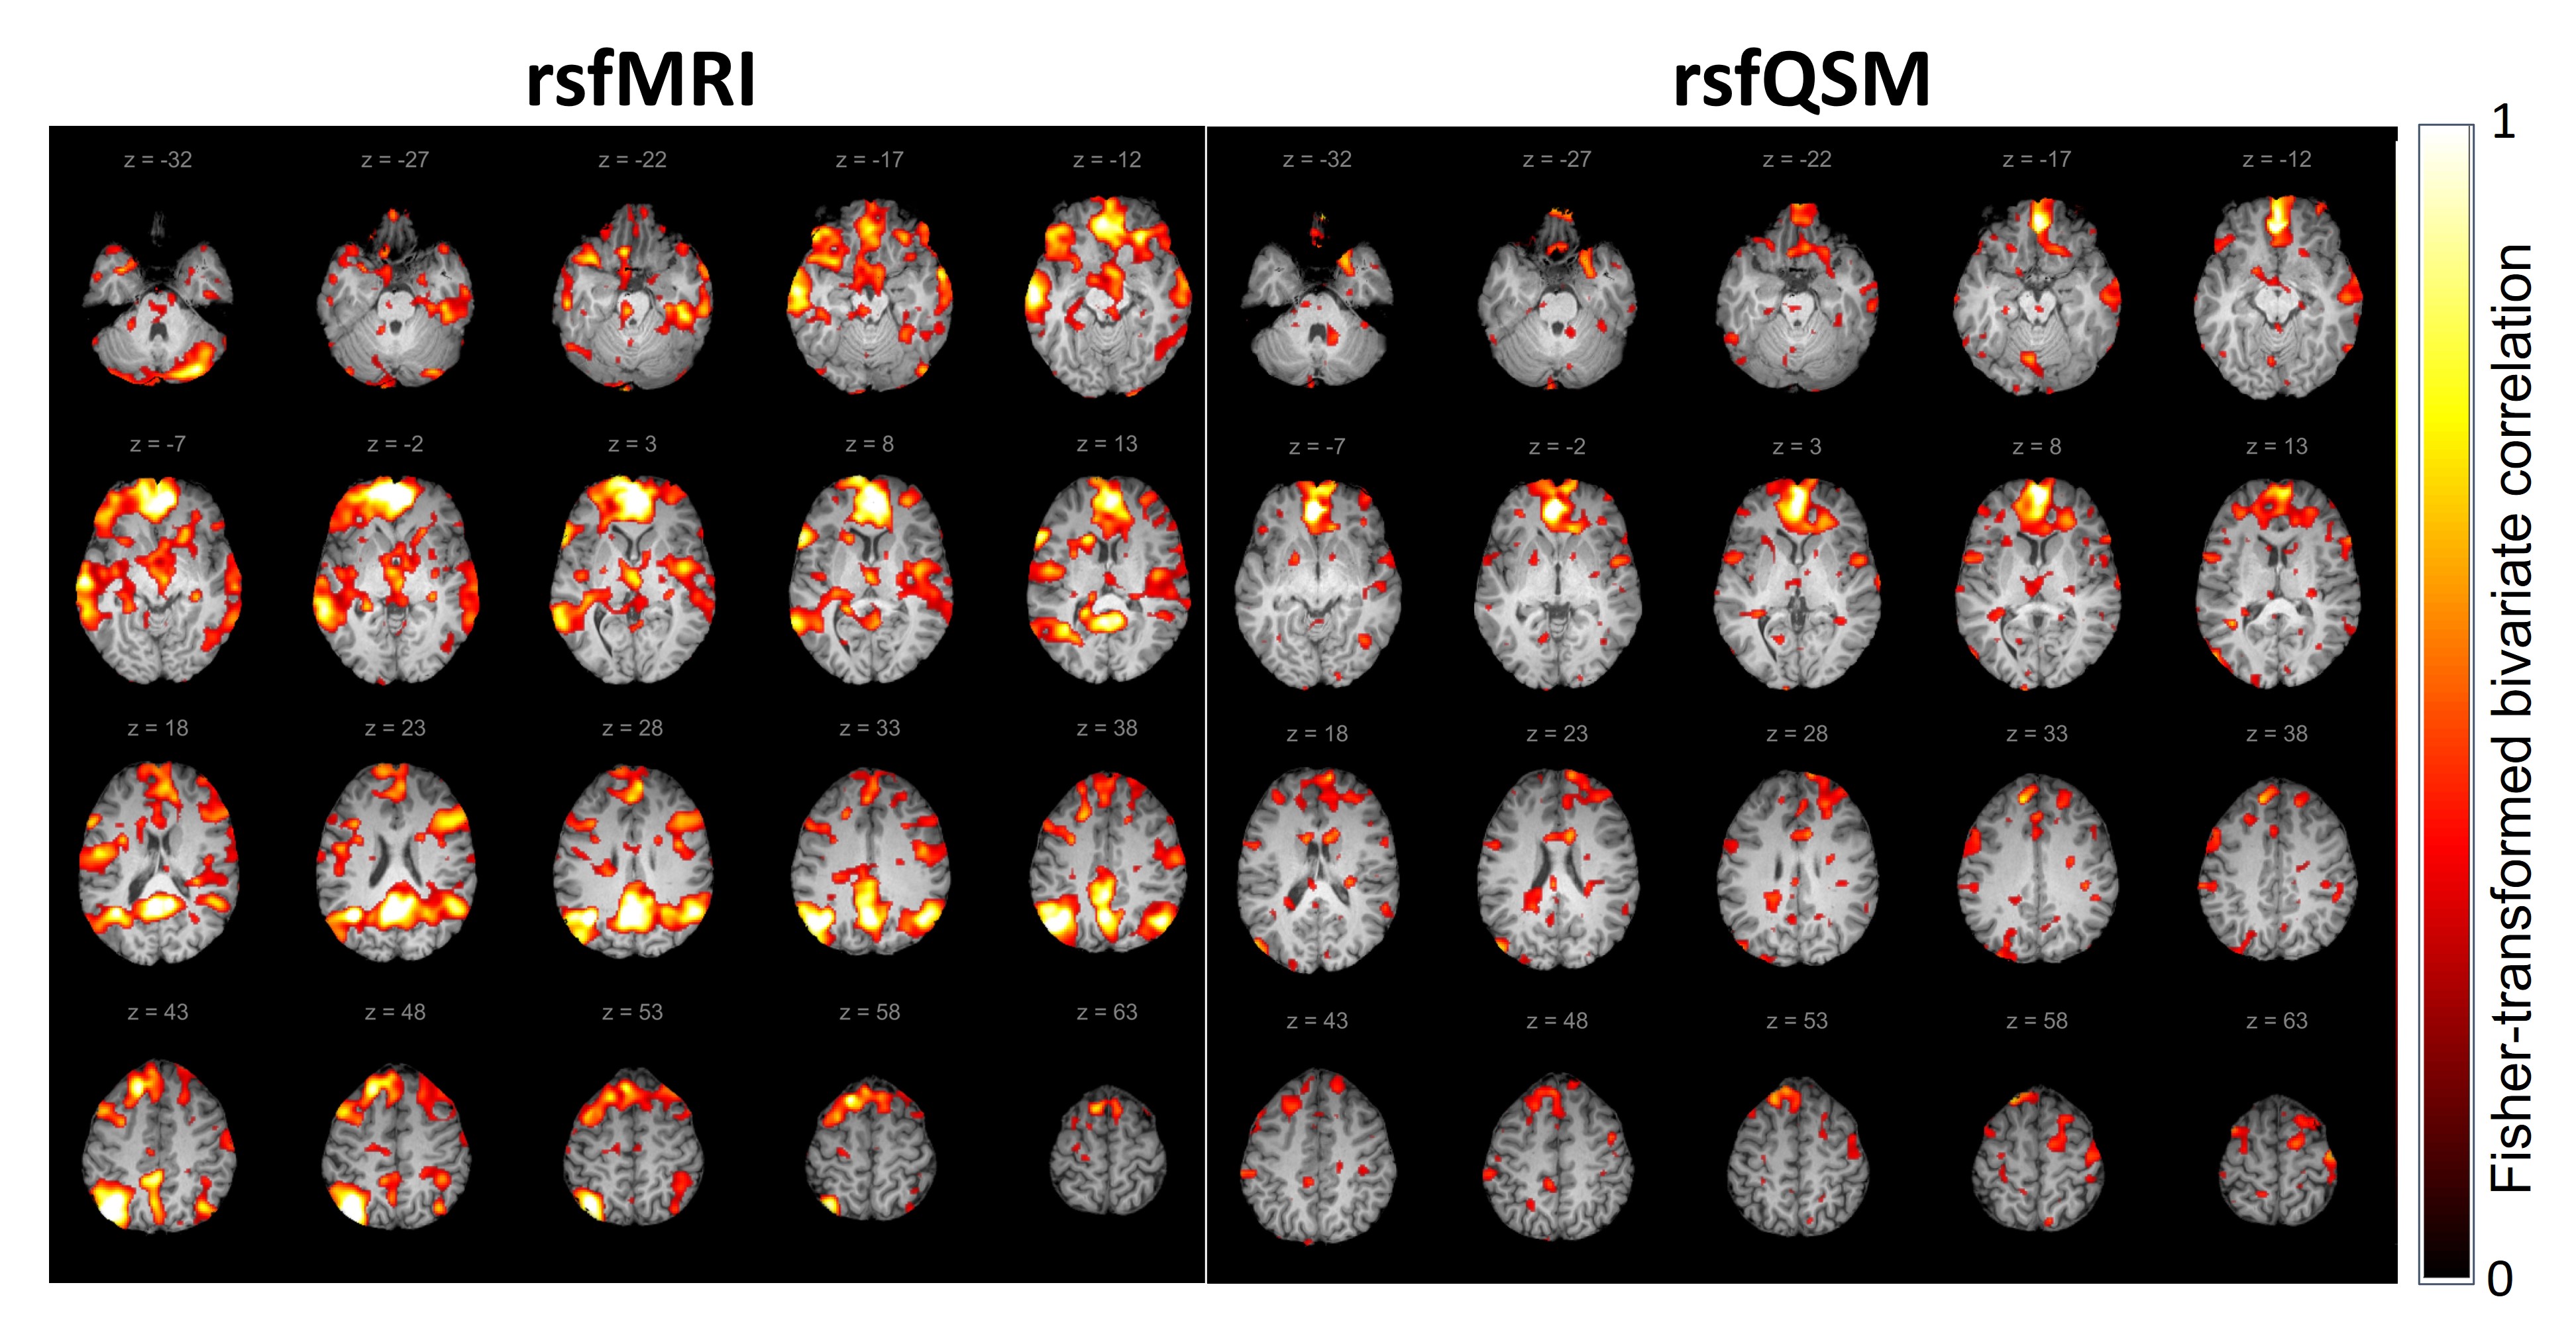
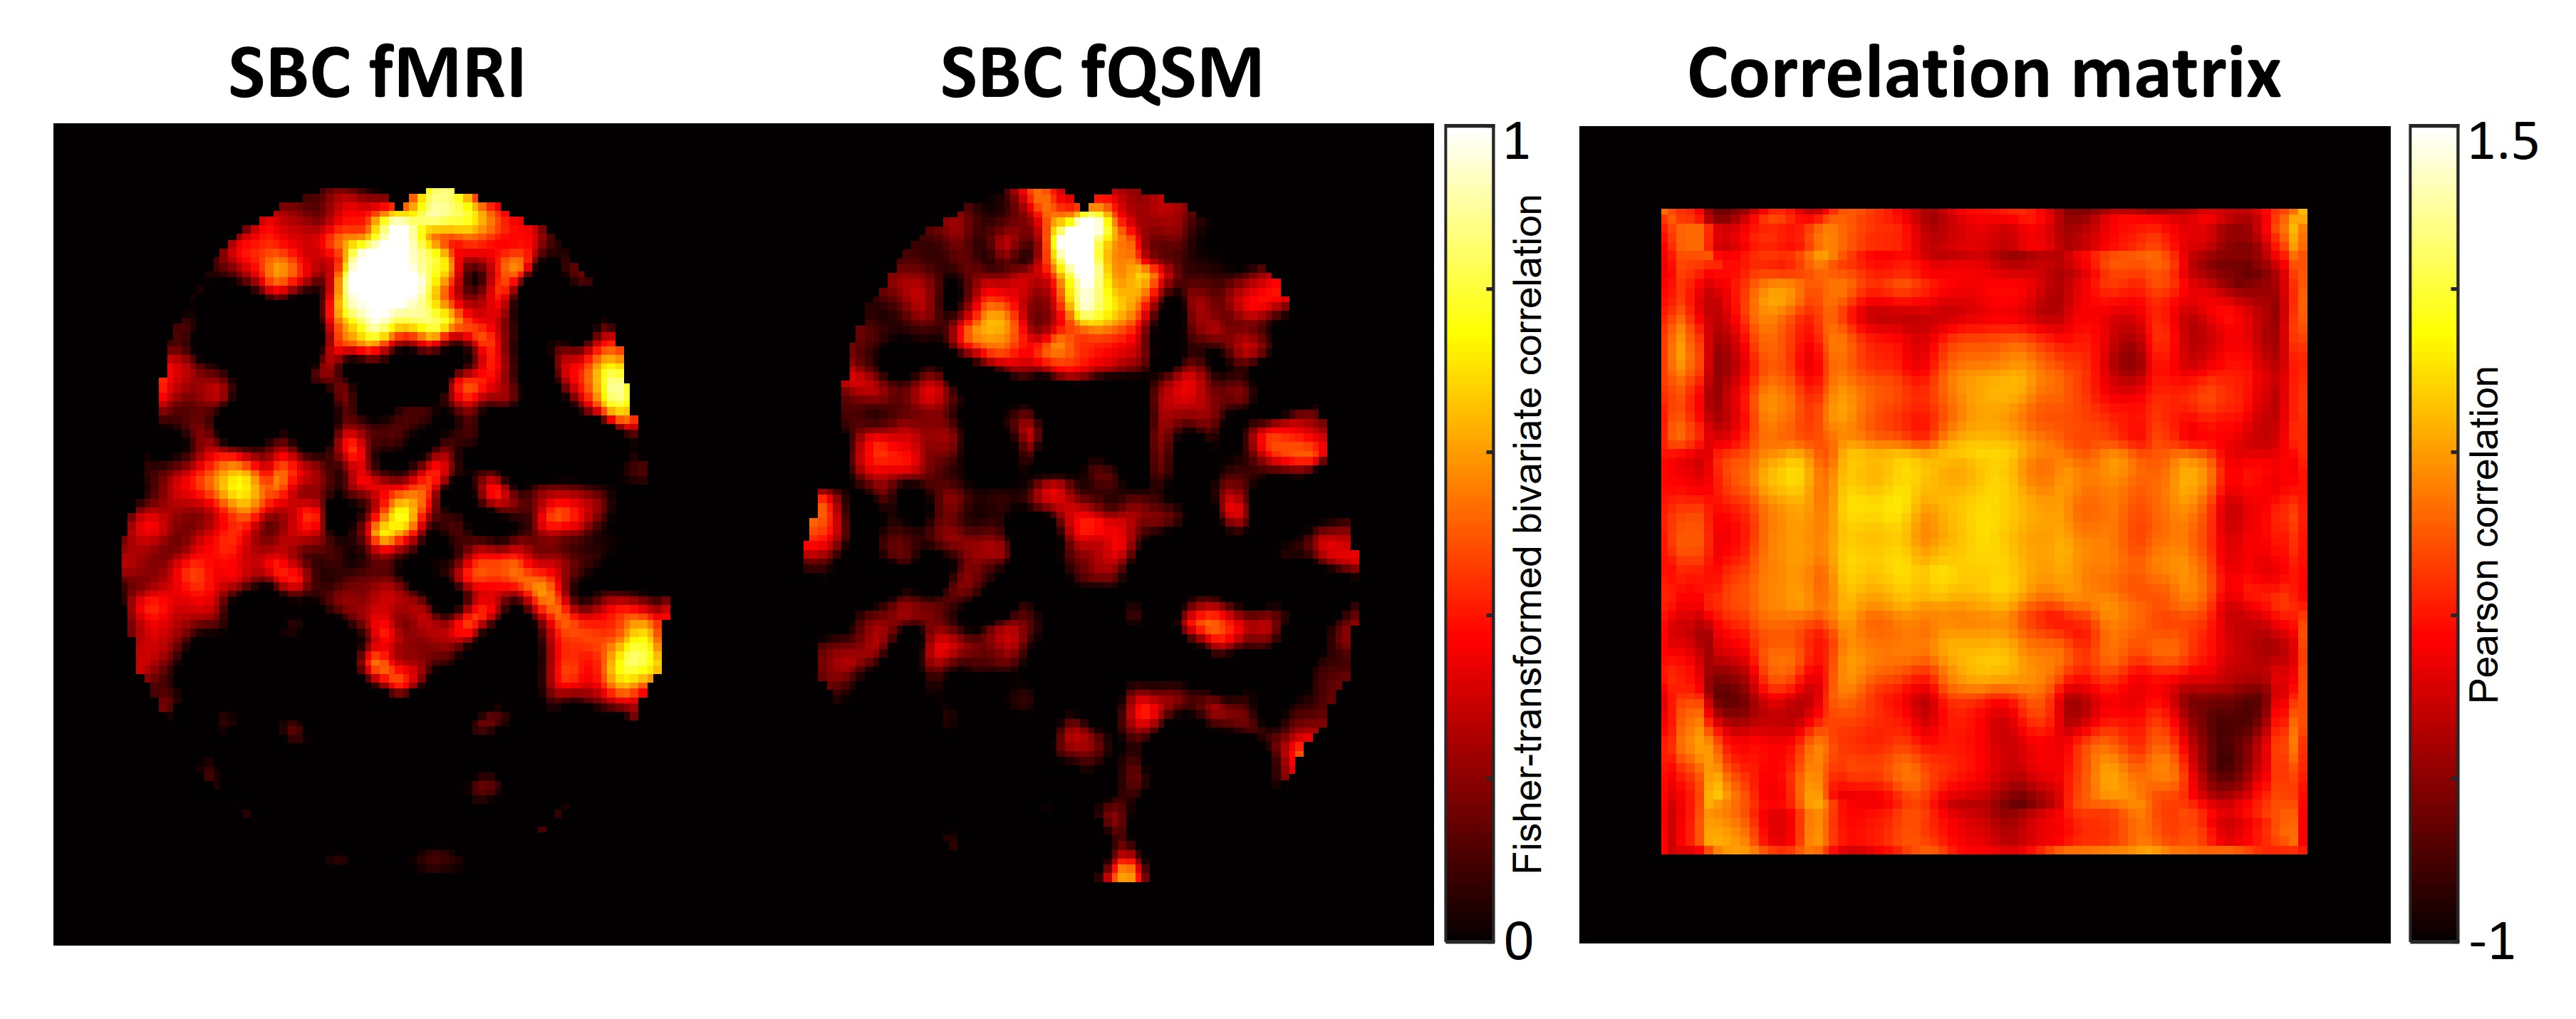
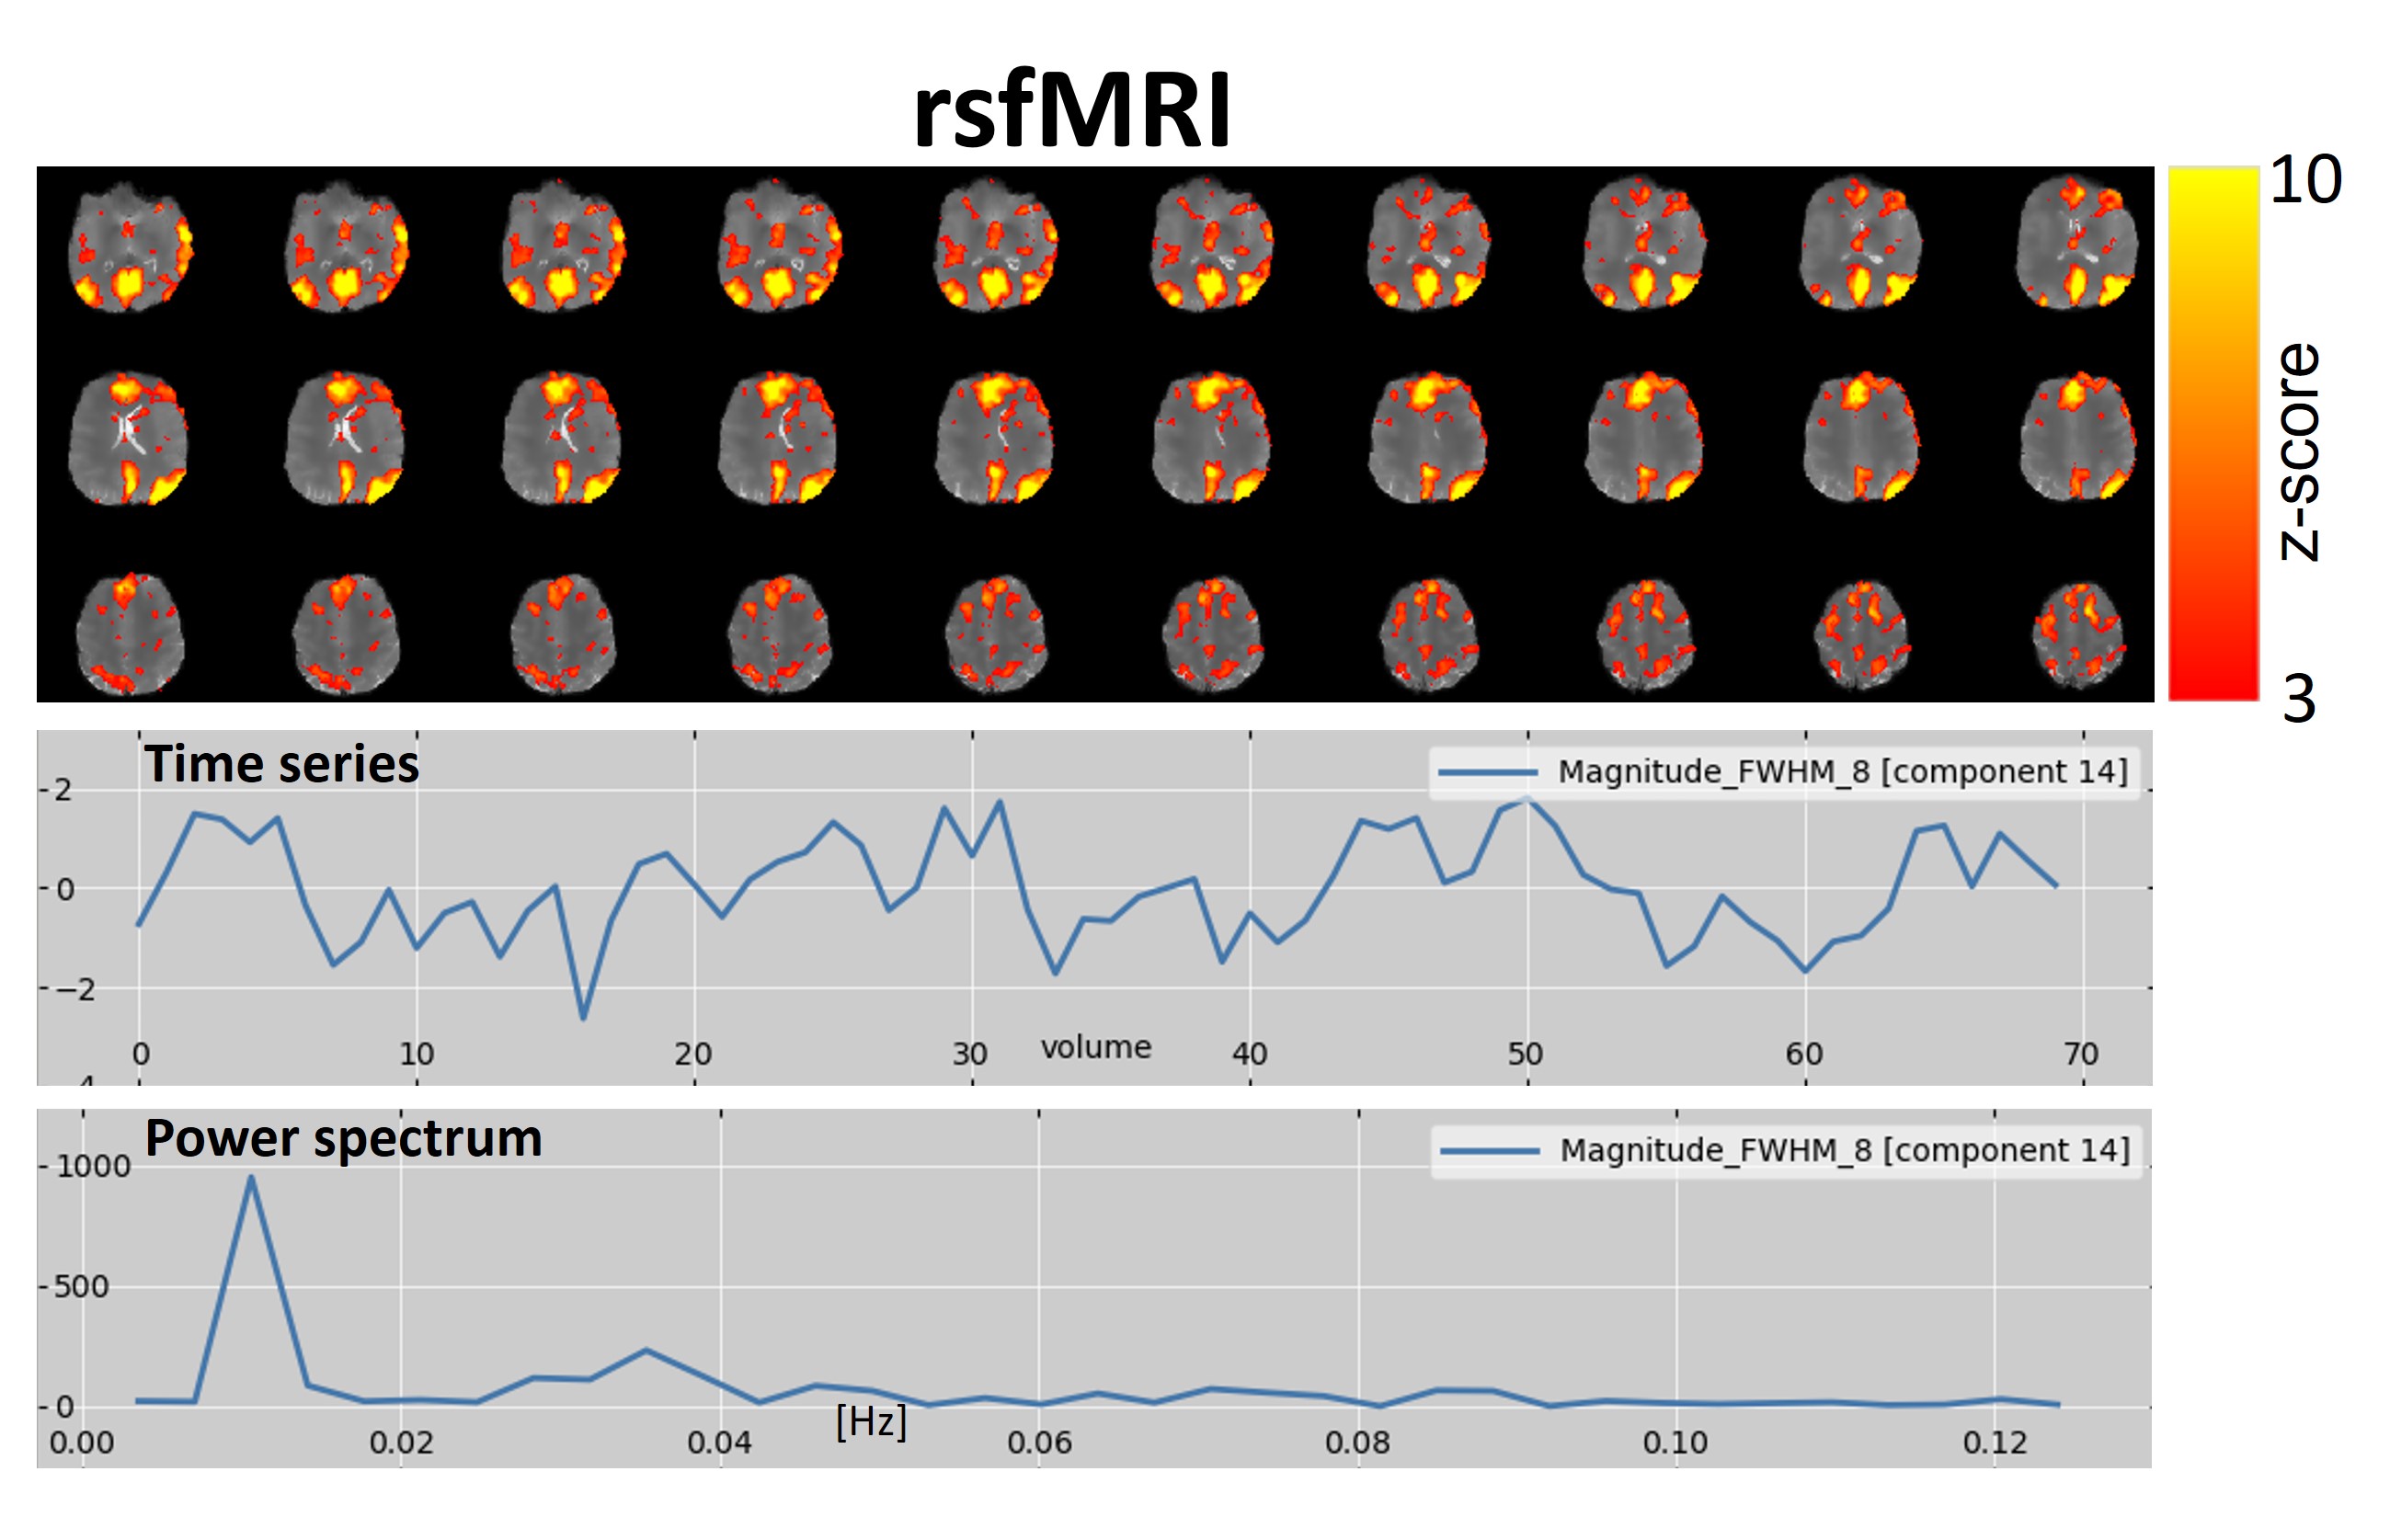
Figure 3: Independent Component maps of the Default Mode Network derived with MELODIC, showing rsfMRI (component #14) results. Z-scores are superimposed on the subject’s T1-weighted structural images in the axial orientation. The time series and the power spectrum of each component are also shown.
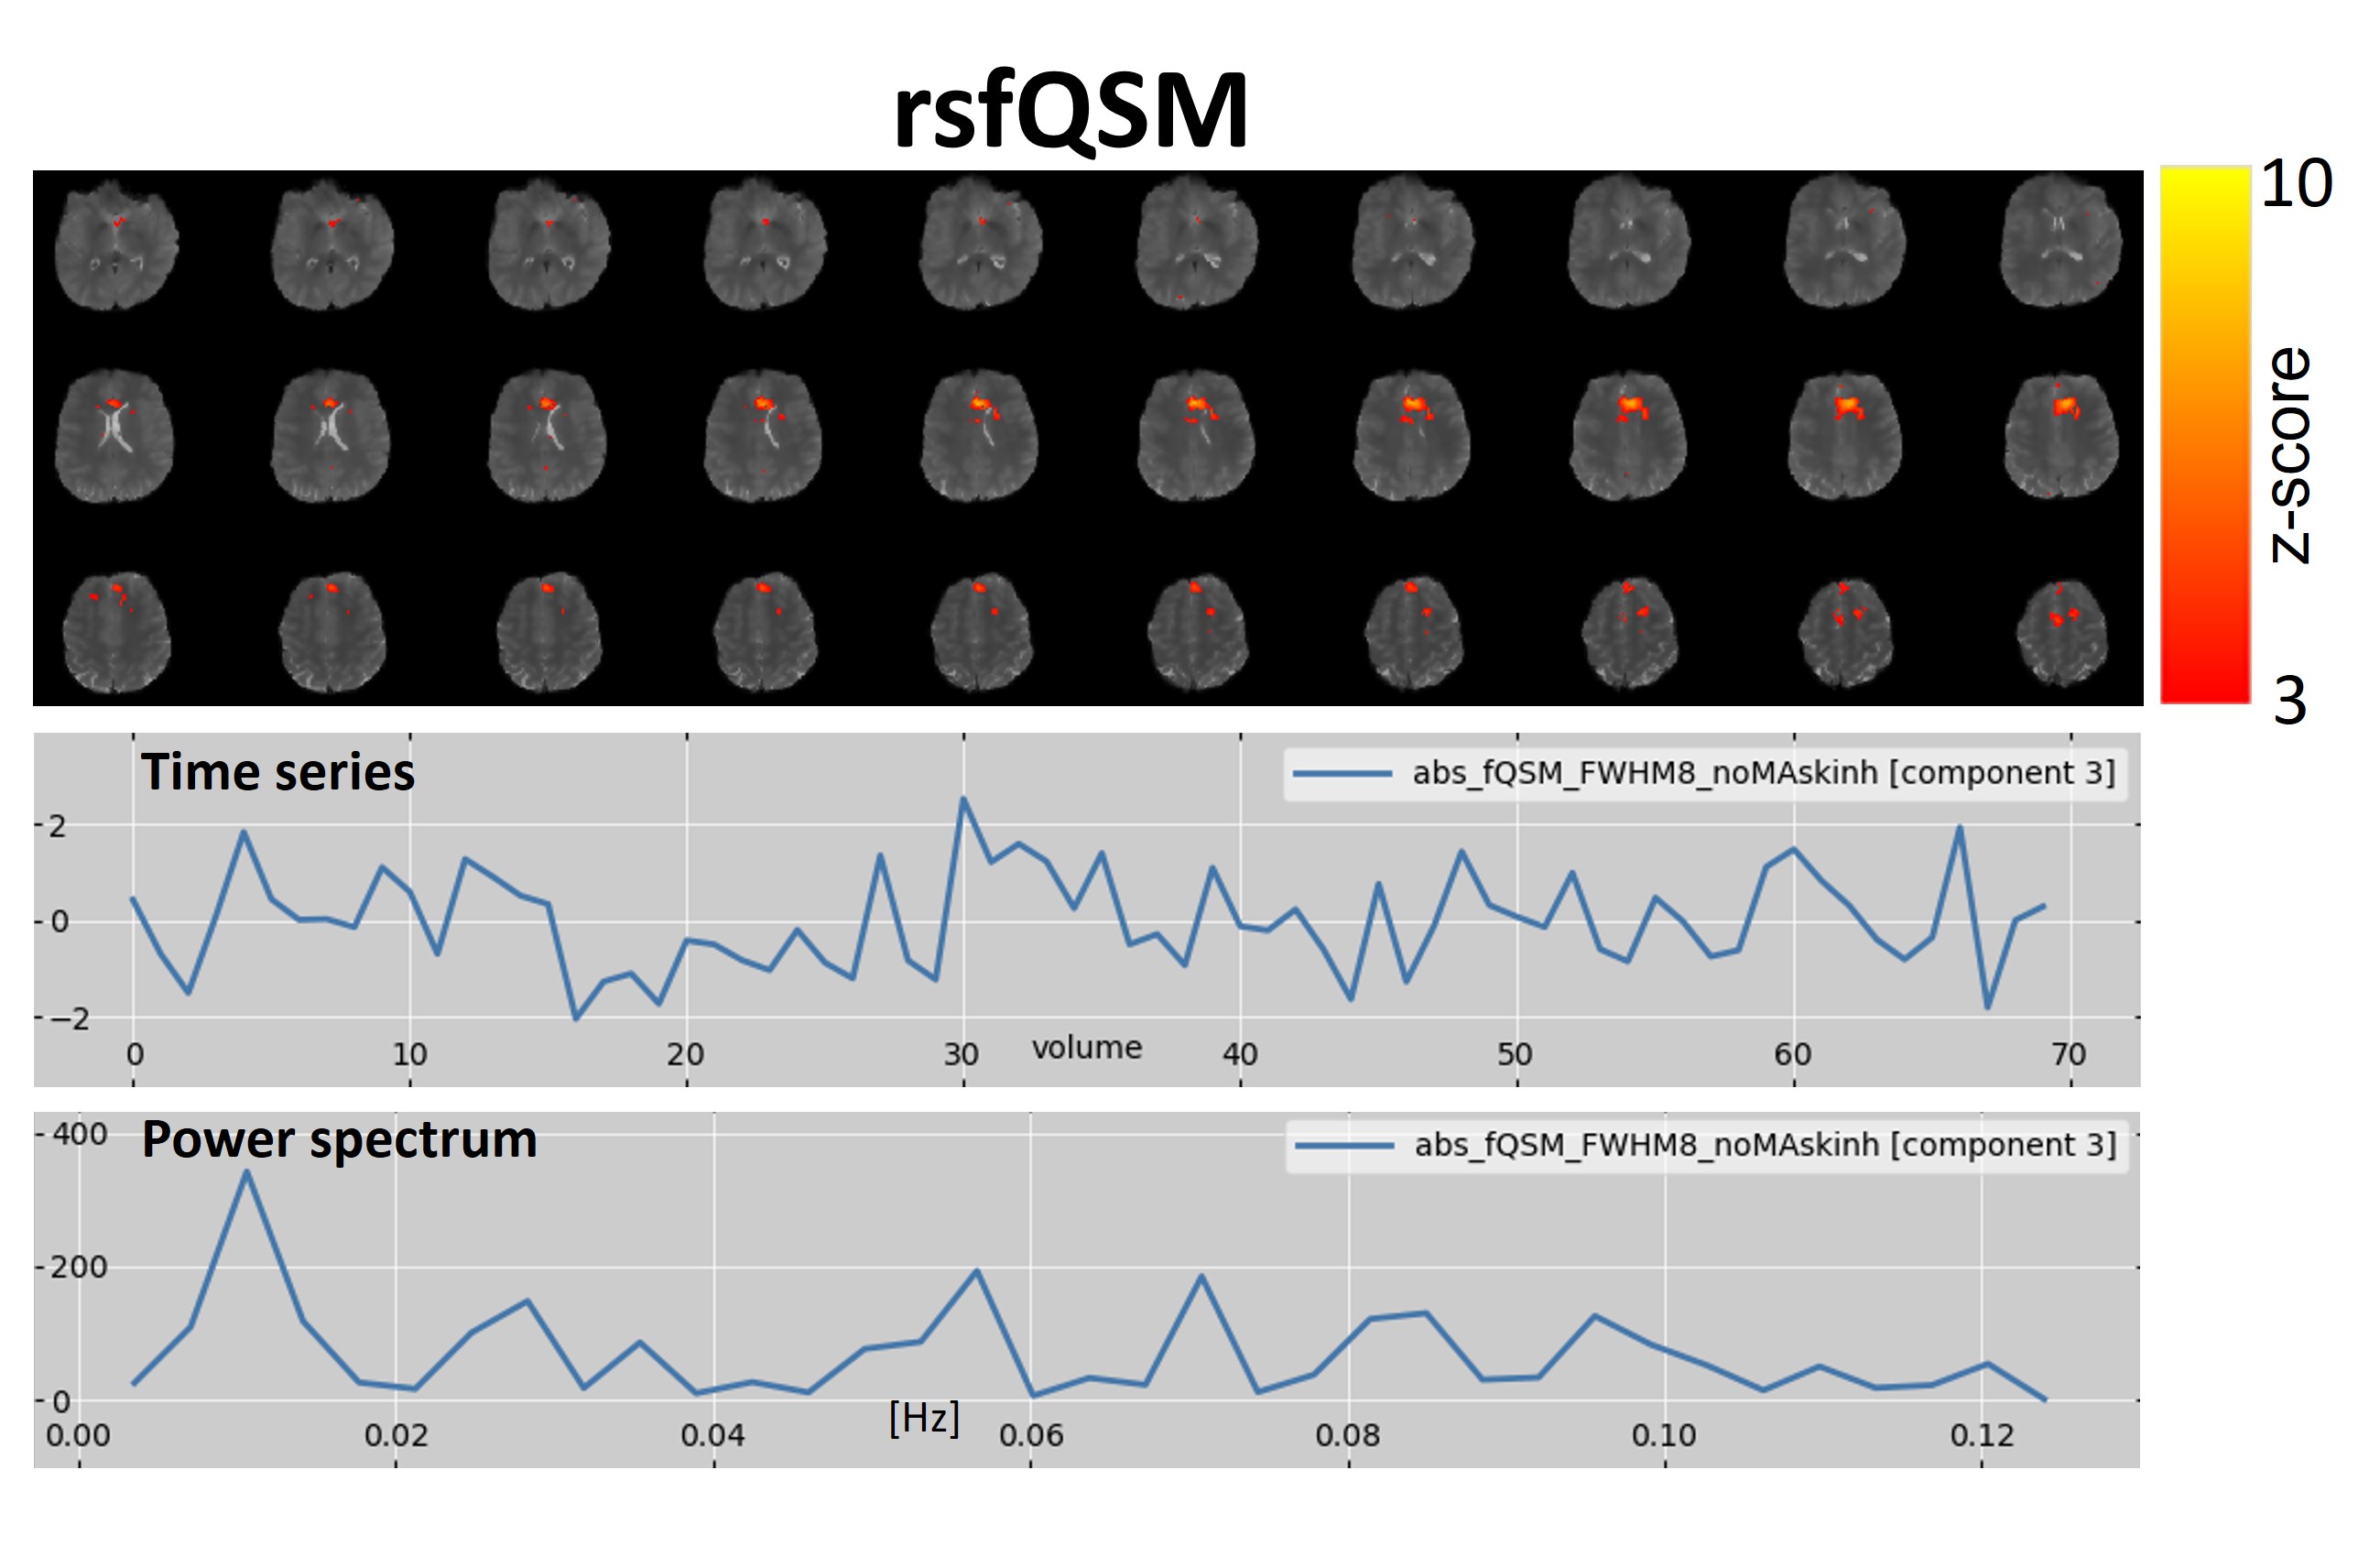
Figure 4: Independent Component maps of the Default Mode Network derived with MELODIC, showing rsfQSM (component #3) results. Z-scores are superimposed on the subject’s T1-weighted structural images in the axial orientation. The time series and the power spectrum of each component are also shown.
