1290
Chemical Exchange Saturation Transfer-Based Functional Magnetic Resonance Imaging (CEST-fMRI) in the Human Brain at 3T1Key Laboratory for Biomedical Engineering of Ministry of Education, Department of Biomedical Engineering, College of Biomedical Engineering & Instrument Science, Zhejiang University, HangZhou, China
Synopsis
Keywords: fMRI Acquisition, CEST & MT, CEST-fMRI
Motivation: Conventional fMRI techniques indirectly map neural activity through the BOLD effect, but there is a need for a methodology to directly detect dynamic changes in neurotransmitter levels.
Goal(s): Our goal was to detect the increase in glutamate concentration in the human brain during a visual task based on CEST.
Approach: We performed two tailored experiments on a 3T scanner and used a 4-regressor general linear model (GLM) analysis to extract the metabolite effects from CEST-fMRI signals.
Results: A ~0.12% metabolite effect was detected at glutamate-proximal frequency offsets, consistent with our simulation under a 3% increase in glutamate concentrations during brain activity.
Impact: Our study successfully revealed the mechanism behind CEST-fMRI and demonstrated its ability to detect dynamic changes in glutamate concentrations during visual stimulation. The CEST-fMRI methodology enables the investigation of neurotransmitter changes, potentially becoming an imaging modality that guides neuroscience research.
Introduction
The conventional fMRI technique maps neural activity indirectly through the blood oxygenation level-dependent (BOLD) effect(1). A ~3% glutamate concentration increase has been reported by functional MRS (fMRS) under the block-design visual stimulation(2). Chemical exchange saturation transfer (CEST) has shown the capability to detect glutamate in the human brain(3). Here, we propose and validate a CEST-based fMRI (CEST-fMRI) methodology in human brains at 3T, aiming to detect glutamate-associated signal changes. The mechanism underlying coupled CEST and BOLD effects was investigated by simulations and experimental results, demonstrating the potential of CEST-fMRI to detect dynamic glutamate-related changes during visual tasks.Methods
Experimental design: A 5-cycle block-design paradigm was used with alternating resting and stimulation blocks of equal duration. A radial checkerboard flickered at 8Hz during stimulation. In Experiment 1 (n=10), each block lasted 45s with three positive frequency offsets acquired, and five sets of CEST frequencies were obtained (Table 1). In Experiment 2 (n=13), each block lasted 30s with two positive and negative frequency offsets acquired, and seven sets of CEST frequencies were obtained (Table 1).Data acquisition: The EPI sequence was used for whole-brain BOLD-fMRI. A single-slice frequency-stabilized TSE-CEST(4) sequence was used for CEST acquisition through the cross-section with the largest BOLD-activated region. Detailed sequence parameters are listed in Table
Data analysis: As for the unsaturated M0 images, no CEST effect was considered, and thus a 2-regressor GLM was used to generate the t-map. The design matrix included a canonical BOLD vector derived from a stimulation boxcar function convolved with the hemodynamic response function and a constant vector (Fig.1A). The region of interest (ROI) was extracted according to the FWE-corrected p-value<0.01 of the M0 t-map.
As for the saturated CEST images in Experiment 1, since only positive frequency offsets were acquired, the time-domain signal was sorted into 3 groups according to acquisition timing, and the canonical BOLD vector was split into 3 sub-vectors for GLM analysis (Figs. 1B-C). The CEST-fMRI signal amplitude was estimated in GLM analysis (ꞵ1) and compared with the temporal mean and Z-spectrum (Fig. 2).
As for Experiment 2, the CEST effect was considered during GLM analysis. Since alternated positive and negative frequency offsets were acquired, a four-regressor GLM was used(6). Specifically, the asymmetric compensation regressor corrected for the timing difference between positive and negative frequency, and the metabolite effect regressor extracted the CEST effect (Fig. 3).
Data simulation: CEST-fMRI temporal signals were simulated based on the 7-pool Bloch-McConnell simulation(7). Both BOLD and CEST effects were considered in simulations. Furthermore, the effect of a 3% increase in the glutamate concentration was compared to that with a constant glutamate concentration during visual stimulation.
Results
Fig. 2 compares the Z-spectrum, temporal mean, and GLM-estimated amplitude across different frequency offsets. Fig. 2A shows the raw temporal mean of CEST-fMRI data is almost identical to the resting z-spectrum, while the estimated CEST-fMRI amplitude from GLM analysis exhibits extra elevation (Fig. 2B). A similar trend was reproduced by the Bloch-McConnell simulations (Figs. 2C-D). Fig. 4 reveals a significant difference in metabolite effects (~0.12% vs. ~0.02%) between the four glutamate-proximal and the three glutamate-distant frequency offsets. Moreover, the experimental results agreed well with the simulated results under a 3% increase in the glutamate concentration.Discussion and Conclusion
We proposed a CEST-fMRI methodology in human brains at 3T for the first time. In Experiment 1, the GLM-estimated CEST-fMRI amplitude exhibited different trends from the Z-spectrum and temporal mean of CEST-fMRI signals. This reveals that the CEST-fMRI effect does not simply scale with the underlying mean signal at different frequency offsets. Notably, the CEST-fMRI response comprises contributions from blood and brain tissues(8). Since blood experiences less signal attenuation under saturation pulses(9), the in-flow blood with relatively higher signal intensity results in elevated GLM-estimated amplitudes during visual stimulation. In Experiment 2, the glutamate concentration increased only during visual stimulation, leading to a greater CEST saturation at +3ppm, whereas the signal at -3ppm remained relatively stable. The signal difference between -3ppm and +3ppm is likely attributed to the glutamate change, which is extracted via the metabolite effect regressor in GLM analysis. More substantial metabolite effects were found near 3ppm than those at distant offsets, and the simulation results confirmed the effectiveness of this metric in detecting changes in glutamate concentration. In conclusion, the proposed CEST-fMRI methodology can potentially enable studying neurotransmitter-related brain functions noninvasively and may become a useful imaging modality for neuroscience research.Acknowledgements
National Natural Science Foundation of China: 81971605. Key R&D Program of Zhejiang Province: 2022C04031. Leading Innovation and Entrepreneurship Team of Zhejiang Province: 2020R01003. This work was supported by the MOE Frontier Science Center for Brain Science & Brain-Machine Integration, Zhejiang University.References
1. van Zijl PCM, Eleff SM, Ulatowski JA, Oja JME, Ulug AM, Traystman RJ, Kauppinen RA. Quantitative assessment of blood flow, blood volume and blood oxygenation effects in functional magnetic resonance imaging. Nat Med 1998;4(2):159-167.
2. Mangia S, Tkac I, Gruetter R, Van de Moortele PF, Maraviglia B, Ugurbil K. Sustained neuronal activation raises oxidative metabolism to a new steady-state level: evidence from 1H NMR spectroscopy in the human visual cortex. J Cereb Blood Flow Metab 2007;27(5):1055-1063.
3. Cai K, Haris M, Singh A, Kogan F, Greenberg JH, Hariharan H, Detre JA, Reddy R. Magnetic resonance imaging of glutamate. Nat Med 2012;18(2):302-306.
4. Liu R, Zhang H, Niu W, Lai C, Ding Q, Chen W, Liang S, Zhou J, Wu D, Zhang Y. Improved chemical exchange saturation transfer imaging with real-time frequency drift correction. Magnetic resonance in medicine 2019;81(5):2915-2923.
5. van Zijl PCM, Yadav NN. Chemical exchange saturation transfer (CEST): What is in a name and what isn't? Magnetic Resonance in Medicine 2011;65(4):927-948.
6. Khlebnikov V, Siero JCW, Bhogal AA, Luijten PR, Klomp DWJ, Hoogduin H. Establishing upper limits on neuronal activity-evoked pH changes with APT-CEST MRI at 7 T. Magnetic Resonance in Medicine 2018;80(1):126-136.
7. Wang K, Wen Q, Wu D, Hsu Y-C, Heo H-Y, Wang W, Sun Y, Ma Y, Wu D, Zhang Y. Lateralization of temporal lobe epileptic foci with automated chemical exchange saturation transfer measurements at 3 Tesla. eBioMedicine 2023;89.
8. Kim S-G, Ogawa S. Biophysical and Physiological Origins of Blood Oxygenation Level-Dependent fMRI Signals. Journal of Cerebral Blood Flow & Metabolism 2012;32(7):1188-1206.
9. Kim T, Hendrich K, Kim S-G. Functional MRI with magnetization transfer effects: Determination of BOLD and arterial blood volume changes. Magnetic Resonance in Medicine 2008;60(6):1518-1523.
Figures
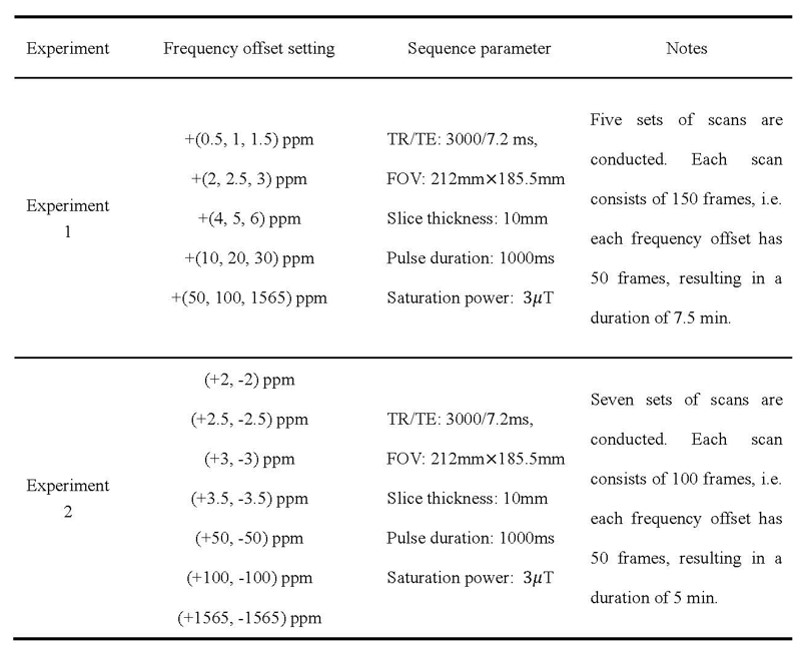
Table 1. Frequency offset settings and sequence parameters used in Experiment 1 and Experiment 2.
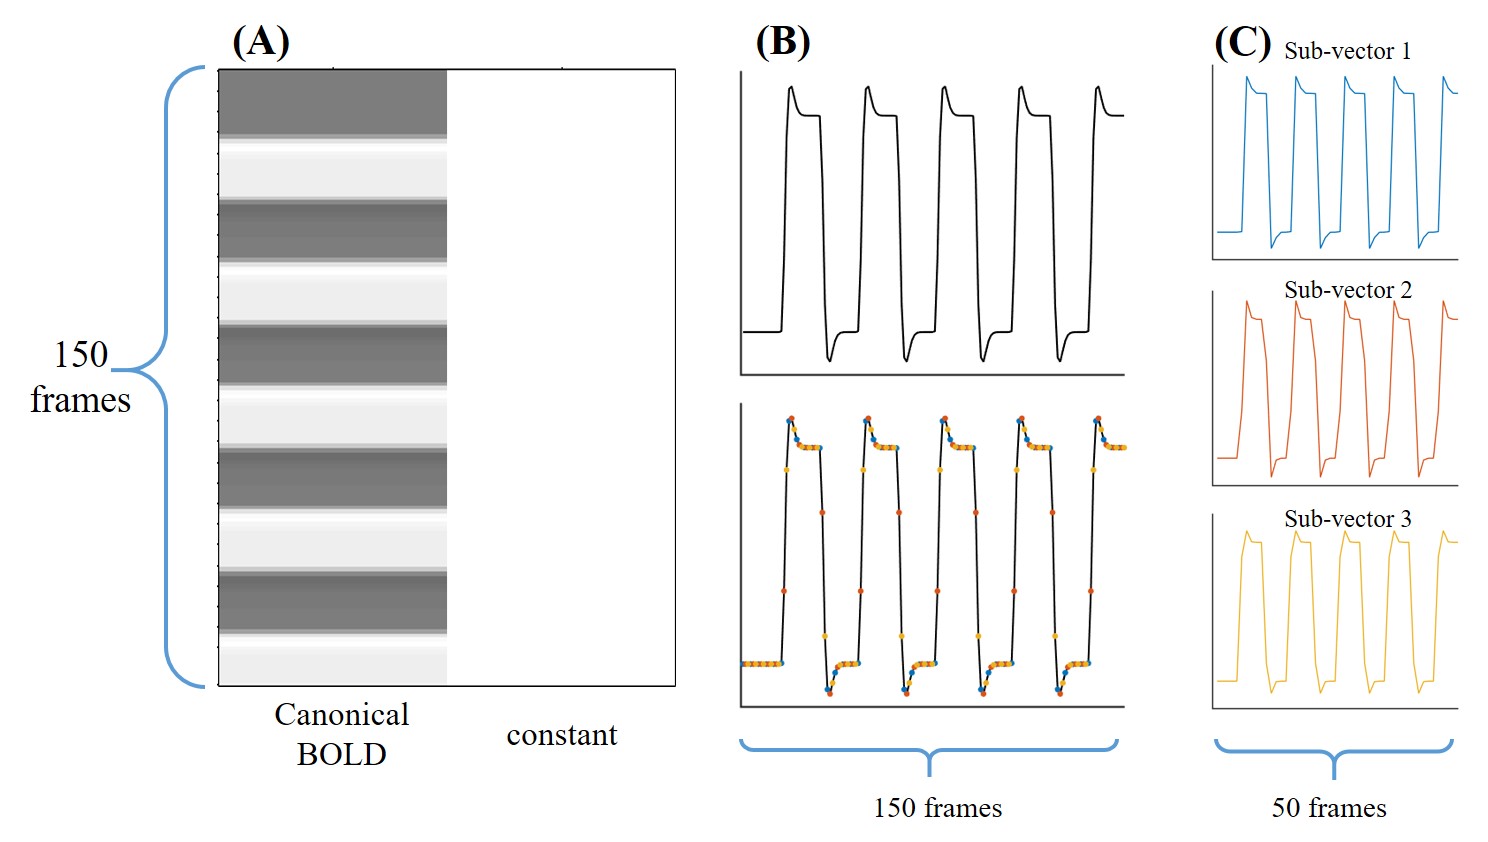
Figure 1. (A) The design matrix of the 2-regressor GLM, consisting of a canonical BOLD regressor derived from a stimulation boxcar function convolved with the hemodynamic response function and a constant vector. (B) The canonical BOLD regressor (top) and the dots of different colors (bottom) represent the different acquisition timing in Experiment 1. (C) The 3 sub-vectors extracted from the canonical BOLD vector.
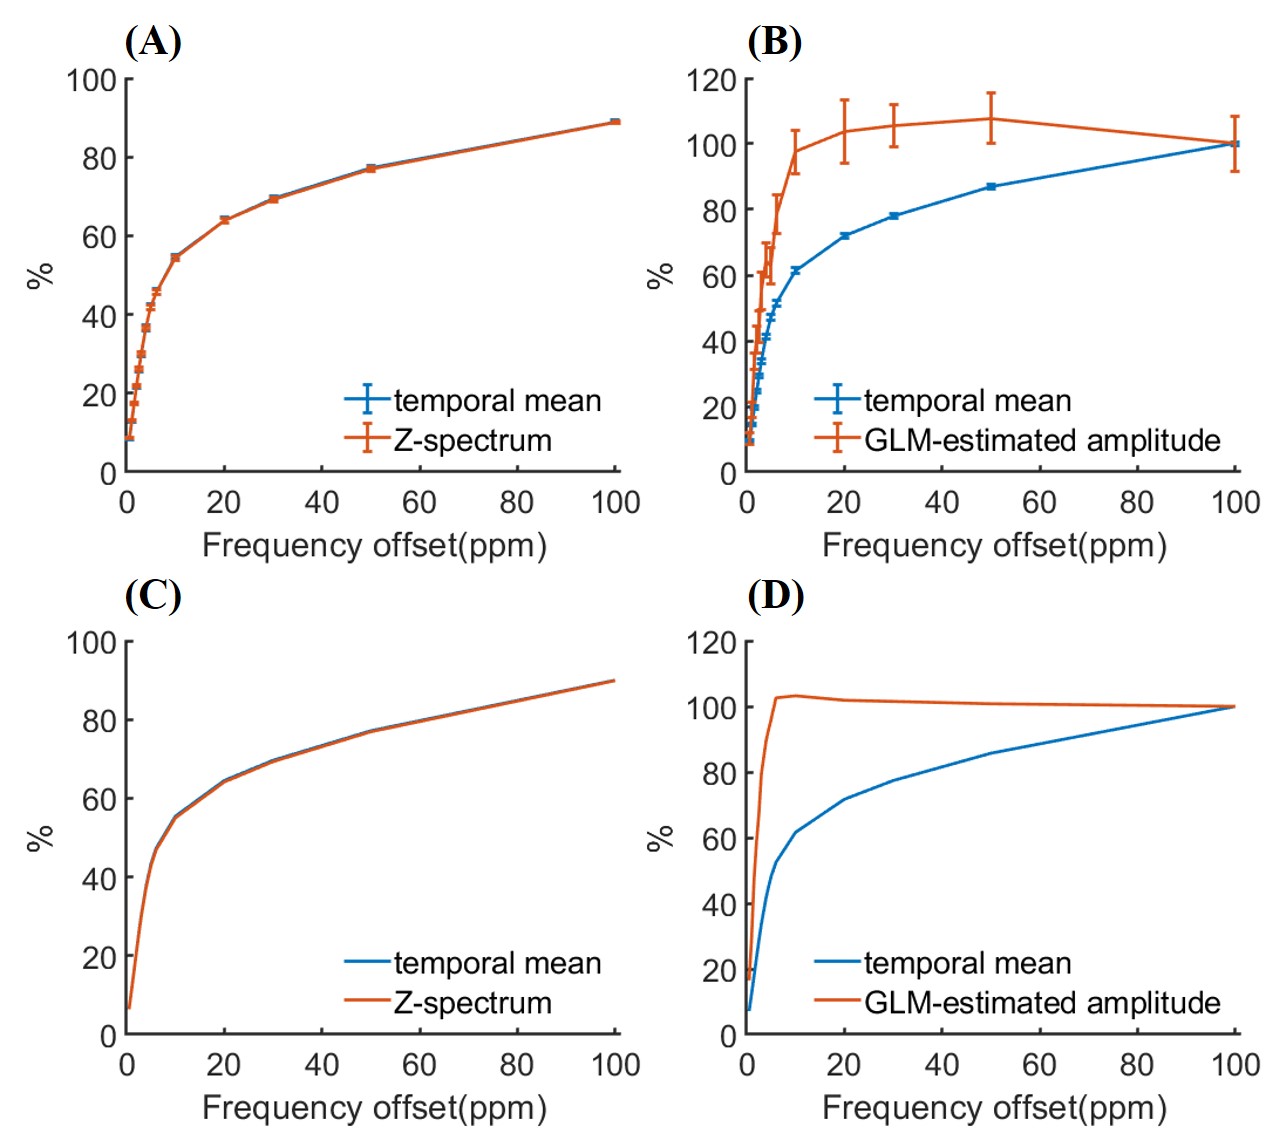
Figure 2. (A) Raw temporal mean of CEST-fMRI data under visual stimulation and Z-spectrum during resting in Experiment 1, indicating little influence of the visual stimulation on the temporal mean. (B) Raw temporal mean of CEST-fMRI signal and estimated CEST-fMRI amplitude from GLM analysis (ꞵ1), revealing a CEST effect. (C) Simulated temporal mean of CEST-fMRI data under visual stimulation and Z-spectrum, agreeing with experimental data in part (A). (D) Simulated temporal mean of CEST-fMRI signal and amplitude from GLM analysis, agreeing with experimental data in part (B).
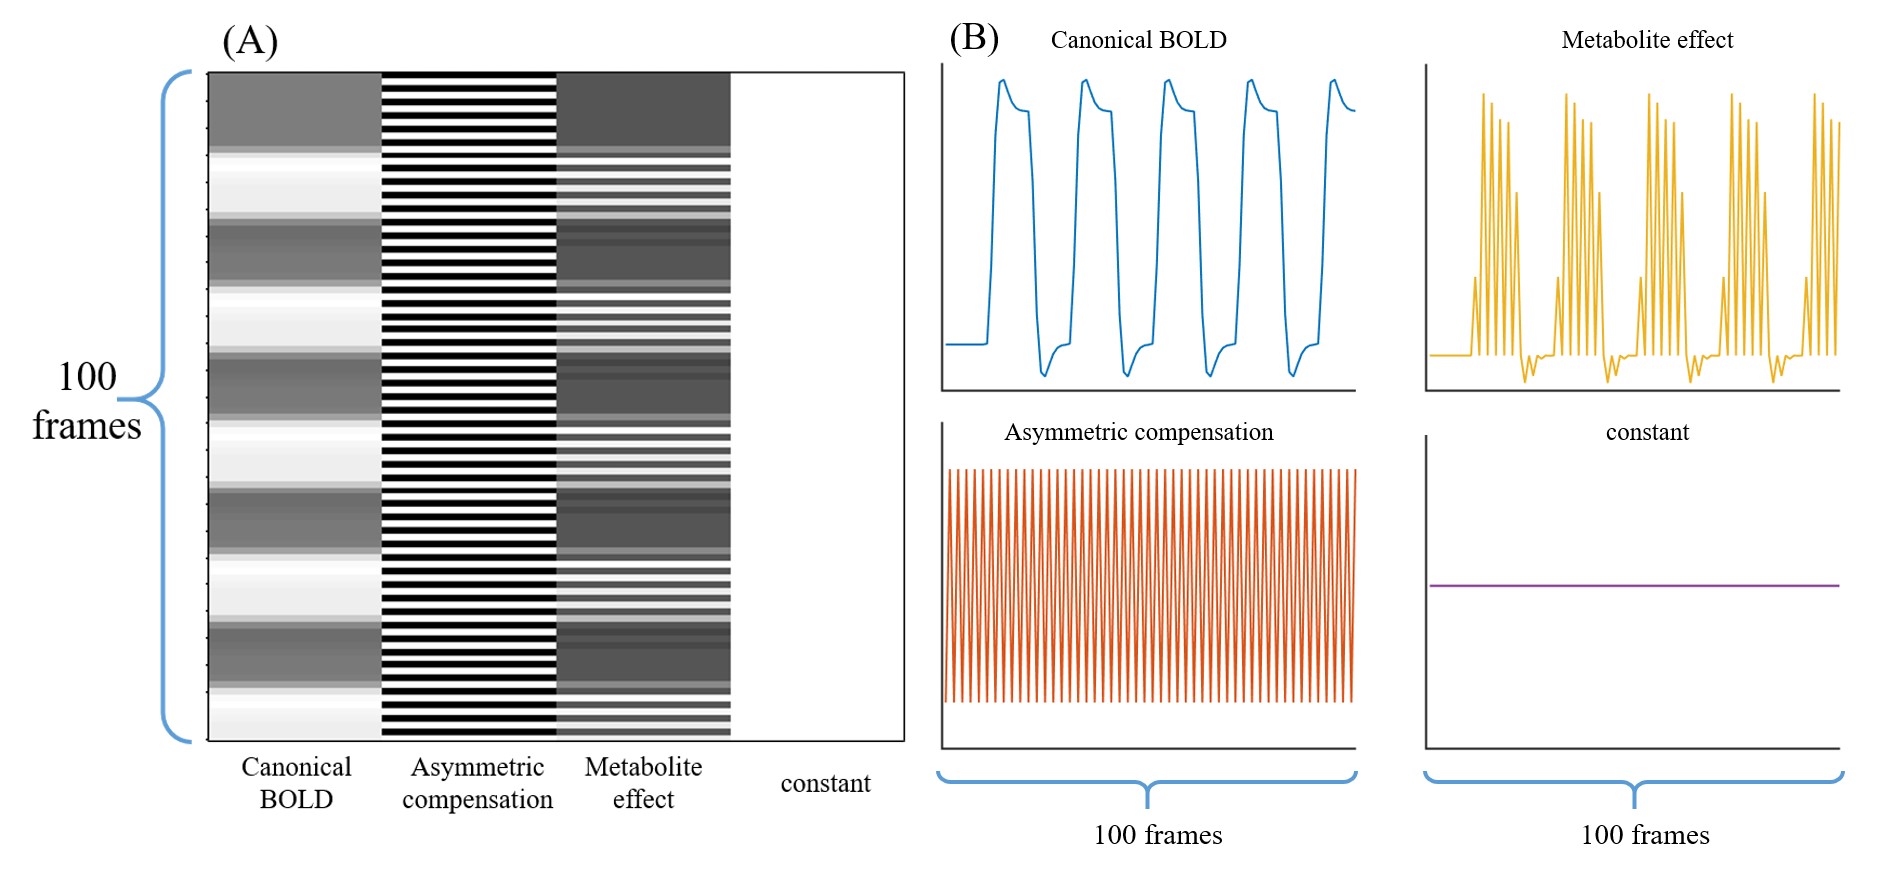
Figure 3. (A) The design matrix of the 4-regressor GLM, consisting of a canonical BOLD vector, an asymmetric compensation vector alternating between 0 and 1, a metabolite effect vector, and a constant vector. (B) Plots of the four vectors used in GLM analysis.
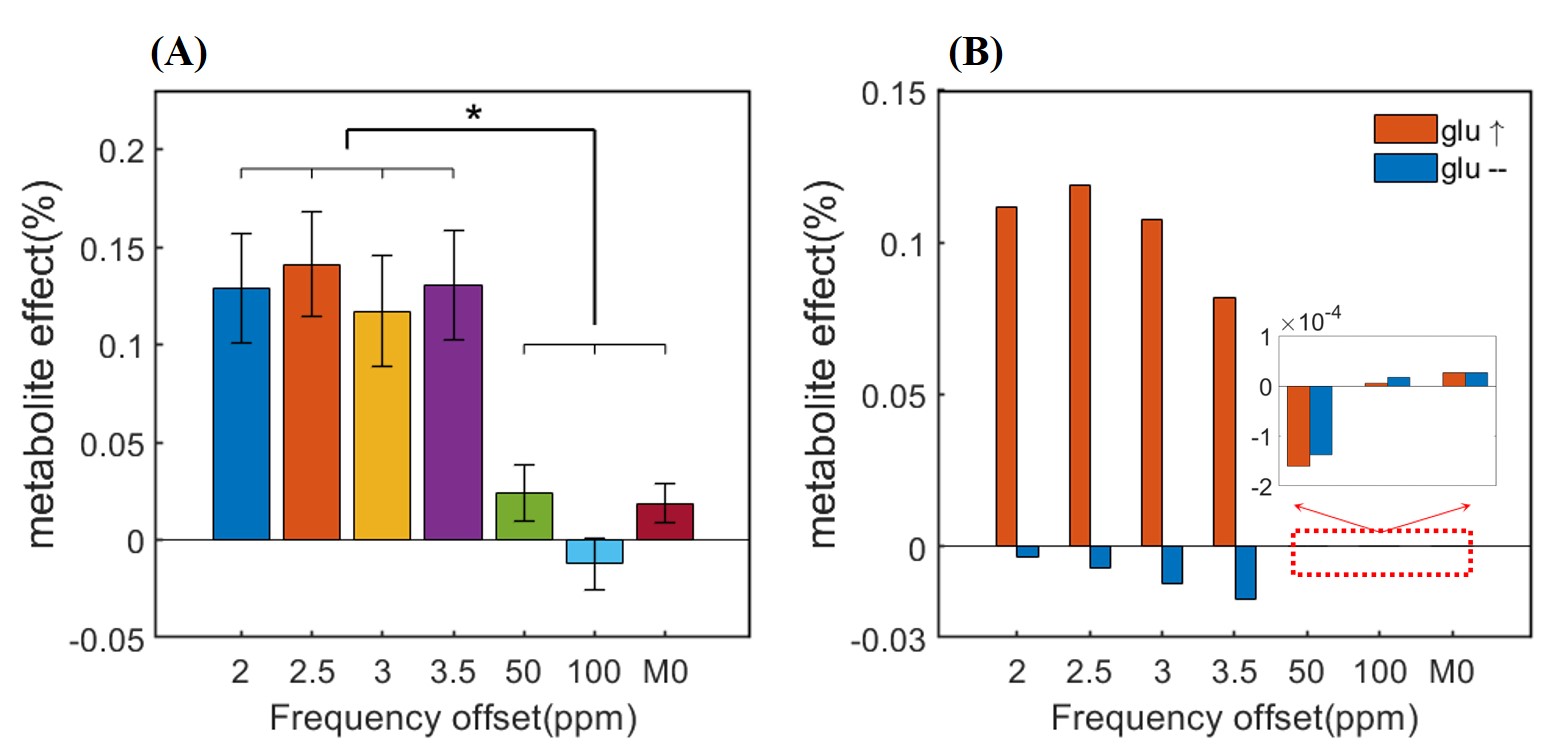
Figure 4. (A) The metabolite effects (ꞵ3) estimated from alternating positive and negative frequency offsets in Experiment 2. There is a significant difference between metabolite effects at the four glutamate-proximal (±2, ±2.5, ±3, and ±3.5ppm) and the three glutamate-distant (±50, ±100ppm and ±M0 ) frequency offsets. (P<0.05, one-way ANOVA with Tukey’s HSD post-hoc correction). (B) The simulated metabolite effects at the aforementioned frequency offsets with and without a 3% increase in glutamate concentration during visual stimulus.