1288
DiSpect Consistently and Repeatably Reveals Modulation and Redistribution of Venous Blood Flow Caused by Functional Brain Activation1Department of Electrical Engineering and Computer Science, University of California, Berkeley, Berkeley, CA, United States, 2Helen Wills Neuroscience Institute, Berkeley, CA, United States
Synopsis
Keywords: fMRI Acquisition, fMRI
Motivation: DiSpect can trace blood draining from the capillary bed through the cerebral venous system and map venous territories.
Goal(s): Determine whether DiSpect can detect blood flow changes in the veins during neural activation.
Approach: DiSpect was performed during a motor cortex task and at baseline for two subjects, each with two repeats to ensure consistency and repeatability.
Results: Modulation and redistribution of flow were observed during the task, specifically in veins near the BOLD fMRI activated regions. The measurements showed good repeatability for both subjects.
Impact: BOLD contrast is affected by a complex interplay of several physiological processes. DiSpect measures changes in venous blood flow dynamics during neural activation and can potentially help to better understand the venous sources of the BOLD signal.
Introduction
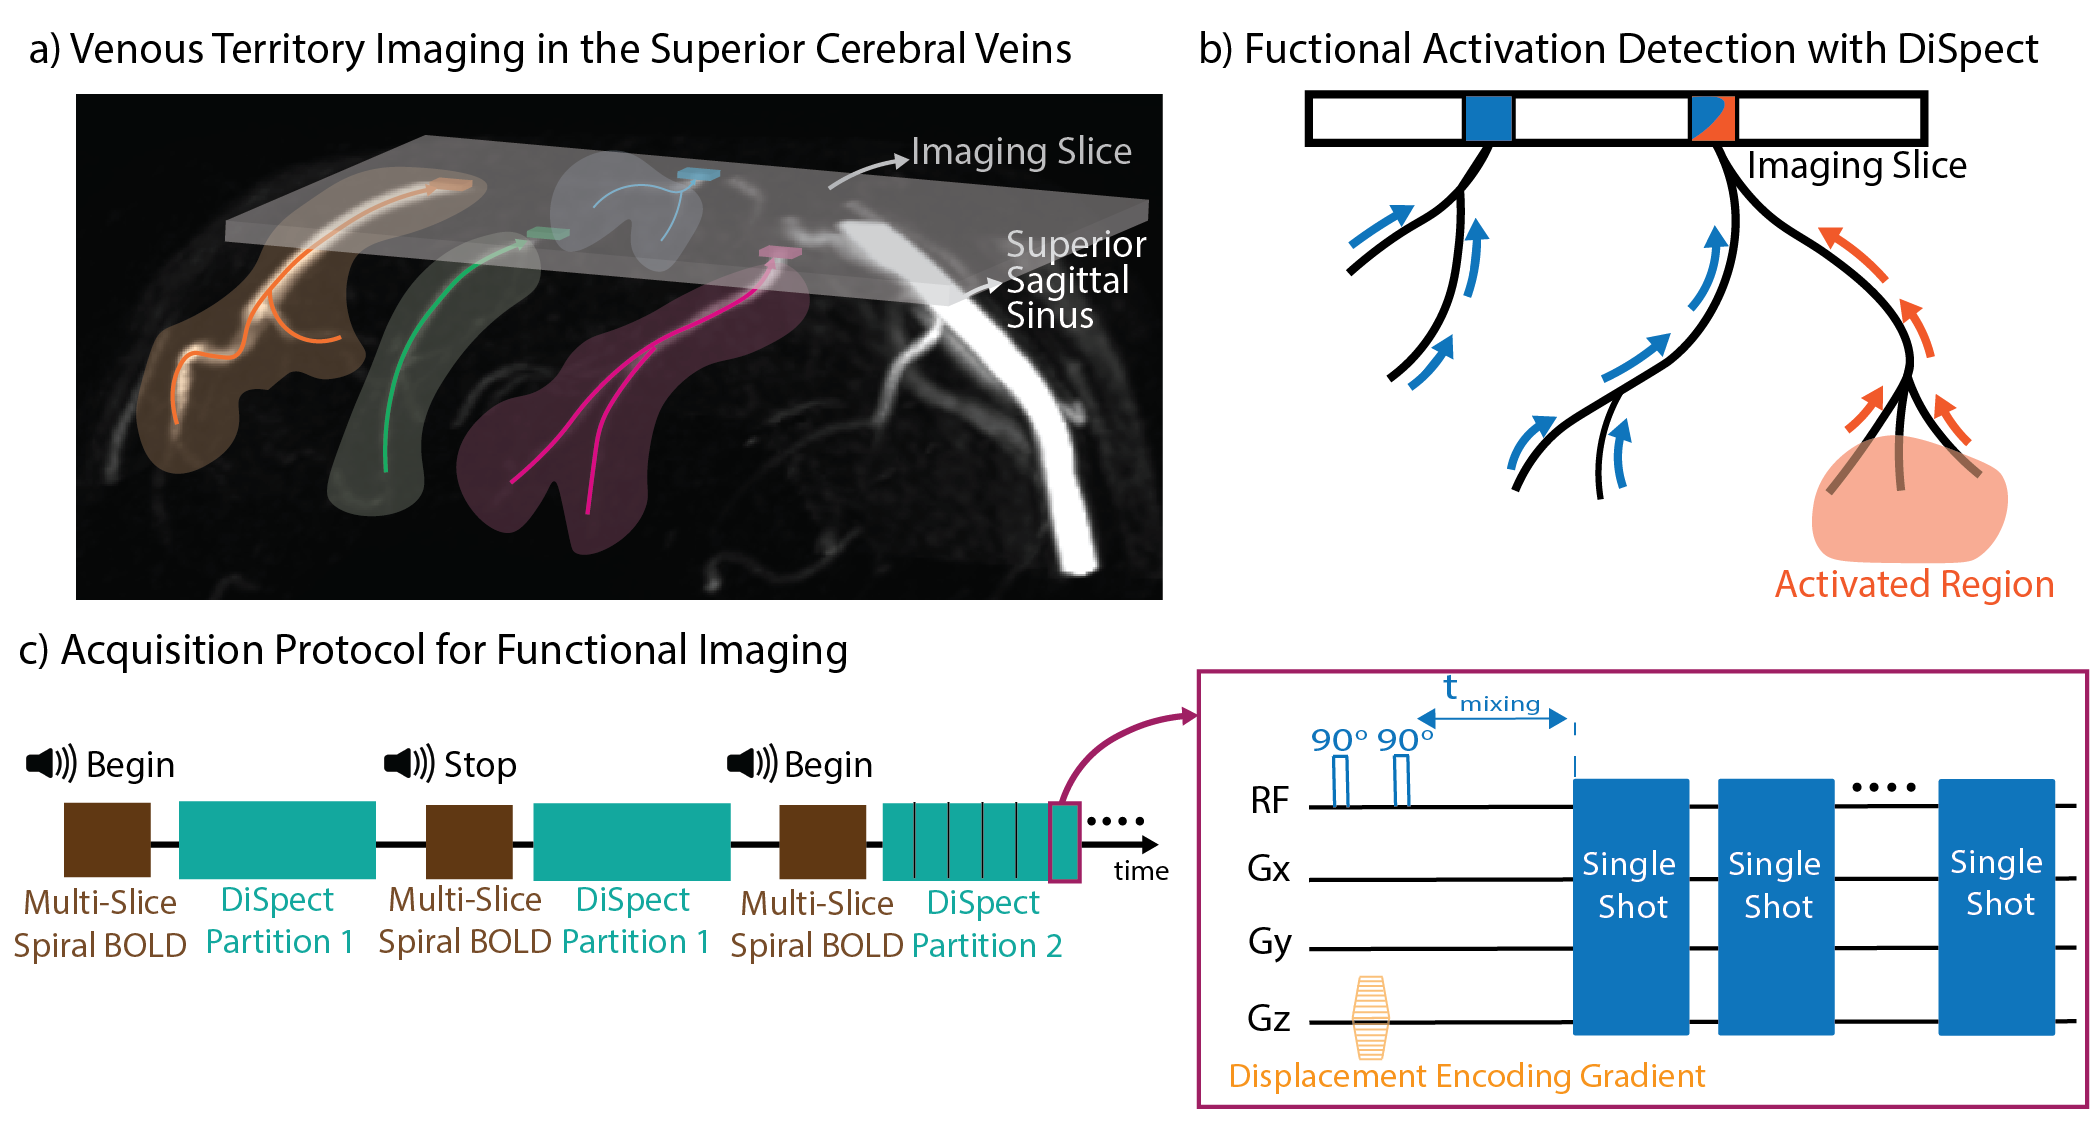
Functional MRI (fMRI) methods measure the hemodynamic response due to neuronal activation. Among these, blood-oxygenation-level-dependent (BOLD) contrast is most prominent1,2,3. One drawback is that BOLD is affected by the complex interplay of several processes4,5,6, namely blood oxygenation, cerebral blood volume (CBV) and cerebral blood flow (CBF). Vascular-space-occupancy (VASO)7 and Arterial Spin Labeling (ASL) fMRI8 are two other methods that directly probe changes in a single process: CBV and arterial CBF respectively.Displacement Spectrum Imaging (DiSpect) is a recently introduced method based on spin position tagging and imaging9,10,11. Previously11, we demonstrated that DiSpect can trace blood flow from the capillary bed into the superior cerebral veins and map venous territories (Figure 1a). Here, we show that DiSpect can repeatably and consistently detect changes in local venous blood flow due to brain activation in the motor cortex (Figure 1b).
Methods
Pulse Sequence:To keep task durations short, the full DiSpect acquisition (20-30 minutes) was split into 20-second partitions (Figure 1c). Each partition was repeated during the task and at baseline before moving to the next. A multi-slice Spiral-BOLD acquisition was performed between partitions to ensure that activation occurs consistently throughout the scan. Data from partitions were combined to form task and baseline blood source maps.
Experiments:
Two subjects were scanned using a 3T GE MR750W (GE Healthcare; Waukesha, WI). Each subject was scanned twice on separate days. 2D-DiSpect acquisitions were performed to image the superior cerebral veins during task and at baseline with an axial imaging slice (resolution=4x4mm2/FOV=16x16cm2). Displacement encoding was performed in the LR and SI directions, resulting in coronal blood source maps (projected along AP). Data was collected repeatedly for evolution times between 100ms to 3s after tagging (150ms increments).
Subject 1: the first scan (displacement resolution=8x8mm2/FOV=11.2x8cm2) was performed while the subject was instructed to squeeze both hands. To visualize changes in the right motor cortex at higher resolution, a repeat scan (displacement resolution=6x6mm2/FOV=7.2x4.8cm2) was performed while the subject was instructed to squeeze only their left hand.
Subject 2: the same acquisition protocol (displacement resolution=8x8mm2/FOV=11.2x8cm2) was repeated on two separate days, while the subject was instructed to squeeze their right hand.
For each scan session, a product 2D EPI-BOLD (resolution=3.3x3.3mm2/FOV=21x21cm2/TR=2s/TE=28ms) sequence was performed. The subject was instructed to perform the task for 20s on and 20s off for 5 minutes.
Quantitative Susceptibility Mapping (QSM) was used to obtain a detailed map of veins, with protocol similar to [11]. STI Suite V3.012 was used to obtain susceptibility maps with the iLSQR13 method. The coronal vein structure was visualized using a maximum intensity projection.
Data Analysis:
The EPI-BOLD datasets were analyzed with SPM1214. T-statistic images were obtained with a p-value threshold of 0.01.
The percentage signal change in the blood source maps was calculated as:
$$$\%$$$Signal Change = $$$\frac{S_{task} -S_{baseline}}{S_{baseline}} \cdot 100\%$$$.
Results and Discussion
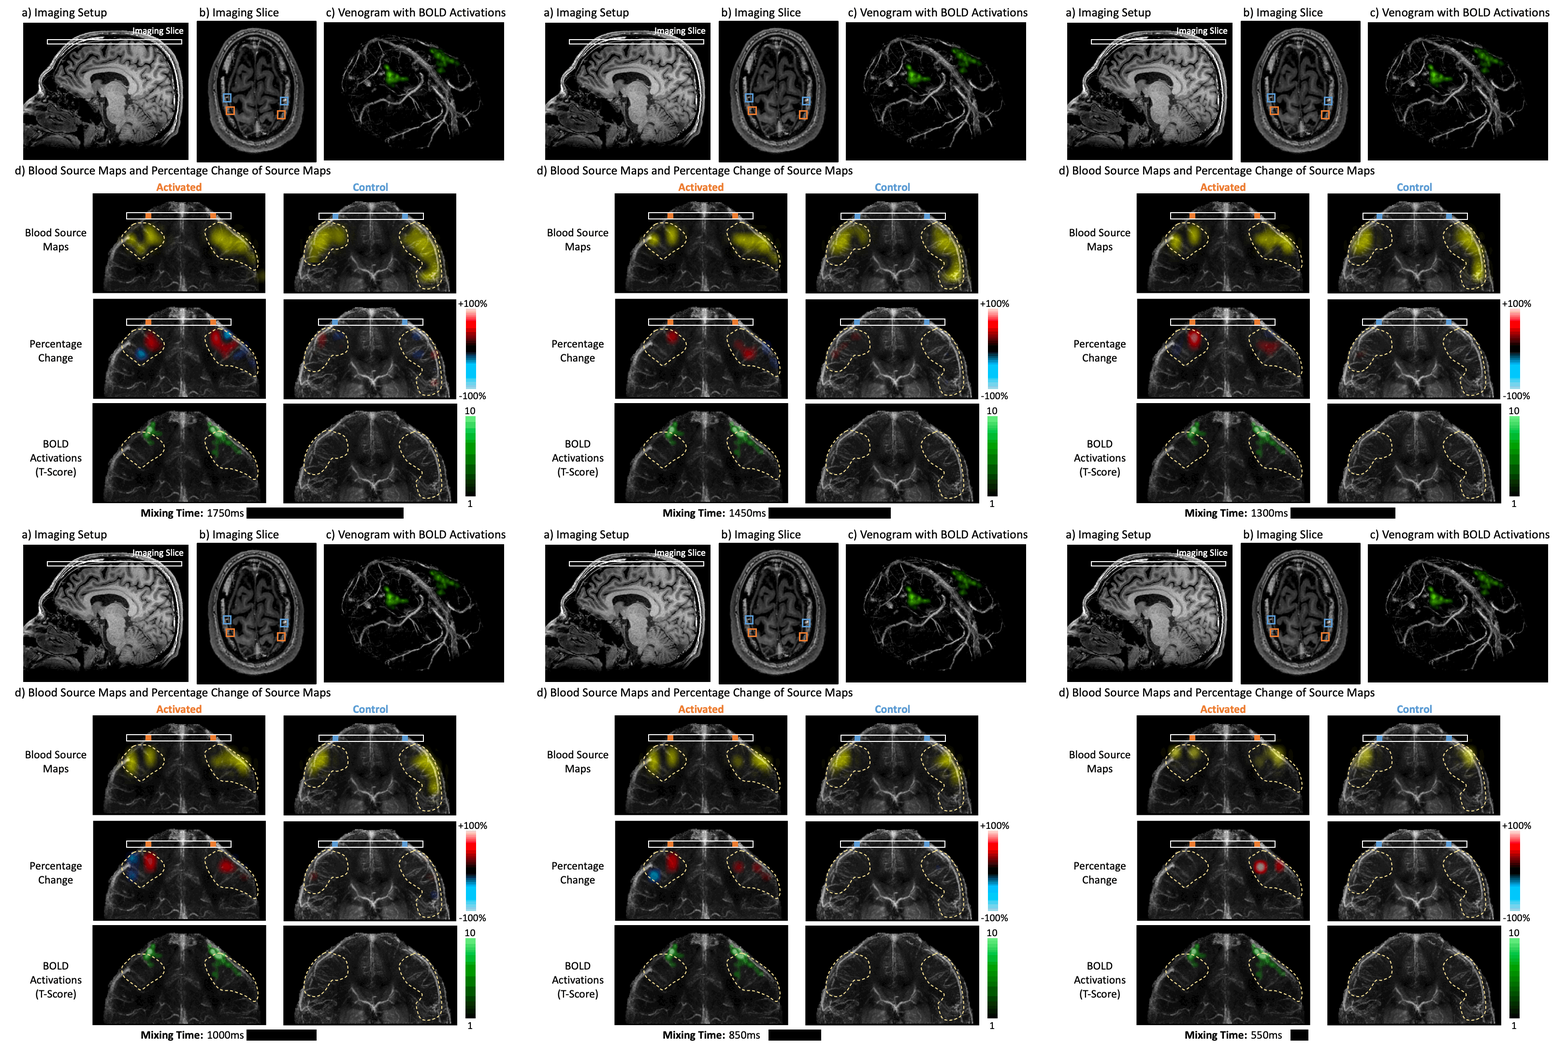
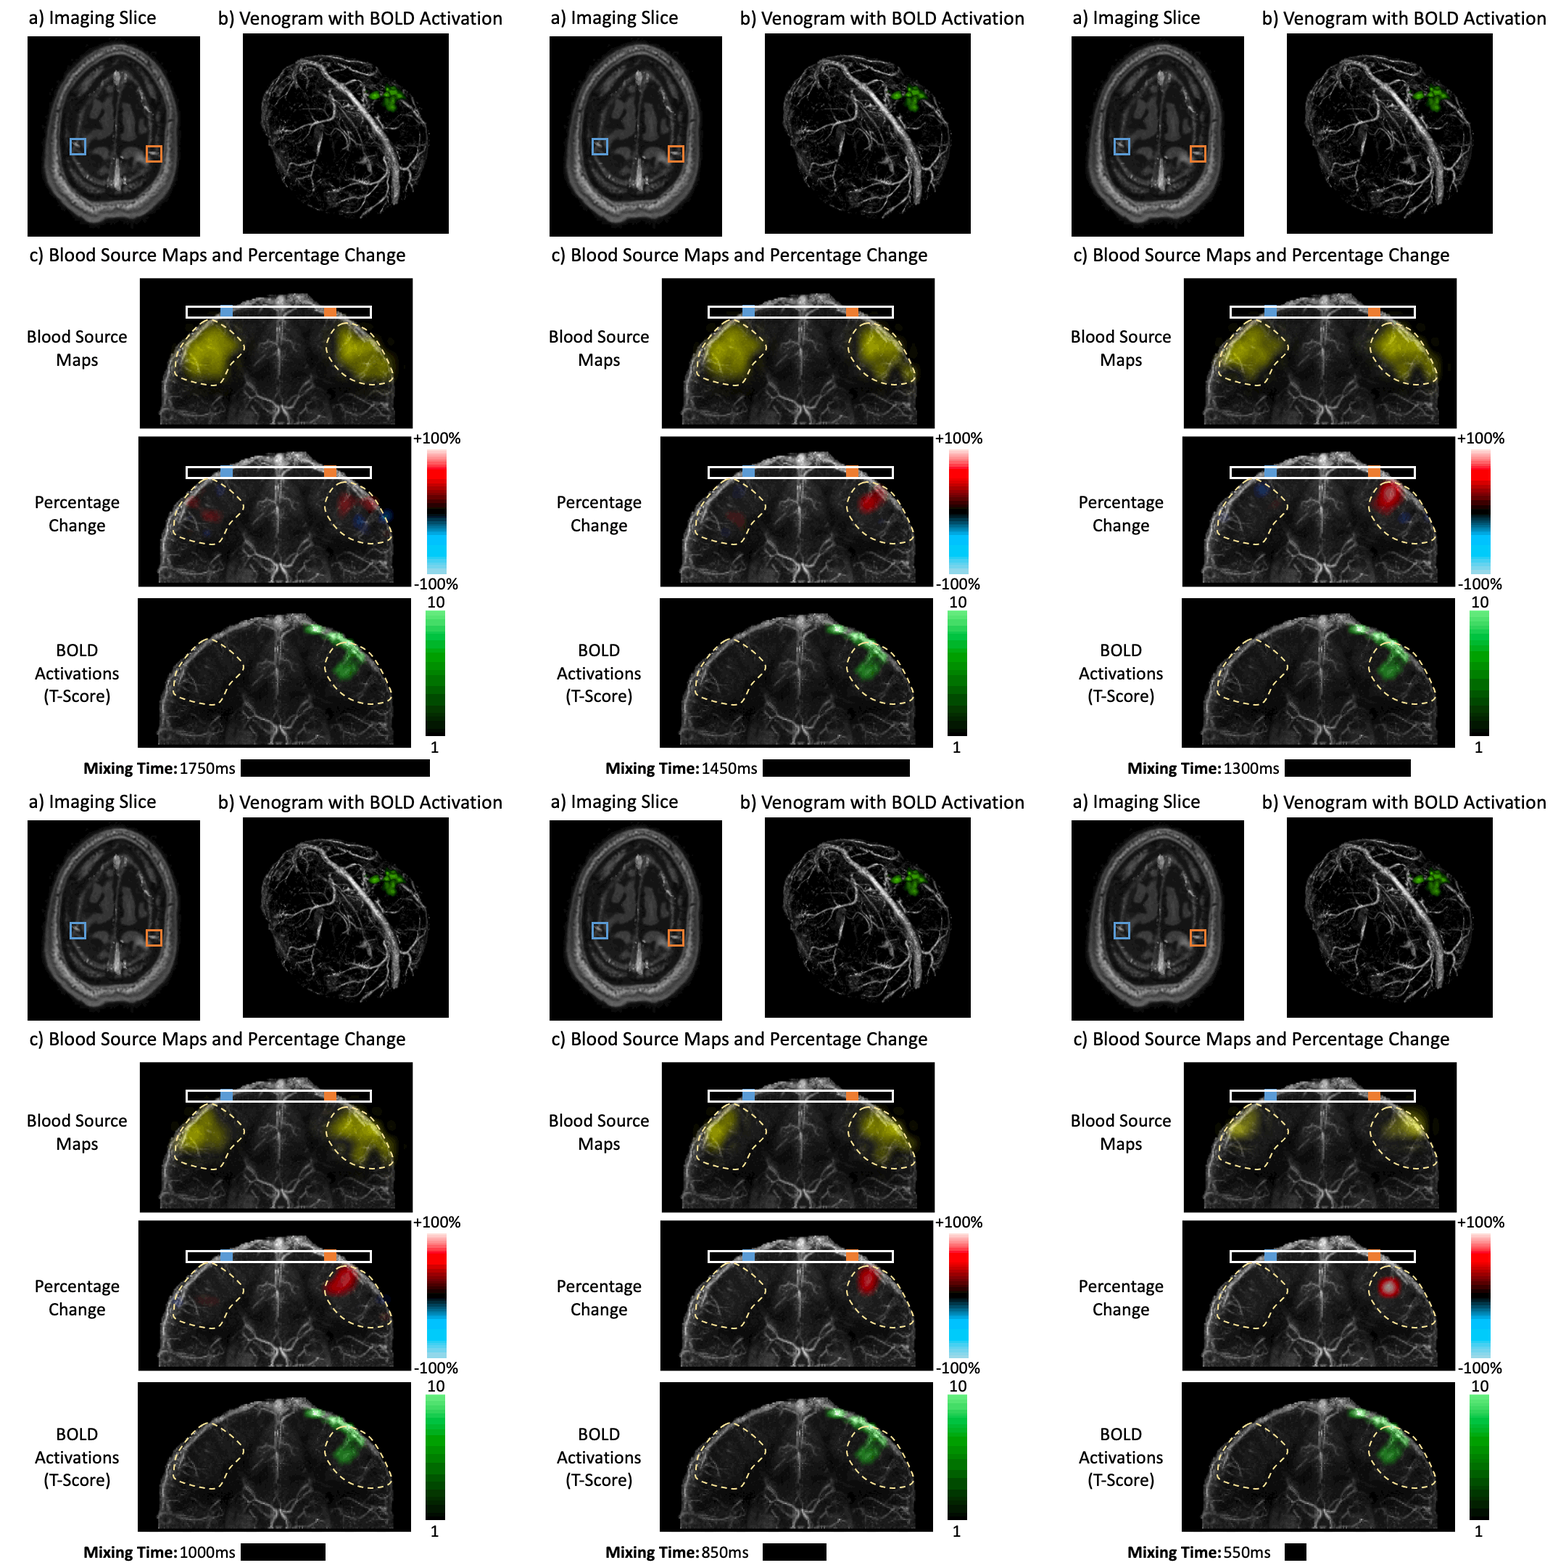
The results from Subject 1 with bilateral motor cortex activation are displayed (Figure 2). Four veins are selected: two (orange) drain the activated motor cortices and two (blue) are controls. The blood source maps and their percentage change is shown for each vein (Figure 2d).Similarly, the results of the first scan of Subject 2 with left motor cortex activation are shown (Figure 3). For this case, one activated (orange) and one control (blue) vein were selected.
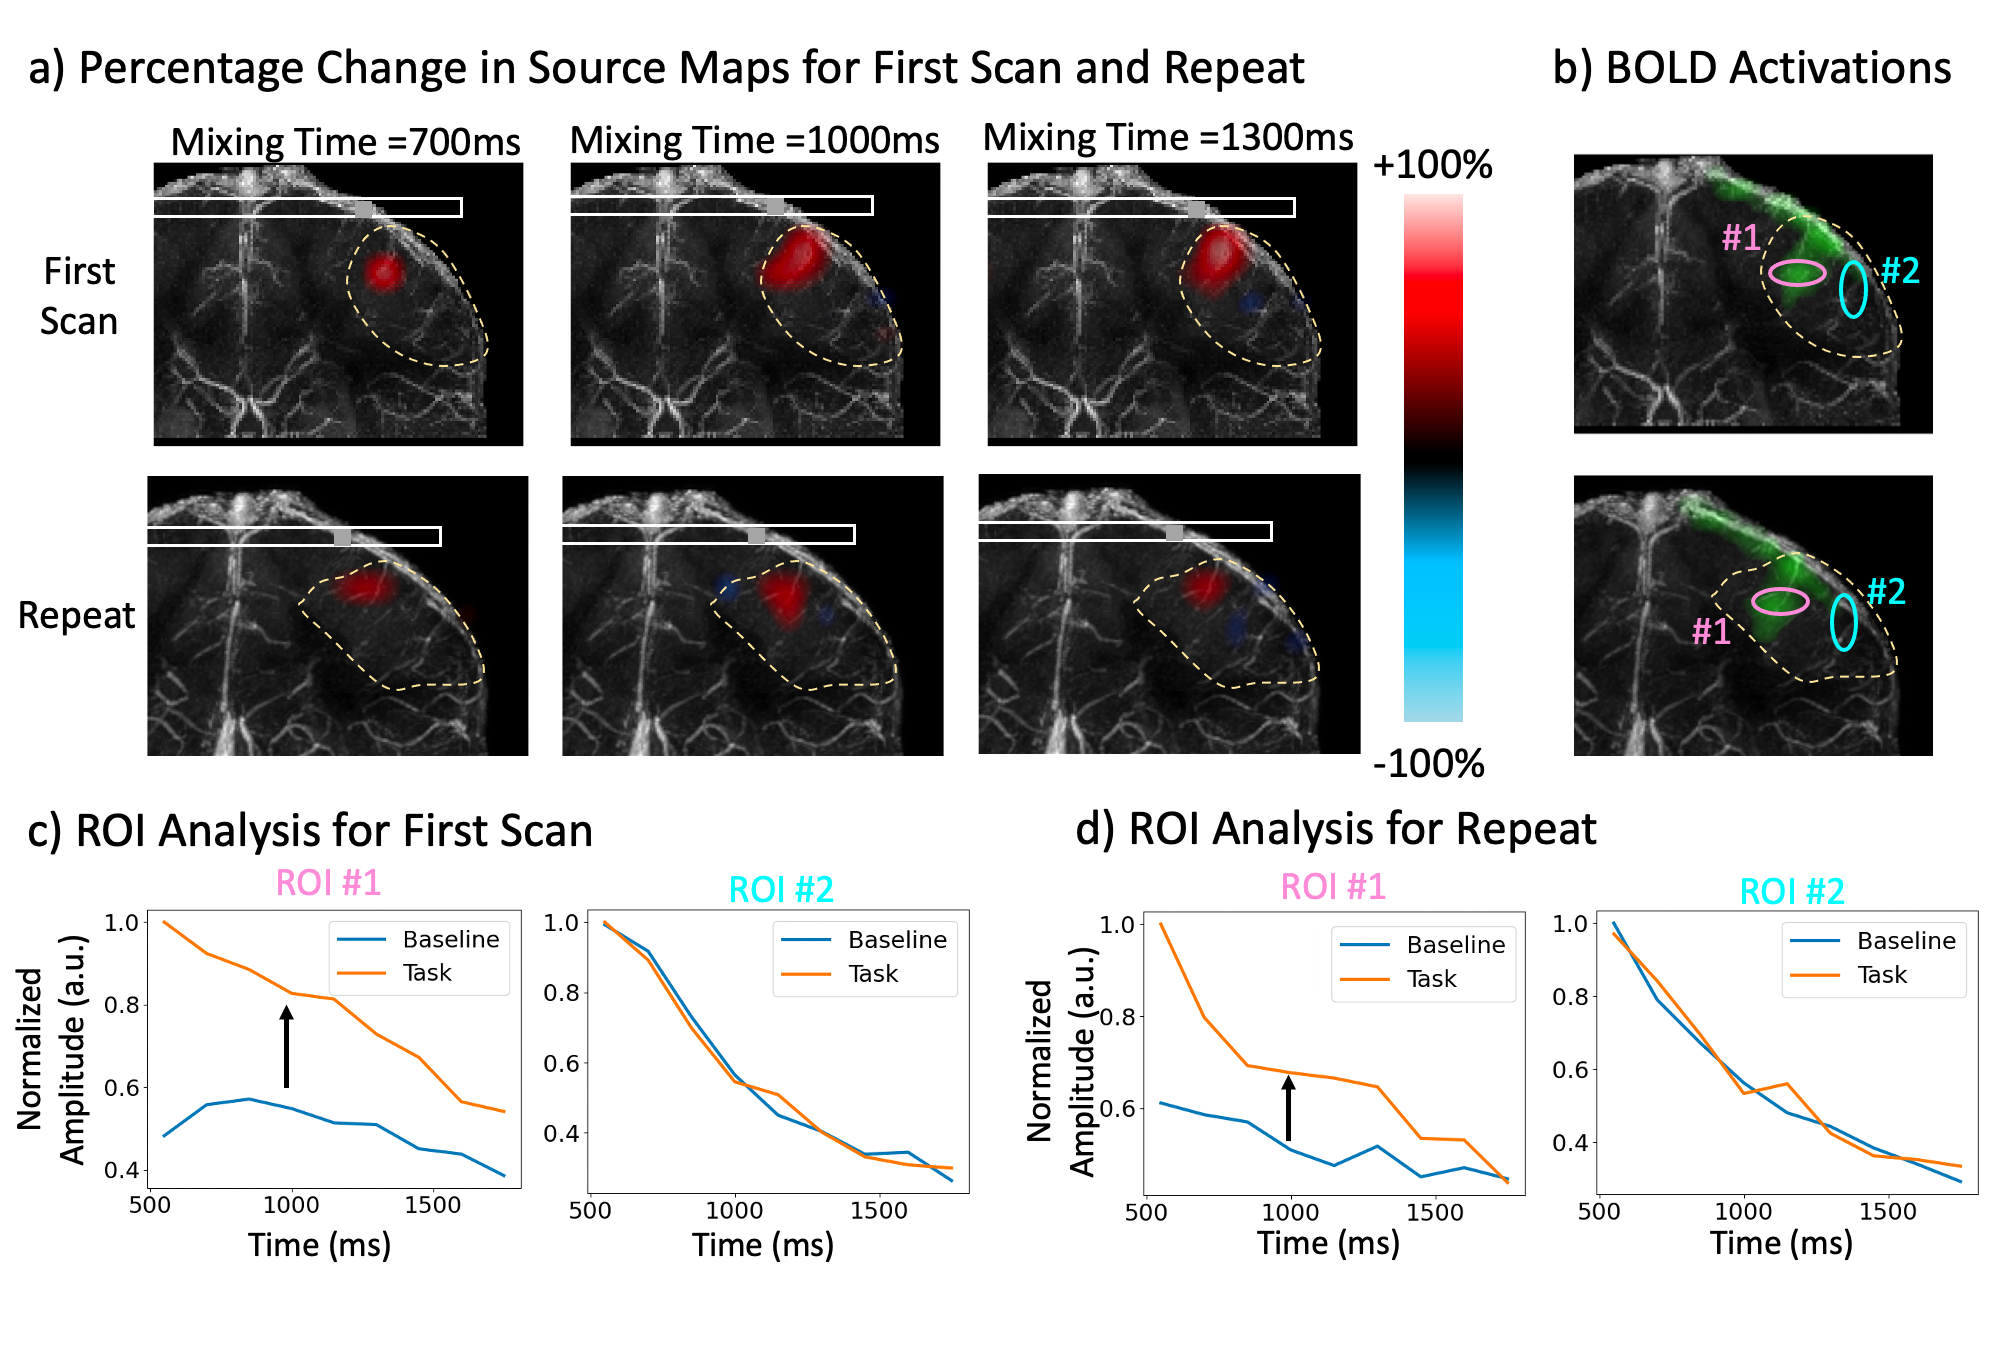
The source maps of the activated veins show a large local blood flow increase close to the BOLD activation in both subjects. For Subject 1, a local decrease in blood flow is also observed near the right motor cortex, slightly further away from the neural activation, suggesting a possible redistribution of blood flow. The control veins show very little difference in both subjects.
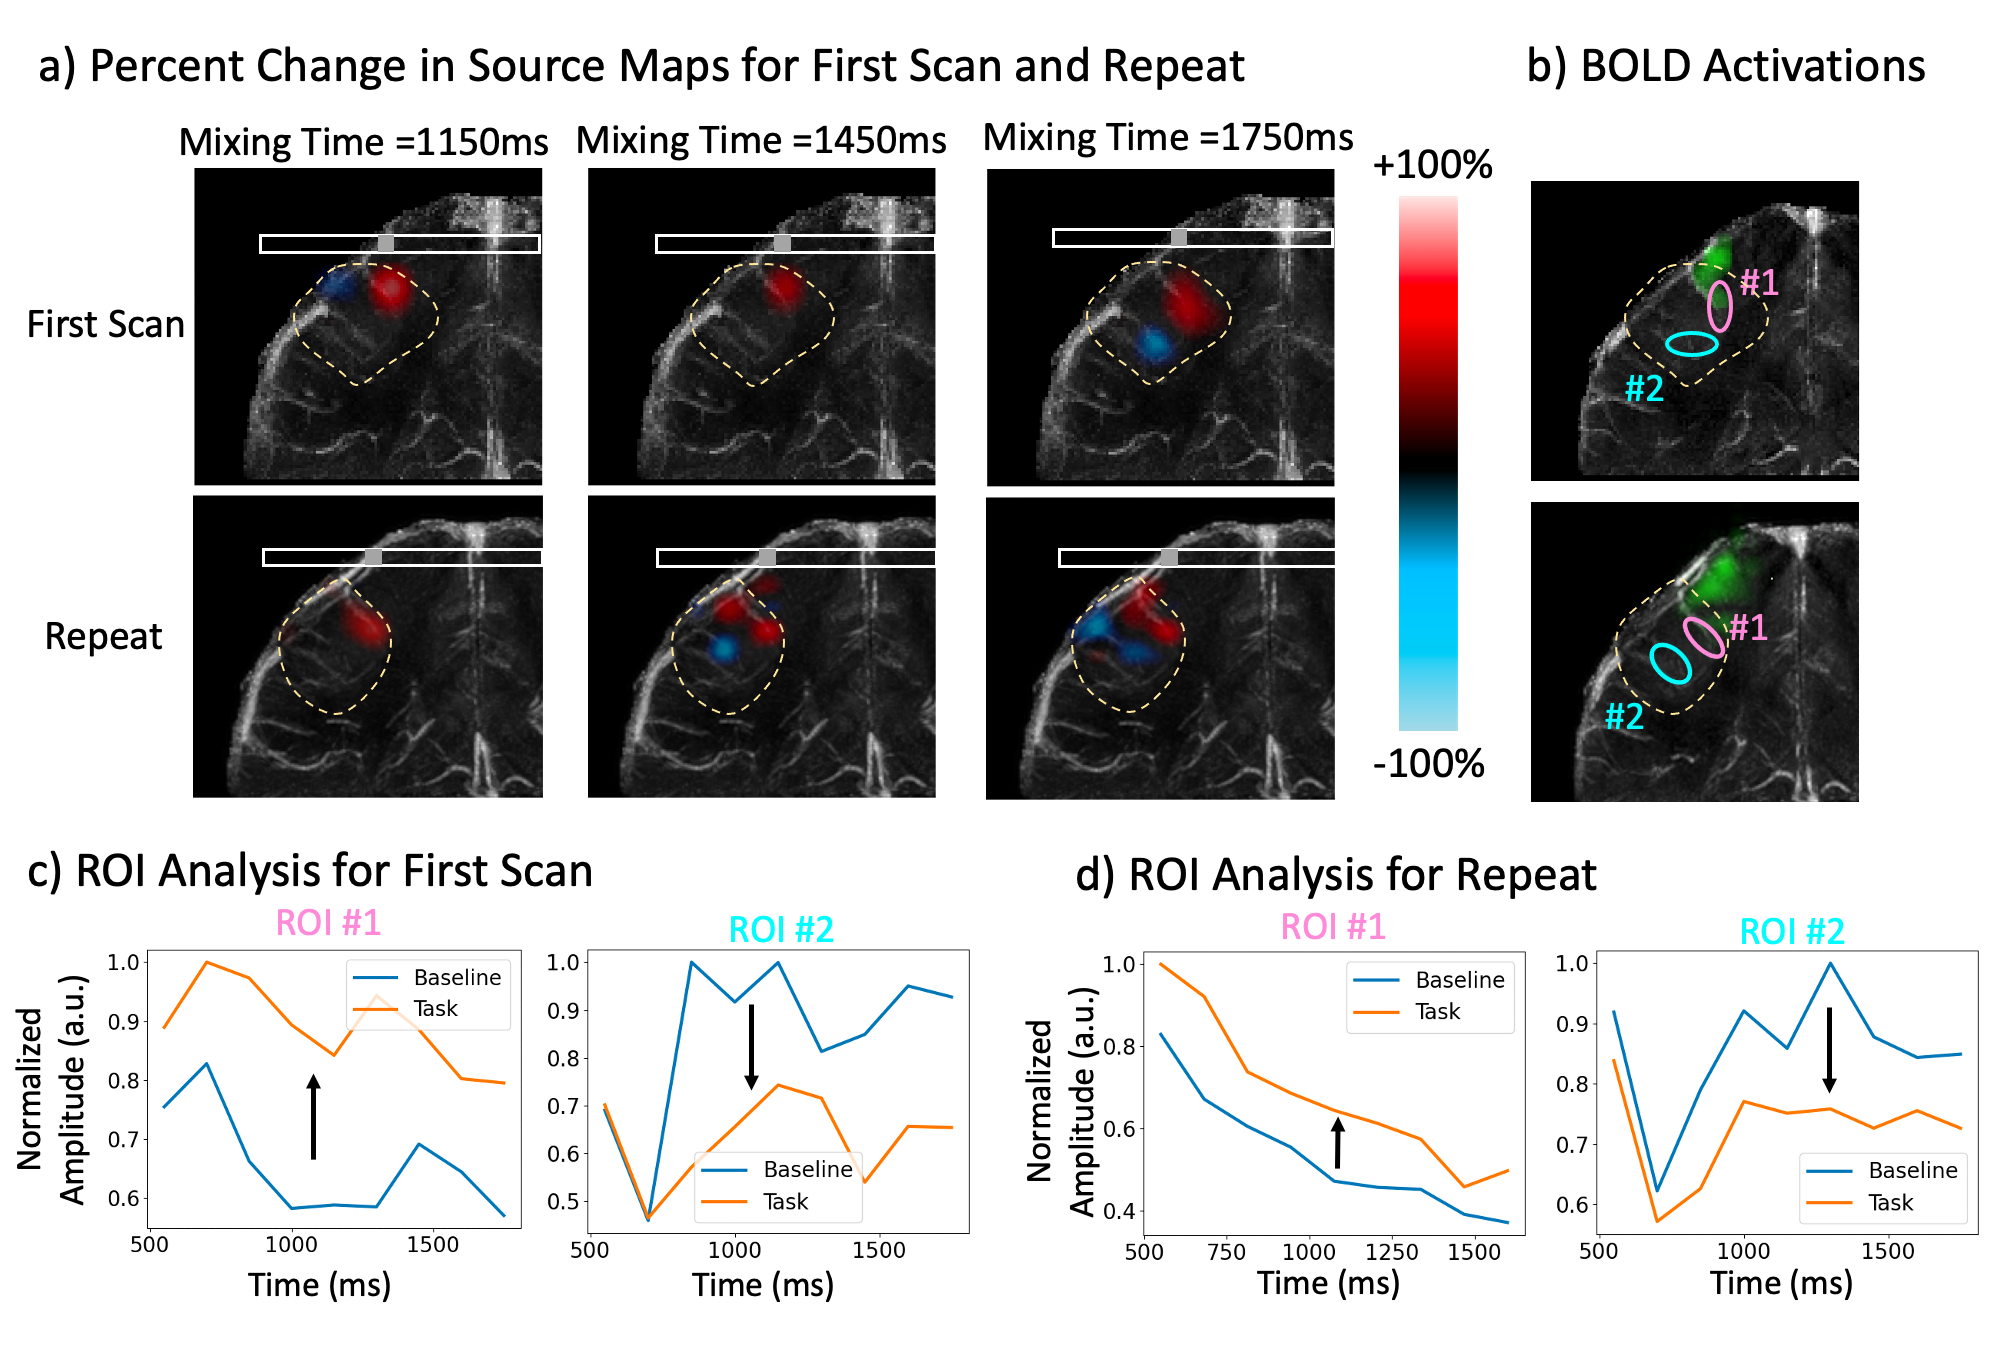
To demonstrate repeatability for both subjects, we display the percent change in source maps of the same activated vein from two scans (Figures 4a and 5a). The two scans are performed on different sessions, causing differences in head orientation. Despite the orientation mismatch, territory regions with blood flow modulations show good overlap.
To look at the consistency of modulations within venous territories, two ROIs were selected from the territories and their signal amplitude was displayed at task and baseline (Figures 4b-d and 5b-d). The signal difference between baseline and task was consistently in the same direction for repeated scans. The second ROI, near the right motor cortex of Subject 1, (Figure 4c-d) consistently showed decreased signal during activation, supporting the existence for a redistribution.
Conclusions
DiSpect can capture venous blood flow changes during a motor task. Our tool can potentially help to better understand the venous processes contributing to the BOLD signal.Acknowledgements
We thank the funding source R01MH127104 and GE Healthcare. We would also like to thank Jingjia Chen for her QSM processing code.References
- Bandettini PA, Wong EC, Hinks RS, et al. Time course EPI of human brain function during task activation. Magn Reson Med. 1992;25:390.
- Kwong KK, Belliveau JW, Chesler DA, et al. Dynamic magnetic resonance imaging of human brain activity during primary sensory stimulation. Proc Natl Acad Sci U S A. 1992;89:5675.
- Ogawa S, Tank DW, Menon R, Ellermann JM, Kim SG, Merkle H, Ugurbil K. Intrinsic signal changes accompanying sensory stimulation: functional brain mapping with magnetic resonance im-aging. Proc Natl Acad Sci USA 1992;89:5951–5955.
- Ogawa S, Menon RS, Tank DW, Kim SG, Merkle H, Ellermann JM,Ugurbil K. Functional brain mapping by blood oxygenation level dependent contrast magnetic resonance imaging. A comparison of signal characteristics with a biophysical model. Biophys J 1993;64:803–812.
- Turner R, Le Bihan D, Moonen CT, Despres D, Frank J. Echo-planar time course MRI of cat brain oxygenation changes. Magn Reson Med 1991;22:159–166.
- van Zijl PC, Eleff SM, Ulatowski JA, Oja JM, Ulug AM, Traystman RJ,Kauppinen RA. Quantitative assessment of blood flow, blood volume and blood oxygenation effects in functional magnetic resonance imag-ing. Nat Med 1998;4:159–167.
- Lu H, Golay X, Pekar JJ, Van Zijl PC. Functional magnetic resonance imaging based on changes in vascular space occupancy. Magn Reson Med. 2003 Aug;50(2):263-74.
- Borogovac A, Asllani I. Arterial Spin Labeling (ASL) fMRI: advantages, theoretical constrains, and experimental challenges in neurosciences. Int J Biomed Imaging. 2012;2012:818456.
- Zhang, Zhiyong, et al. "DiSpect: Displacement spectrum imaging of flow and tissue perfusion using spin‐labeling and stimulated echoes." Magnetic Resonance in Medicine (2021).
- Karasan, Ekin et al. ““Reverse Perfusion” Imaging of the Cerebral Venous System with Displacement Spectrum Imaging (DiSpect).” Proc. ISMRM (2022).
- Karasan, Ekin et al. “Advances in Post-Perfusion Venous Territories Imaging with Displacement Spectrum Imaging (DiSpect).” Proc. ISMRM (2023).
- https://people.eecs.berkeley.edu/~chunlei.liu/software.html
- Li, Wei, et al. "A method for estimating and removing streaking artifacts in quantitative susceptibility mapping." Neuroimage, 108 (2015): 111-122.
- http://fil.ion.ucl.ac.uk/spm/
Figures