1287
Visual stimulus-evoked blood velocity responses at far upstream branches of the Posterior Cerebral Artery measured with phase-contrast fMRA1Athinoula A. Martinos Center for Biomedical Imaging, Massachusetts General Hospital, Boston, MA, United States, 2Department of Radiology, Harvard Medical School, Boston, MA, United States, 3School of Information Technology and Electrical Engineering, Faculty of Engineering, Architecture and Information Technology, The University of Queensland, Brisbane, Australia, 4Department of Electrical Engineering, Mathematics, and Computer Science, University of Twente, Enschede, Netherlands, 5J. Philip Kistler Stroke Research Center, Massachusetts General Hospital, Boston, MA, United States, 6Department of Neurology, Harvard Medical School, Boston, MA, United States, 7Harvard-MIT Division of Health Sciences and Technology, Massachusetts Institute of Technology, Cambridge, MA, United States
Synopsis
Keywords: fMRI Acquisition, fMRI
Motivation: Neuronal activity induces vasodilation in local arterioles that propagates to upstream large arteries, but the furthest detectable arterial dilation from the site of neuronal activity remains unknown.
Goal(s): Detecting blood velocity responses at far upstream branches of the Posterior Cerebral Artery induced by a visual stimulus.
Approach: In this study, a functional phase-contrast MRA technique was combined with a commonly used block-design stimulation paradigm to detect blood velocity responses.
Results: About 10–20% velocity increases at the P2 segments of the Posterior Cerebral Artery were robustly observed.
Impact: We demonstrate that neuronal activity-induced velocity response can propagate to large feeding arteries 6–7 cm from the visual cortex. The spatial and temporal properties of this propagation are important for understanding neurovascular coupling, autoregulation, and human fMRI.
INTRODUCTION
Functional MRI tracks brain activity through the associated hemodynamic changes via neurovascular coupling1, therefore the precision of blood flow regulation dictates the ultimate spatial specificity of fMRI. Activity-induced vasodilation occurs first in local arterioles then propagates upstream to larger feeding arteries2, 3, however the distance of the furthest detectable arterial dilation is unknown. In-vivo microscopy has provided fundamental insights into neurovascular coupling, nevertheless it cannot easily address this question due to limits on the size of the imaged brain region. Functional Transcranial Doppler (fTCD) noninvasively measures blood flow4-7, albeit with low spatial resolution. Conventional functional MR angiography (fMRA)8, 9 uses MRI to quantify responses in large vessels, but with poor temporal resolution (on the scale of multiple minutes) and so the extremely long stimulus periods required might limit interpretability of these studies. Discrepancies have also been reported between fMRA and fTCD measures6, 9. Here we employ a real-time phase-contrast fMRA10 technique to examine vascular responses in the posterior cerebral artery (PCA)—which supplies the human visual cortex—during neuronal activation using a block-design stimulation paradigm similar to those used in conventional fMRI studies. We observed a 10–20% velocity increase in the P2-segment of the PCA, several centimeters upstream from the neuronal activity, in close agreement to prior fTCD measurements, demonstrating feasibility of fMRA for studying the upstream propagation of vascular responses.METHODS
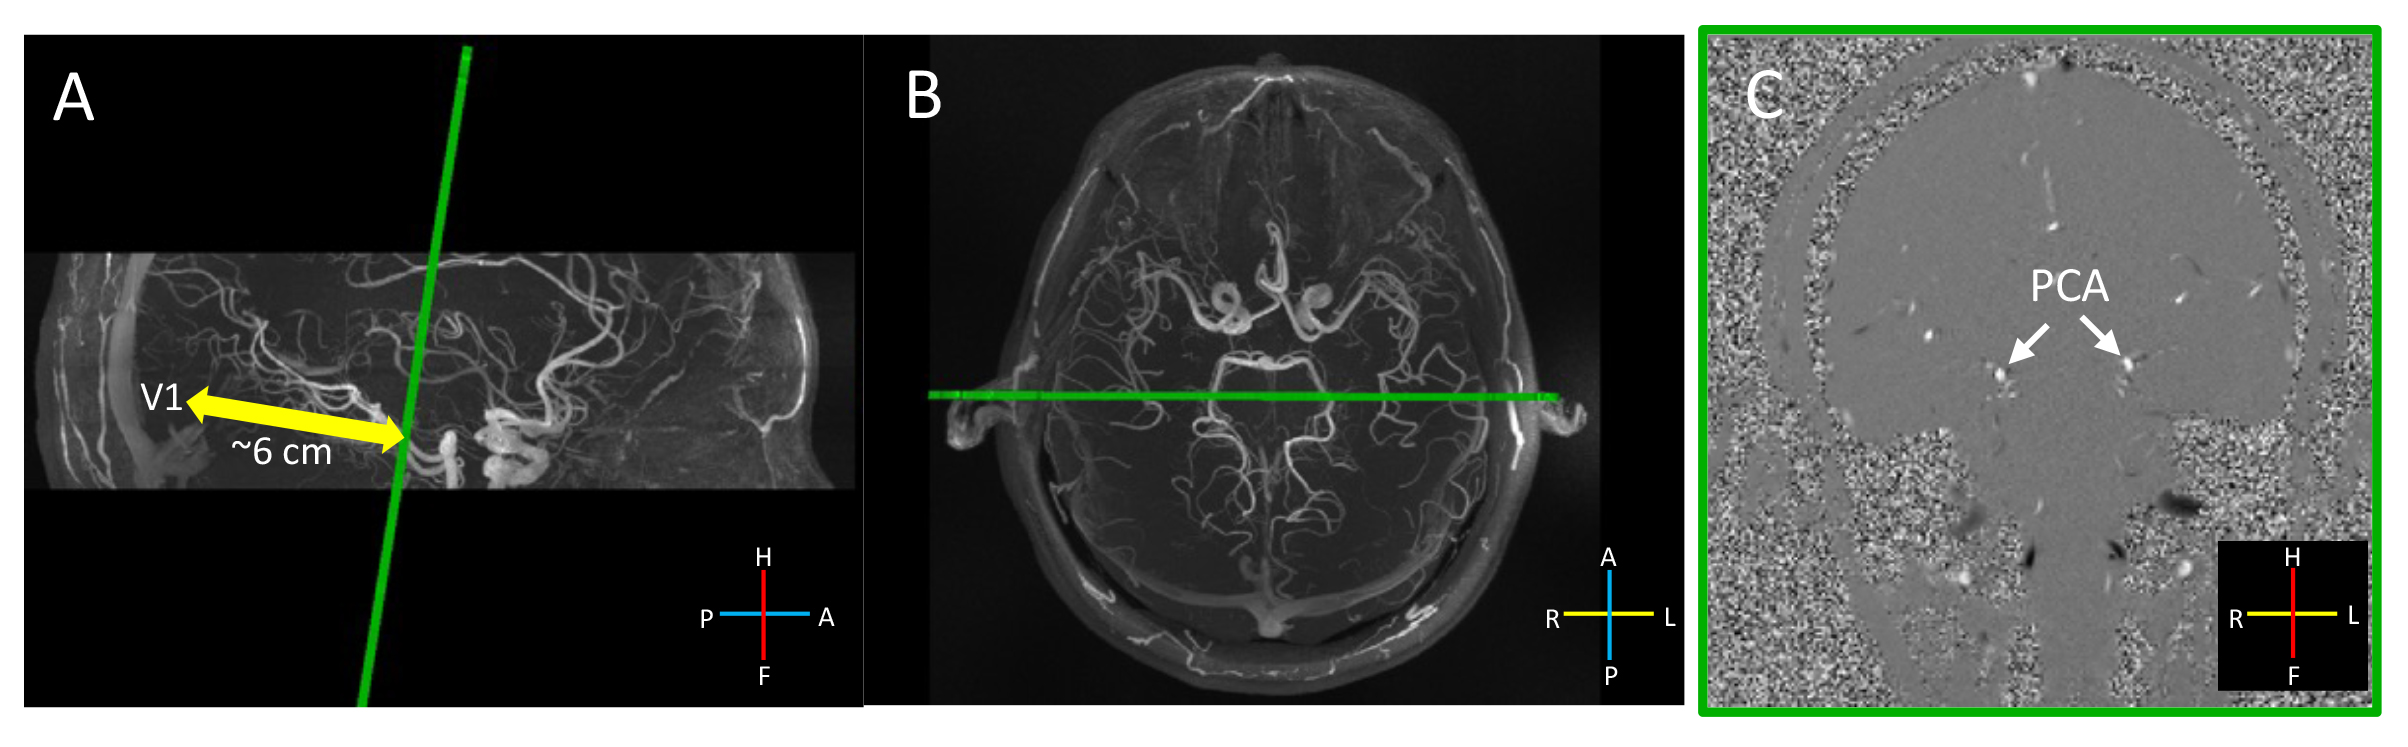
All volunteers provided written informed consent prior to scanning, following all policies of our institution’s Human Subjects Research Committee. Experiments were conducted either on a 3T Siemens Prisma or a whole-body 7T Siemens Terra scanner11. One slice perpendicular to the P2-segment of the PCA (Fig. 1) was acquired (inplane-resolution = 0.8×0.8 mm2, slice thickness = 2 mm, velocity encoding = 60 cm/s, TR/TE = 4.93/16.76 ms, flip angle = 13°, temporal resolution = 2.15 s, 148 dynamics, scan time = 5:18). Stimulation consisted of an 18-s baseline period then five 60-s epochs of flashing checkerboard stimuli (24/36 s ON/OFF). Three runs were acquired. A 3D Time-of-Flight (TOF) was acquired for localizing the vessels.Activation maps were estimated using a standard GLM analysis implemented in FSL FEAT12. Z-score images were thresholded at Z>3.113. Velocities were corrected for eddy-current-induced biases using background phase from neighboring ROIs14. Trial-averaged responses were calculated for both the right and left PCAs, averaging across all the activated voxels in each vessel. Baseline velocities were defined as the initial velocities in the response curves. Mean velocities for ON- and OFF-periods were calculated by averaging the velocities from the temporal plateau of each period.
RESULTS
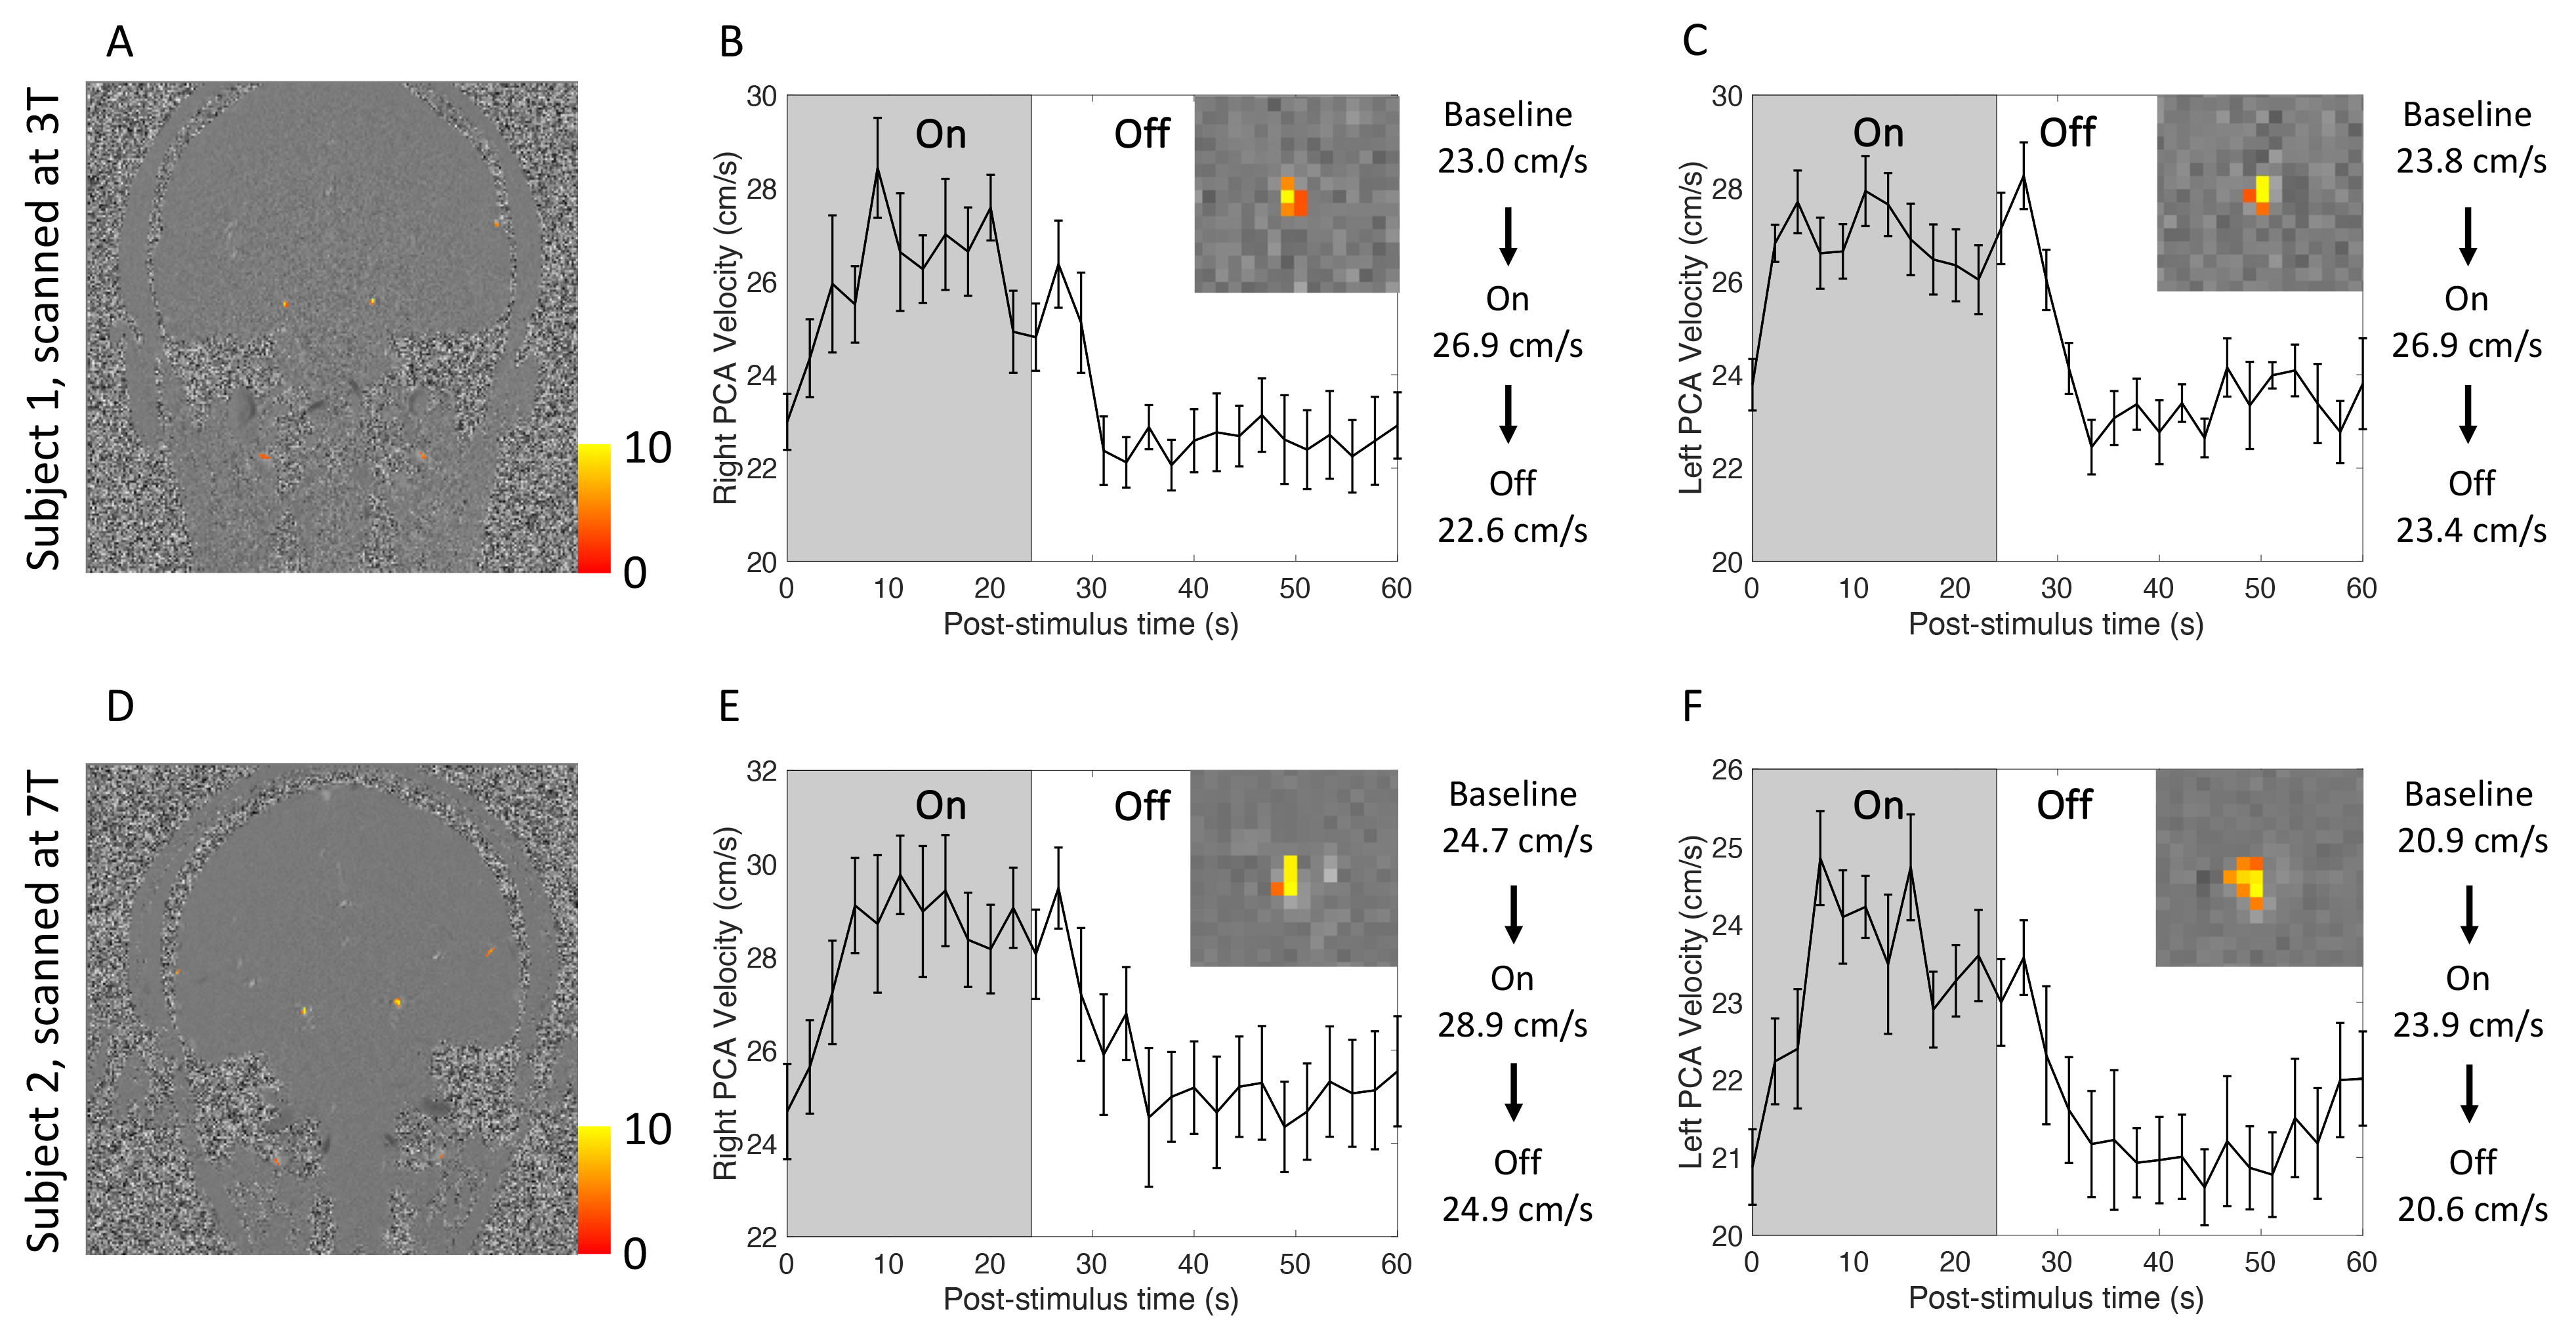
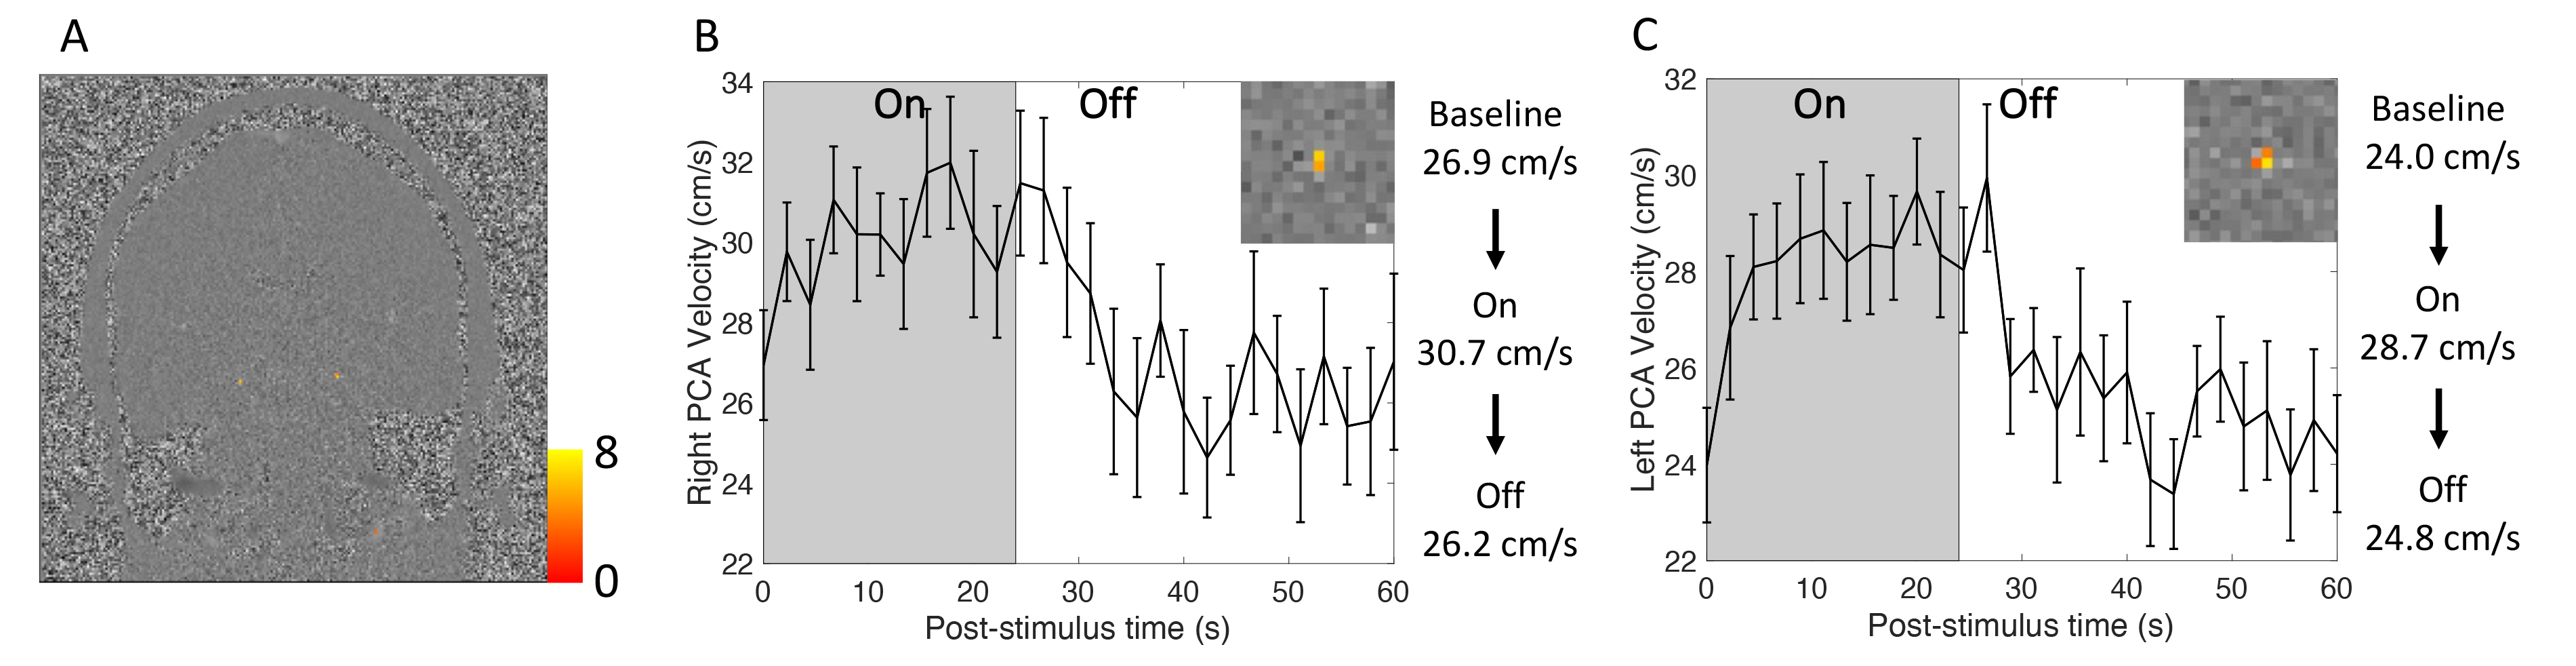
Fig. 2 shows robust visual responses in the P2-segment velocity in two healthy volunteers. Fig. 3 shows similar results for a 69-year-old patient with cerebral amyloid angiopathy (CAA). Both the right and left PCAs were found to be significantly activated for each subject. A 10–20% blood velocity increase was observed. For all subjects, velocity increases in ON-period were 3.80±0.62 cm/s higher than baseline and 3.84±0.56 cm/s higher than those of the OFF-period. Velocities differed among subjects, potentially due to differences in slice positions along the P2-segment, angles relative to the blood flow directions, partial volume effects, and subject-related systemic factors such as arterial pressure15.DISCUSSION and CONCLUSION
Our data demonstrate that neuronal activity-induced flow changes up to 10–20% occur in upstream large arteries 6–7 cm from the visual cortex. This suggests that an unexpectedly large region of the cerebral cortex may experience functional hyperemia. Admittedly our stimulus is intense and may activate an atypically large percentage of the cortex, for example, potential activations can be found in branches of middle cerebral artery in Figs. 2A and 2D, which supply visually-responsive cortex; blood velocity changes may be detected even further upstream than where we sampled here. The underlying mechanisms require further investigation; whether this upstream may be attributed to neurovascular coupling or autoregulation is unclear.Real-time phase-contrast fMRA can reveal meaningful temporal features of individual blood vessel responses. For example, a potential post-stimulus undershoot can be observed in Fig. 2F. Reduced vascular reactivity in CAA16 may lead to slower responses in supply arteries, which may provide new insights into disease mechanisms.
Conventional BOLD-fMRI is mainly influenced by deoxyhemoglobin in veins17, and since the blood oxygenation response is shaped in part by blood flow changes in arteries, these far upstream arterial velocity changes will also likely impact the spatial and temporal features of the observed BOLD response. Phase-contrast fMRA thus can help interpret conventional fMRI data. Furthermore, it may provide a practical replacement for fTCD, as velocity changes from a greater number of blood vessels may be accessible in this approach.
Acknowledgements
We would like to thank Estee Perelgut, Sarah Richter, Kyle Droppa and Arianna Tidball for their help with subject recruitment and MRI scanning support, and Drs. Mukund Balasubramanian and Yulin Chang for their helpful feedback. This work was supported in part by the NIH NIBIB (grants P41-EB030006 and R01-EB019437), NCCIH (grant R01-AT011429), NINDS (grant R01-NS114526), by the BRAIN Initiative (NIH NIMH grant R01-MH111419 and NIH NINDS grants U19-NS123717 and U19-NS128613), and by the MGH/HST Athinoula A. Martinos Center for Biomedical Imaging; and was made possible by the resources provided by NIH Shared Instrumentation Grant S10-OD023637.References
1. Iadecola C. The Neurovascular Unit Coming of Age: A Journey through Neurovascular Coupling in Health and Disease. Neuron 2017;96:17-42.2. Iadecola C, Yang G, Ebner TJ, Chen G. Local and propagated vascular responses evoked by focal synaptic activity in cerebellar cortex. J Neurophysiol 1997;78:651-659.
3. Chen BR, Bouchard MB, McCaslin AF, Burgess SA, Hillman EM. High-speed vascular dynamics of the hemodynamic response. NeuroImage 2011;54:1021-1030.
4. Aaslid R. Visually evoked dynamic blood flow response of the human cerebral circulation. Stroke 1987;18:771-775.
5. Conrad B, Klingelhofer J. Dynamics of regional cerebral blood flow for various visual stimuli. Exp Brain Res 1989;77:437-441.
6. Smith EE, Vijayappa M, Lima F, et al. Impaired visual evoked flow velocity response in cerebral amyloid angiopathy. Neurology 2008;71:1424-1430.
7. Burma JS, Van Roessel RK, Oni IK, Dunn JF, Smirl JD. Neurovascular coupling on trial: How the number of trials completed impacts the accuracy and precision of temporally derived neurovascular coupling estimates. J Cereb Blood Flow Metab 2022;42:1478-1492.
8. Kang CK, Kim SH, Lee H, Park CA, Kim YB, Cho ZH. Functional MR angiography using phase contrast imaging technique at 3T MRI. NeuroImage 2010;50:1036-1043.
9. Bizeau A, Gilbert G, Bernier M, et al. Stimulus-evoked changes in cerebral vessel diameter: A study in healthy humans. J Cereb Blood Flow Metab 2018;38:528-539.
10. Chen X, Jiang Y, Choi S, et al. Assessment of single-vessel cerebral blood velocity by phase contrast fMRI. PLoS Biol 2021;19:e3000923.
11. Mareyam A, Kirsch JE, Chang Y, Madan G, Lawrence W. A 64-Channel 7T array coil for accelerated brain MRI. ISMRM; 2020.
12. Woolrich MW, Ripley BD, Brady M, Smith SM. Temporal autocorrelation in univariate linear modeling of FMRI data. NeuroImage 2001;14:1370-1386.
13. Worsley KJ. Statistical analysis of activation images. Functional MRI: An introduction to methods 2001;14:251-270.
14. Hibert ML, Chen YI, Ohringer N, et al. Altered Blood Flow in the Ophthalmic and Internal Carotid Arteries in Patients with Age-Related Macular Degeneration Measured Using Noncontrast MR Angiography at 7T. AJNR Am J Neuroradiol 2021;42:1653-1660.
15. Schaeffer S, Iadecola C. Revisiting the neurovascular unit. Nat Neurosci 2021;24:1198-1209.
16. Biffi A, Greenberg SM. Cerebral amyloid angiopathy: a systematic review. Journal of Clinical Neurology 2011;7:1-9.
17. Turner R. How much cortex can a vein drain? Downstream dilution of activation-related cerebral blood oxygenation changes. NeuroImage 2002;16:1062-1067.
Figures