1280
Real-time automatic multipoint temperature regulation during MRI-guided Laser-induced Thermotherapy (MR-LITT)1University of Bordeaux, CNRS, CRMSB, UMR 5536, IHU Liryc, Bordeaux, France, 2Certis Therapeutics, Pessac, France, 3ALPhANOV, Talence, France
Synopsis
Keywords: MR-Guided Interventions, MR-Guided Interventions, LITT, laser, ablation, thermometry
Motivation: Current Laser devices used during MR-guided LITT can use single or multiple fibers to create coagulation necrosis, but do not provide opportunities for precise temperature control in tissue.
Goal(s): We present an automatic control algorithm combined with a multi-source laser that allows the temperature to be forced to follow predefined temperature profiles.
Approach: Fast, multi-slice thermometric data are processed on the fly to achieved efficient volumetric temperature regulation of multiple laser sources simultaneously.
Results: We offer a precise and rapid volumetric temperature control solution combined with multi-source LITT to create conformal ablation volumes larger than those achieved with a single fiber.
Impact: Automatic volumetric temperature regulation of multisource LITT combined with real-time multislice MRI thermometry allows better control of local thermotherapies in soft tissues.
Introduction
MR-guided LITT is used for thermotherapy of various diseases (ie glioblastoma, prostate cancer)1. Current Laser devices use one or more fibers2 to create a coagulation necrosis. However, current clinical procedures apply a predefined laser power and duration and can result in insufficient or excessive heating in the targeted region. We present a multi-source laser device whose output power on each fiber is automatically adjusted during the ablation to force temperature to follow a predefine profile.Material & Methods
Real-time MRI thermometry pipeline: 8 slices of multi-slice single-shot echo planar sequence3 were acquired in coronal orientation every second during 500 s on a 1.5 T clinical scanner (Avanto, Siemens Healthineers) with the following parameters: TE=21 ms, FOV=158x158 mm², 3 mm thickness (1.2x1.2x3 mm3 voxel), FA = 60°, GRAPPA acceleration=2, bandwidth/pixel=1446 Hz. A 4-channel array coil and two elements of the spine coil (total of 12 channels) surrounded the sample (3% agar gel phantom) for image acquisition. Thermometry and thermal dose images were reconstructed in real time using the Gadgetron4 and were displayed online (Certis Solution (Certis Therapeutics, France).LITT device: Three 400 µm optical fibers ended with a glass diffuser tip were inserted into the phantom in a triangle configuration, with approximately 5mm spacing. Each fiber was connected to a programmable prototype laser unit (ALPhANOV, Talence, France) and powered by independent diode source (976 nm wavelength, maximum output power of 27 W). This laser unit was interfaced with the Gadgetron to dynamically update the output power on each diode at each new MR-temperature measurement.
Regulation algorithm: A temperature regulation algorithm was implemented in the Gadgetron to simultaneously control temperature evolution within the sample in three Regions of Interest (ROI) by automatically adjusting the outpout power Pi on each diode with i=[1,…, N], N being the number of laser sources (N=3 here). Input parameters of the algorithm are (1) the temperature-time profiles associated to (2) each 3x3 rectangular ROI centered on the hottest voxel around each fiber as well as (3) sample’s absorption, diffusion, perfusion and (4) characterization of laser source functions. To ensure convergence of experimental temperature toward targeted value, the controller integrates a proportional-integral-derivative (PID) algorithm incorporating the Bio-Heat Transfer Equation in the Fourier domain (Eq. 1) to facilitate its resolution with multiple laser sources and accelerate computation, as previously proposed5: $$$P_i\left(t\rightarrow t+\Delta t\right)=\frac{1}{\alpha}\left[\frac{\partial T_\left(t\right)}{\partial t}+{TF}^{-1}\left[Dk^2T_m^\ast\left(t\right)\right]+q\left[T_\left(t\right)-T_m\left(t\right)\right]+\frac{q^2}{4}\int_{0}^{\tau}\left[T_\left(t\right)-T_m\left(t\right)\right]d\tau\right]$$$ (Eq. 1)
where Tm*(t) is the Fourier transform over spatial coordinates of the incoming MR-temperature map and T(t) is the target temperature on each ROI. The parameter q ensures stable convergence toward 0 of the measured error (difference between target and the maximum temperature ) in each ROI.
Initialization shot: Before starting automatic temperature regulation, a constant laser power of 2.5W was applied during 30 seconds on each diode sequentially, with a cooling period of 100 seconds. The hottest voxel in the temperature image associated to each fiber was automatically detected and served as input for ROI definition. Curve fitting of the resulting temperature data with the BHTE equation was performed to estimate the absorption coefficient, the thermal diffusivity (D) and the source function Si characteristic. Automatic regulation: The regulation algorithm was run for 500s to automatically adjust in real time the power of each diode, after definition of desired target profiles for each fiber.
Results
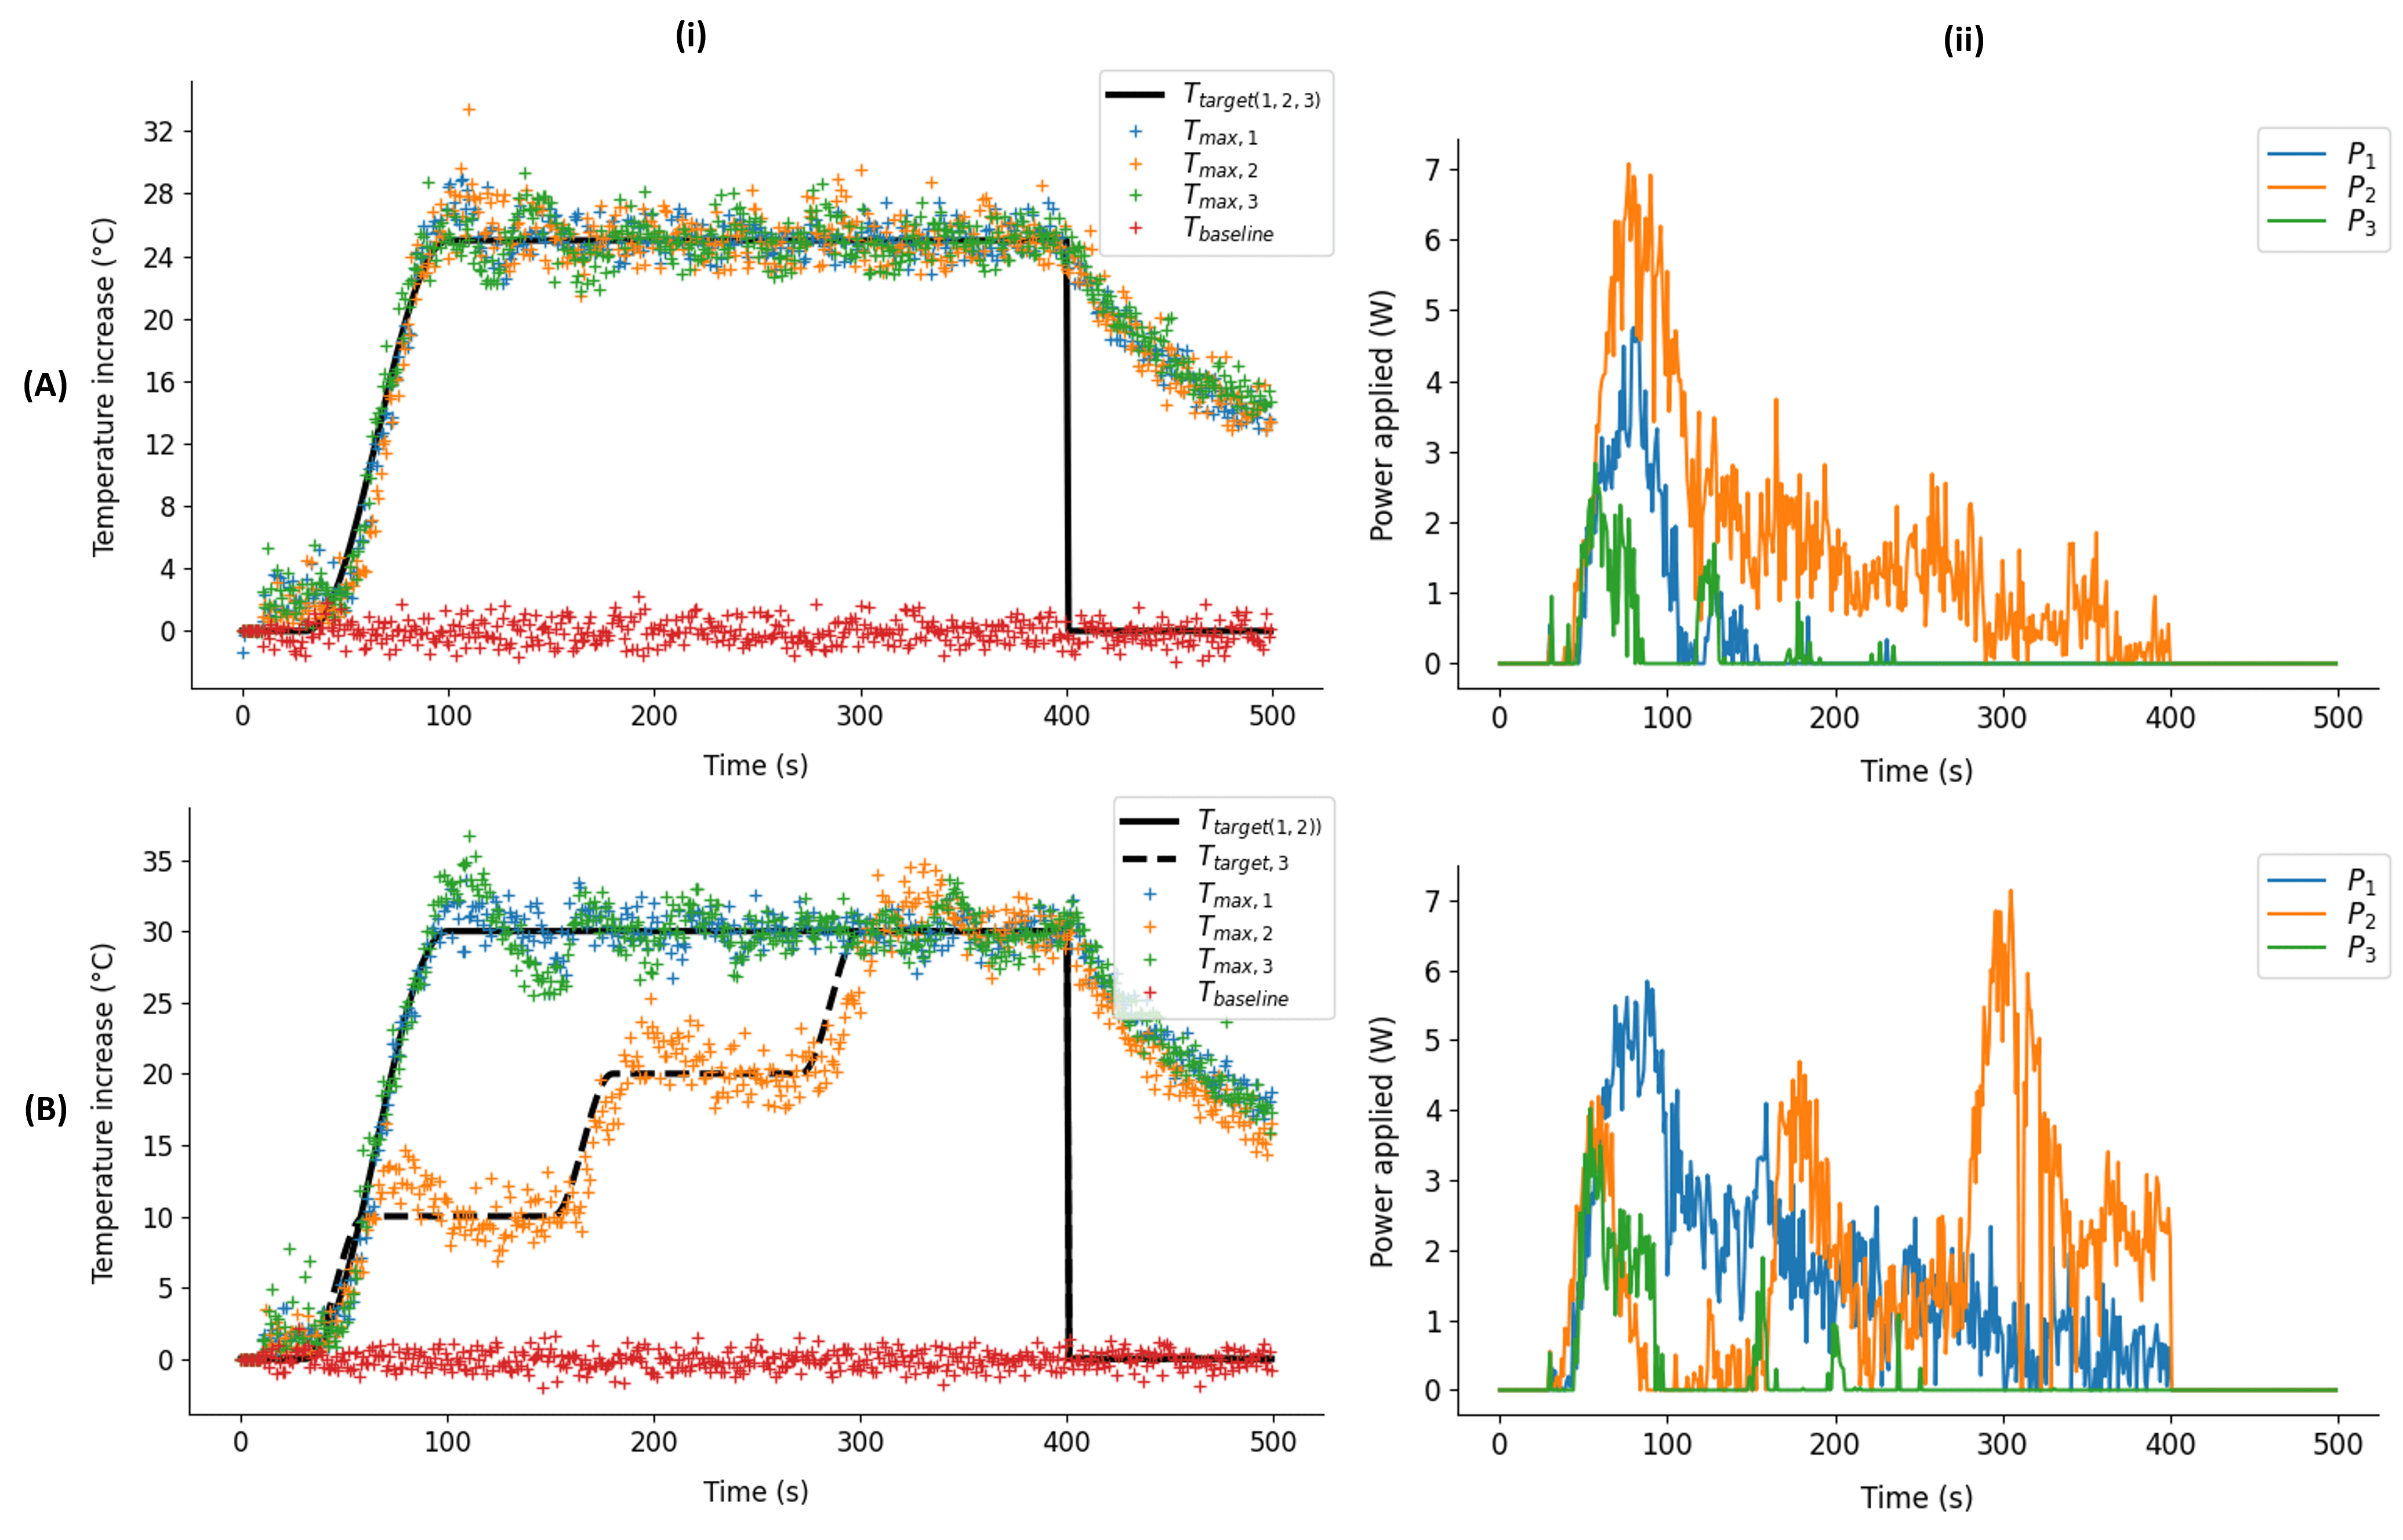
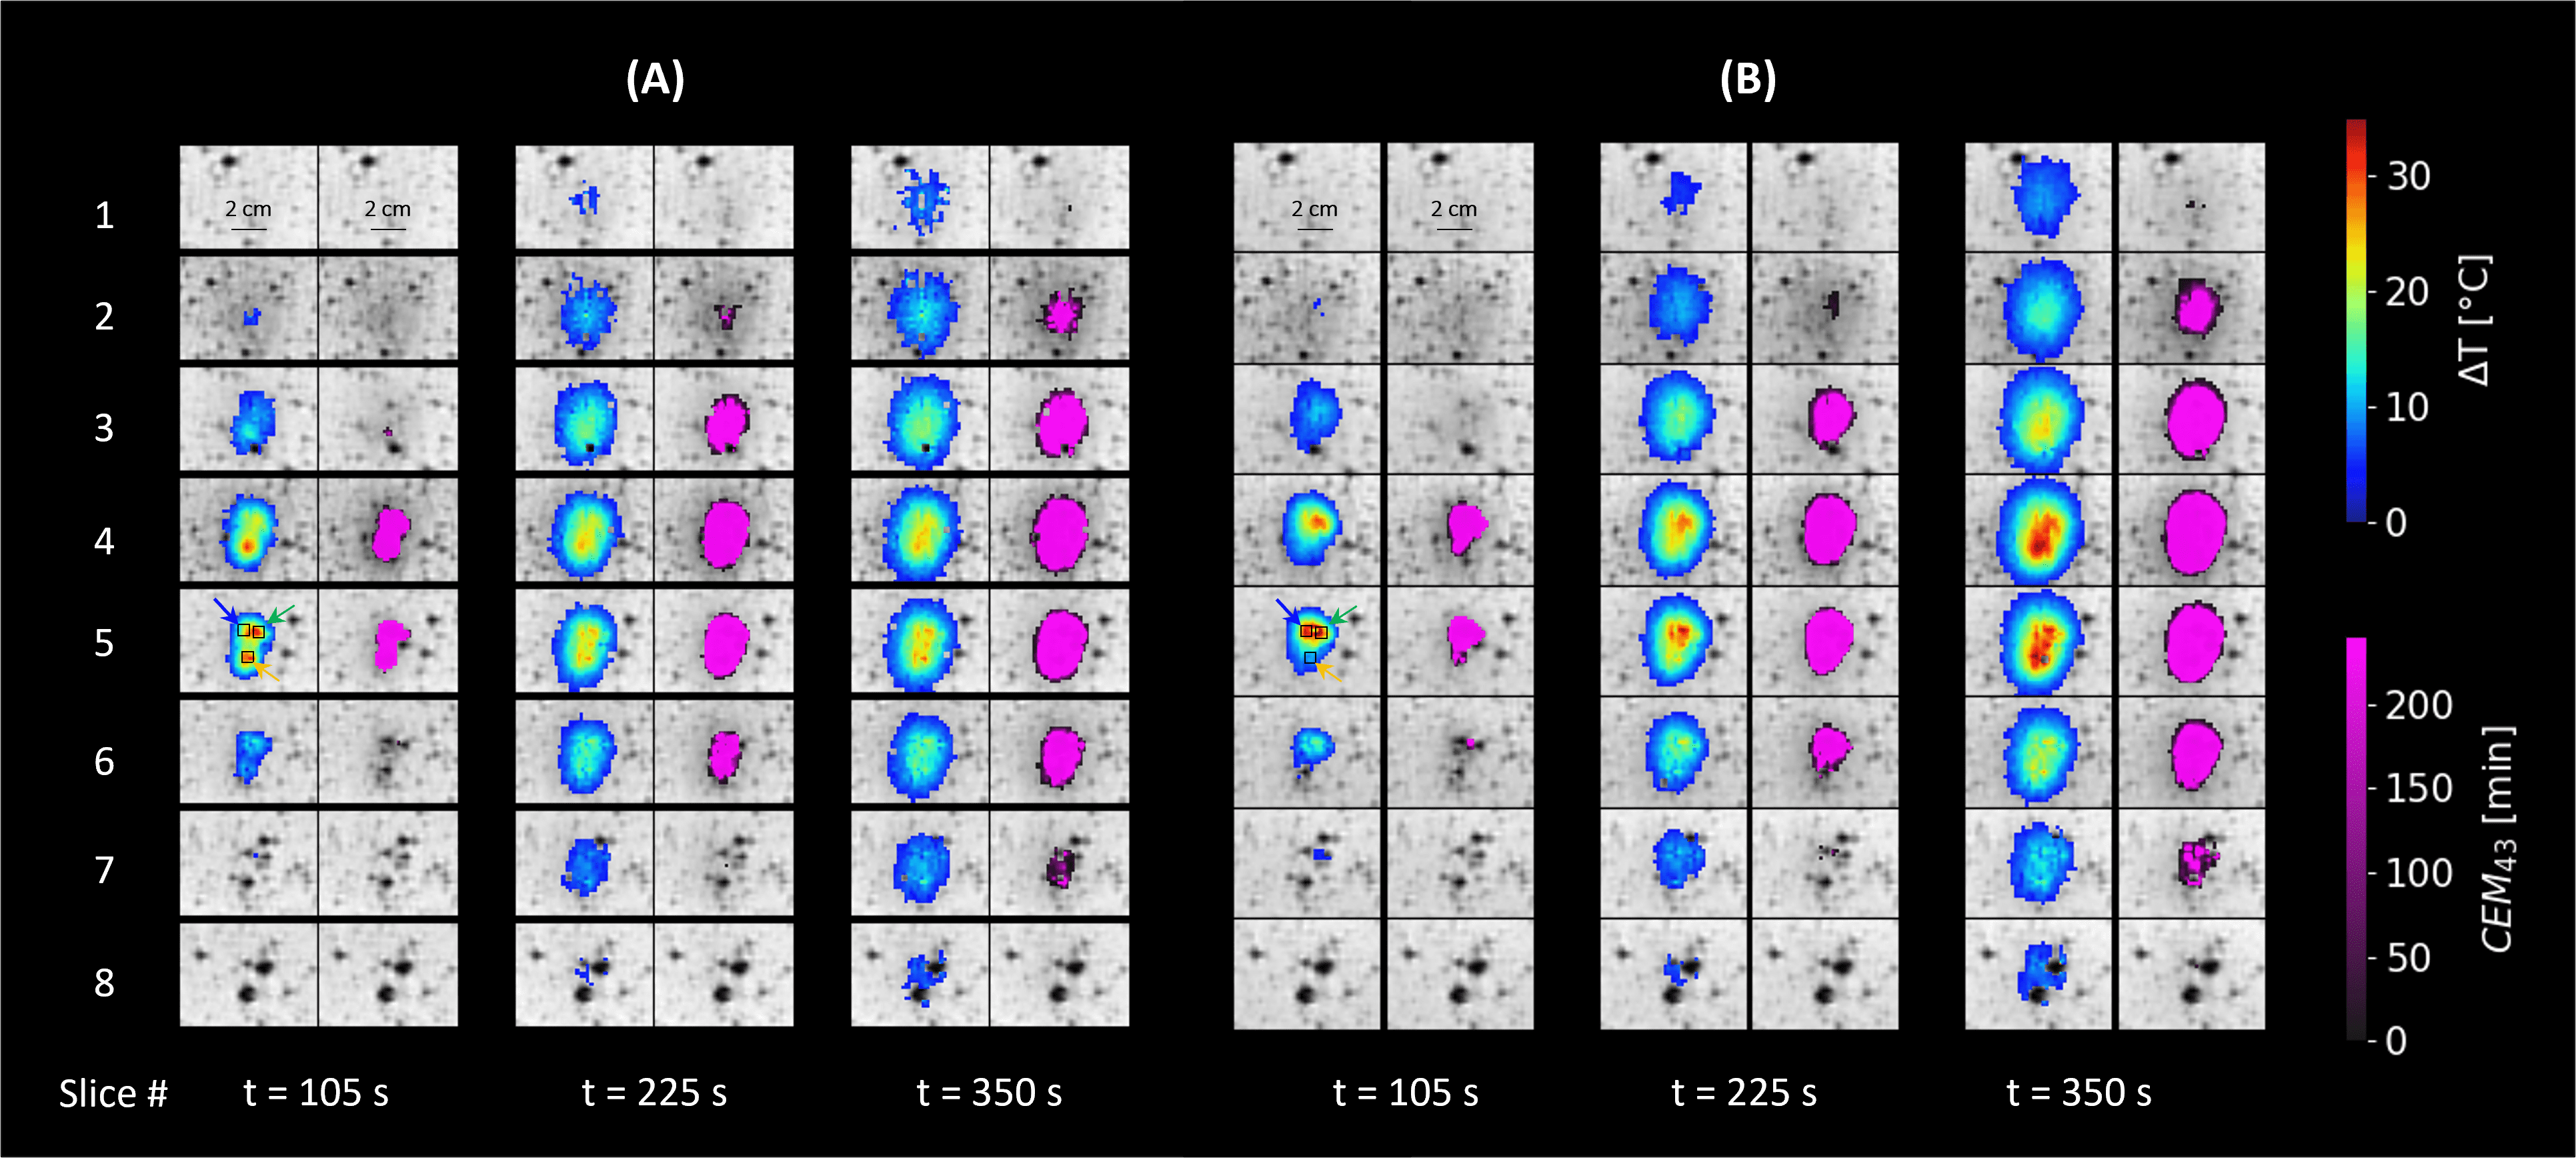
Figure 1 shows two examples of automatic temperature regulation with (A) an identical target heating profile applied to the 3 ROI; and (B) two different heating profiles: a single plateau at 30°C temperature increase applied on ROIs 1 and 3 and a target profile for the ROI 2 showing 3 plateaus (90s each) of 10°C, 20°C and 30°C temperature increase. Maximum temperature increases measured in each ROI are shown in graph (i), and power used for each diode is displayed in (ii). The mean difference (±σ) between target and experimental temperatures were [0.2±1.28°C, 0.08±1.72°C, 0.16±1.45°C] for ROIs #1, #2, #3 in Exp#A and [0.1±1.24°C, -0.3±2.13°C, 0.16±1.87°C] for ROIs #1, #2, #3 in Exp#B, respectively. Figure 2 shows the temperature and thermal dose images for all slices as a function of time, for experiments (A) and (B) presented in Fig. 1.Conclusion & Discussion
The proposed algorithm provides an accurate and rapid solution to control tissue temperature rise during multi-fiber LITT procedures, with the aim of creating larger ablation zones than those achieved with a single laser source. Such automatic multisource control may allow to produce conformable thermal lesion within soft tissue and to choose different targets profiles to avoid overheating critical tissues when necessary.Acknowledgements
No acknowledgement found.References
1. Schena, E., Saccomandi, P. & Fong, Y. Laser Ablation for Cancer: Past, Present and Future. JFB 8, 19 (2017).
2. R Laganà A, Di Lascio G, Di Blasi A, Licari LC, Tufano A,
Flammia RS, De
Carolis A. Ultrasound-guided SoracteLite™ transperineal laser
ablation (TPLA) of
the prostate for the treatment of symptomatic benign prostatic
hyperplasia
(BPH): a prospective single-center experience. World J Urol. (2023)
3. Ozenne, V. et al. Improved cardiac magnetic resonance thermometry and dosimetry for monitoring lesionformation during catheter ablation. Magn. Reson. Med. 77, 673–683 (2017).
4. Hansen, M. S. & Sørensen, T. S. Gadgetron: An open source framework for medical image reconstruction: Gadgetron. Magn. Reson. Med. 69, 1768–1776 (2013).
5. Quesson, B., Vimeux, F., Salomir, R., de Zwart, J. A. & Moonen, C. T. W. Automatic control of hyperthermic therapy based on real-time Fourier analysis of MR temperature maps. Magn. Reson. Med. 47, 1065–1072 (2002).
Figures