1276
Diffusion Tensor Imaging at 0.05 T1Laboratory of Biomedical Imaging and Signal Processing, The University of Hong Kong, Hong Kong, China, 2Department of Electrical and Electronic Engineering, The University of Hong Kong, Hong Kong, China
Synopsis
Keywords: DWI/DTI/DKI, Diffusion Tensor Imaging
Motivation: The employment of DTI in ULF MRI systems demonstrates considerable potential for examining microstructural variations in neuropathology and therapy. Although confronted with the inherent obstacle of low SNR at ULF, incorporating DTI yields an array of benefits. These advantages involve heightened accessibility, diminished costs, and superior patient care, while simultaneously extending the range of application possibilities for this crucial imaging modality throughout diverse healthcare contexts.
Goal(s): The implementation of DTI on an ULF MRI scanner.
Approach: DTI protocol was successfully implemented at 0.05 T.
Results: This study demonstrated the successful implementation of DTI protocol on an ULF MRI system.
Impact: This study explored the potential of a 0.05 T MRI system to increase MRI accessibility. Successful DTI implementation demonstrated the scanner's capacity to examine microstructural changes, highlighting its promising application in this field.
Introduction
Diffusion tensor imaging (DTI) serves as an essential technique in neuroscience for the investigation of microstructural modifications in biological tissues1–7. Despite its significance, the widespread adoption and accessibility of DTI have been impeded by the high costs associated with high-field MRI systems. In response to these challenges, ultra-low-field (ULF) MRI systems have emerged as a promising alternative8–12. However, the implementation of DTI on ULF MRI platforms presents distinct challenges, such as a diminished signal-to-noise ratio (SNR) and differences in hardware design and imaging parameters. In this study, we aim to evaluate the feasibility of integrating DTI on a 0.05 T ULF MRI system to demonstrate its potential in the analysis of microstructural changes. By successfully acquiring and assessing DTI data using the 0.05 T scanner, we seek to offer valuable insights into its capabilities and potential applications in examining neuropathologies and treatment responses.Theory and Method
In this study, the in vivo experiments were conducted using a 0.05 T permanent magnet MRI scanner, similar to the system utilized in previous works13–15. To obviate the need for radiofrequency (RF) shielding, employed with active electromagnetic interference (EMI) sensing and deep learning based EMI prediction and cancellation method16.In vivo experiments
The DTI scan protocol involved the use of a 2D spin-echo EPI with a pair of diffusion gradients. TR/TE = 2800/102 ms, acquisition matrix = 64 × 64, FOV = 250 × 250 mm2, acquisition slice thickness/slice gap = 10/0 mm, diffusion time/duration Δ/δ = 49/30 ms, and NEX = 52 for both b0 (no diffusion weighting) and b1 (diffusion weighting of 500 s/mm2) images. The total scan time was 15 minutes. All image reconstruction procedures were based on Fourier transform of fully sampled data. Before the scanning, linear shimming was carried out to optimize the magnetic field homogeneity. This was accomplished by adjusting the field strength of the scanner to achieve typical FID spectral full-width at half maximum (FWHM) and full width at tenth maximum (FWTM) values of around 20 Hz and 100 Hz, respectively. Data were denoised using block-matching and 4-D filtering and brain extraction was performed using FSL’s bet. The diffusion tensor was fit with least squares estimation using FSL’s dtifit17.
Results
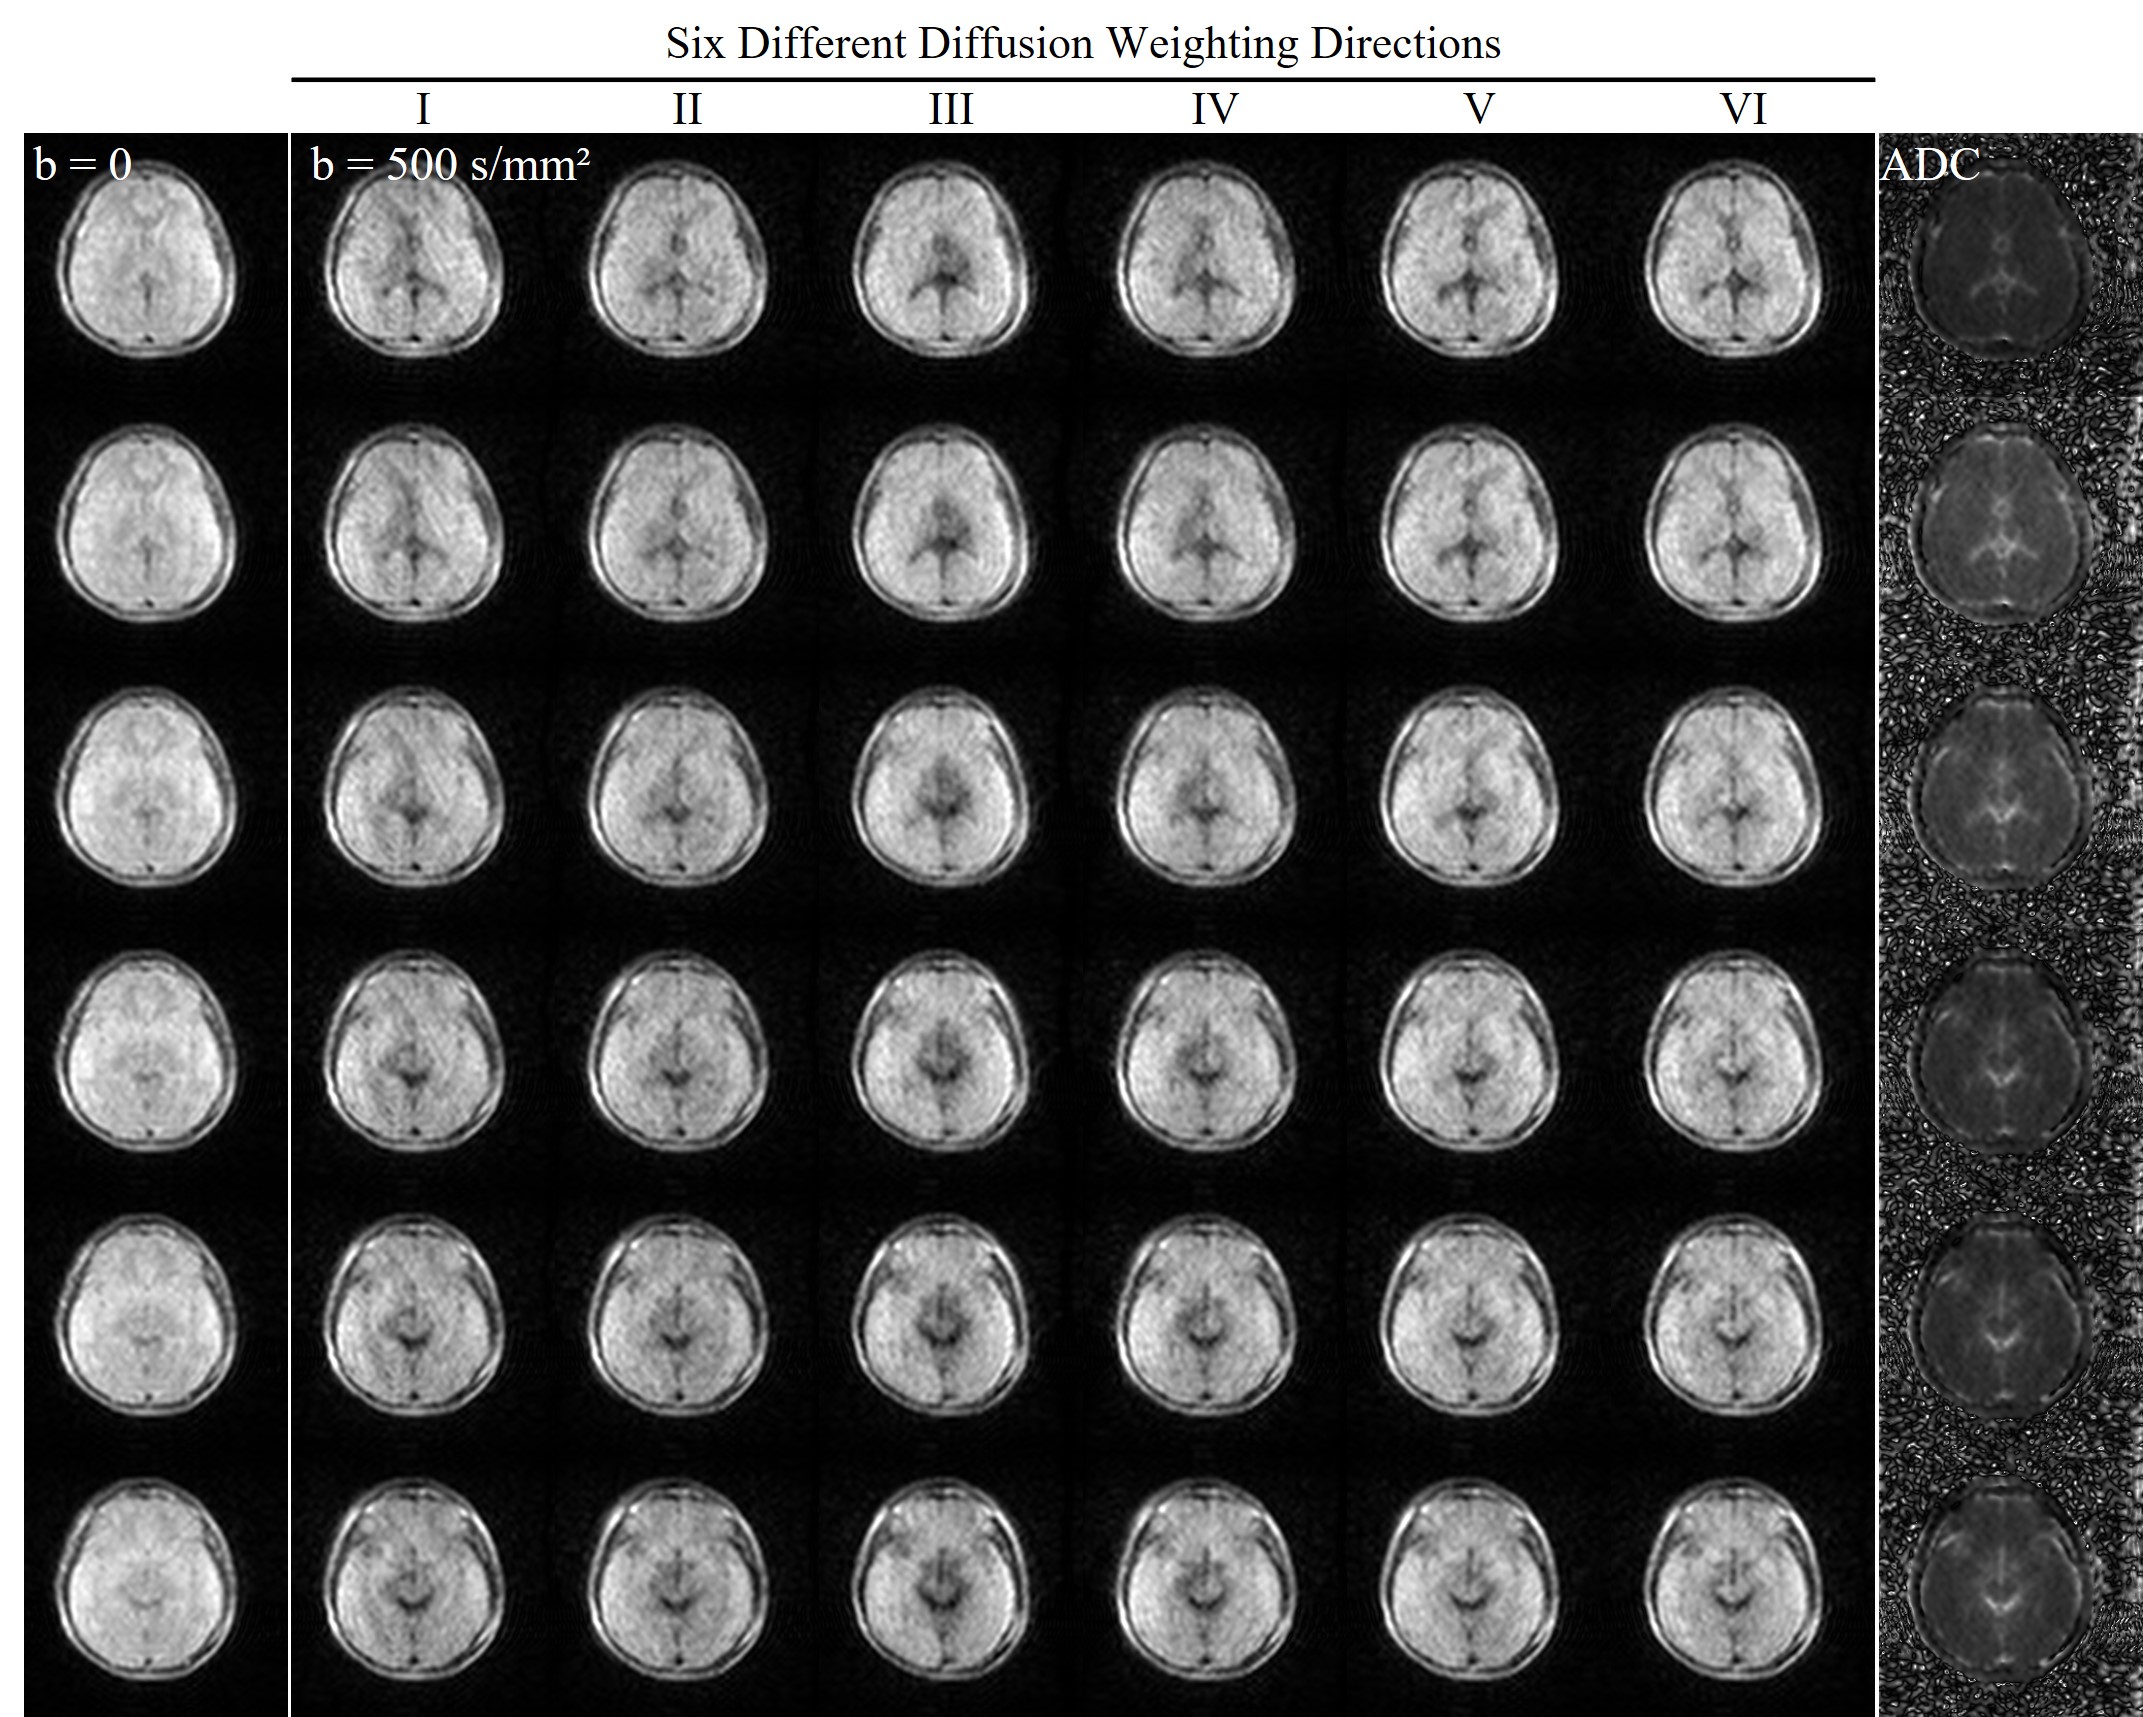
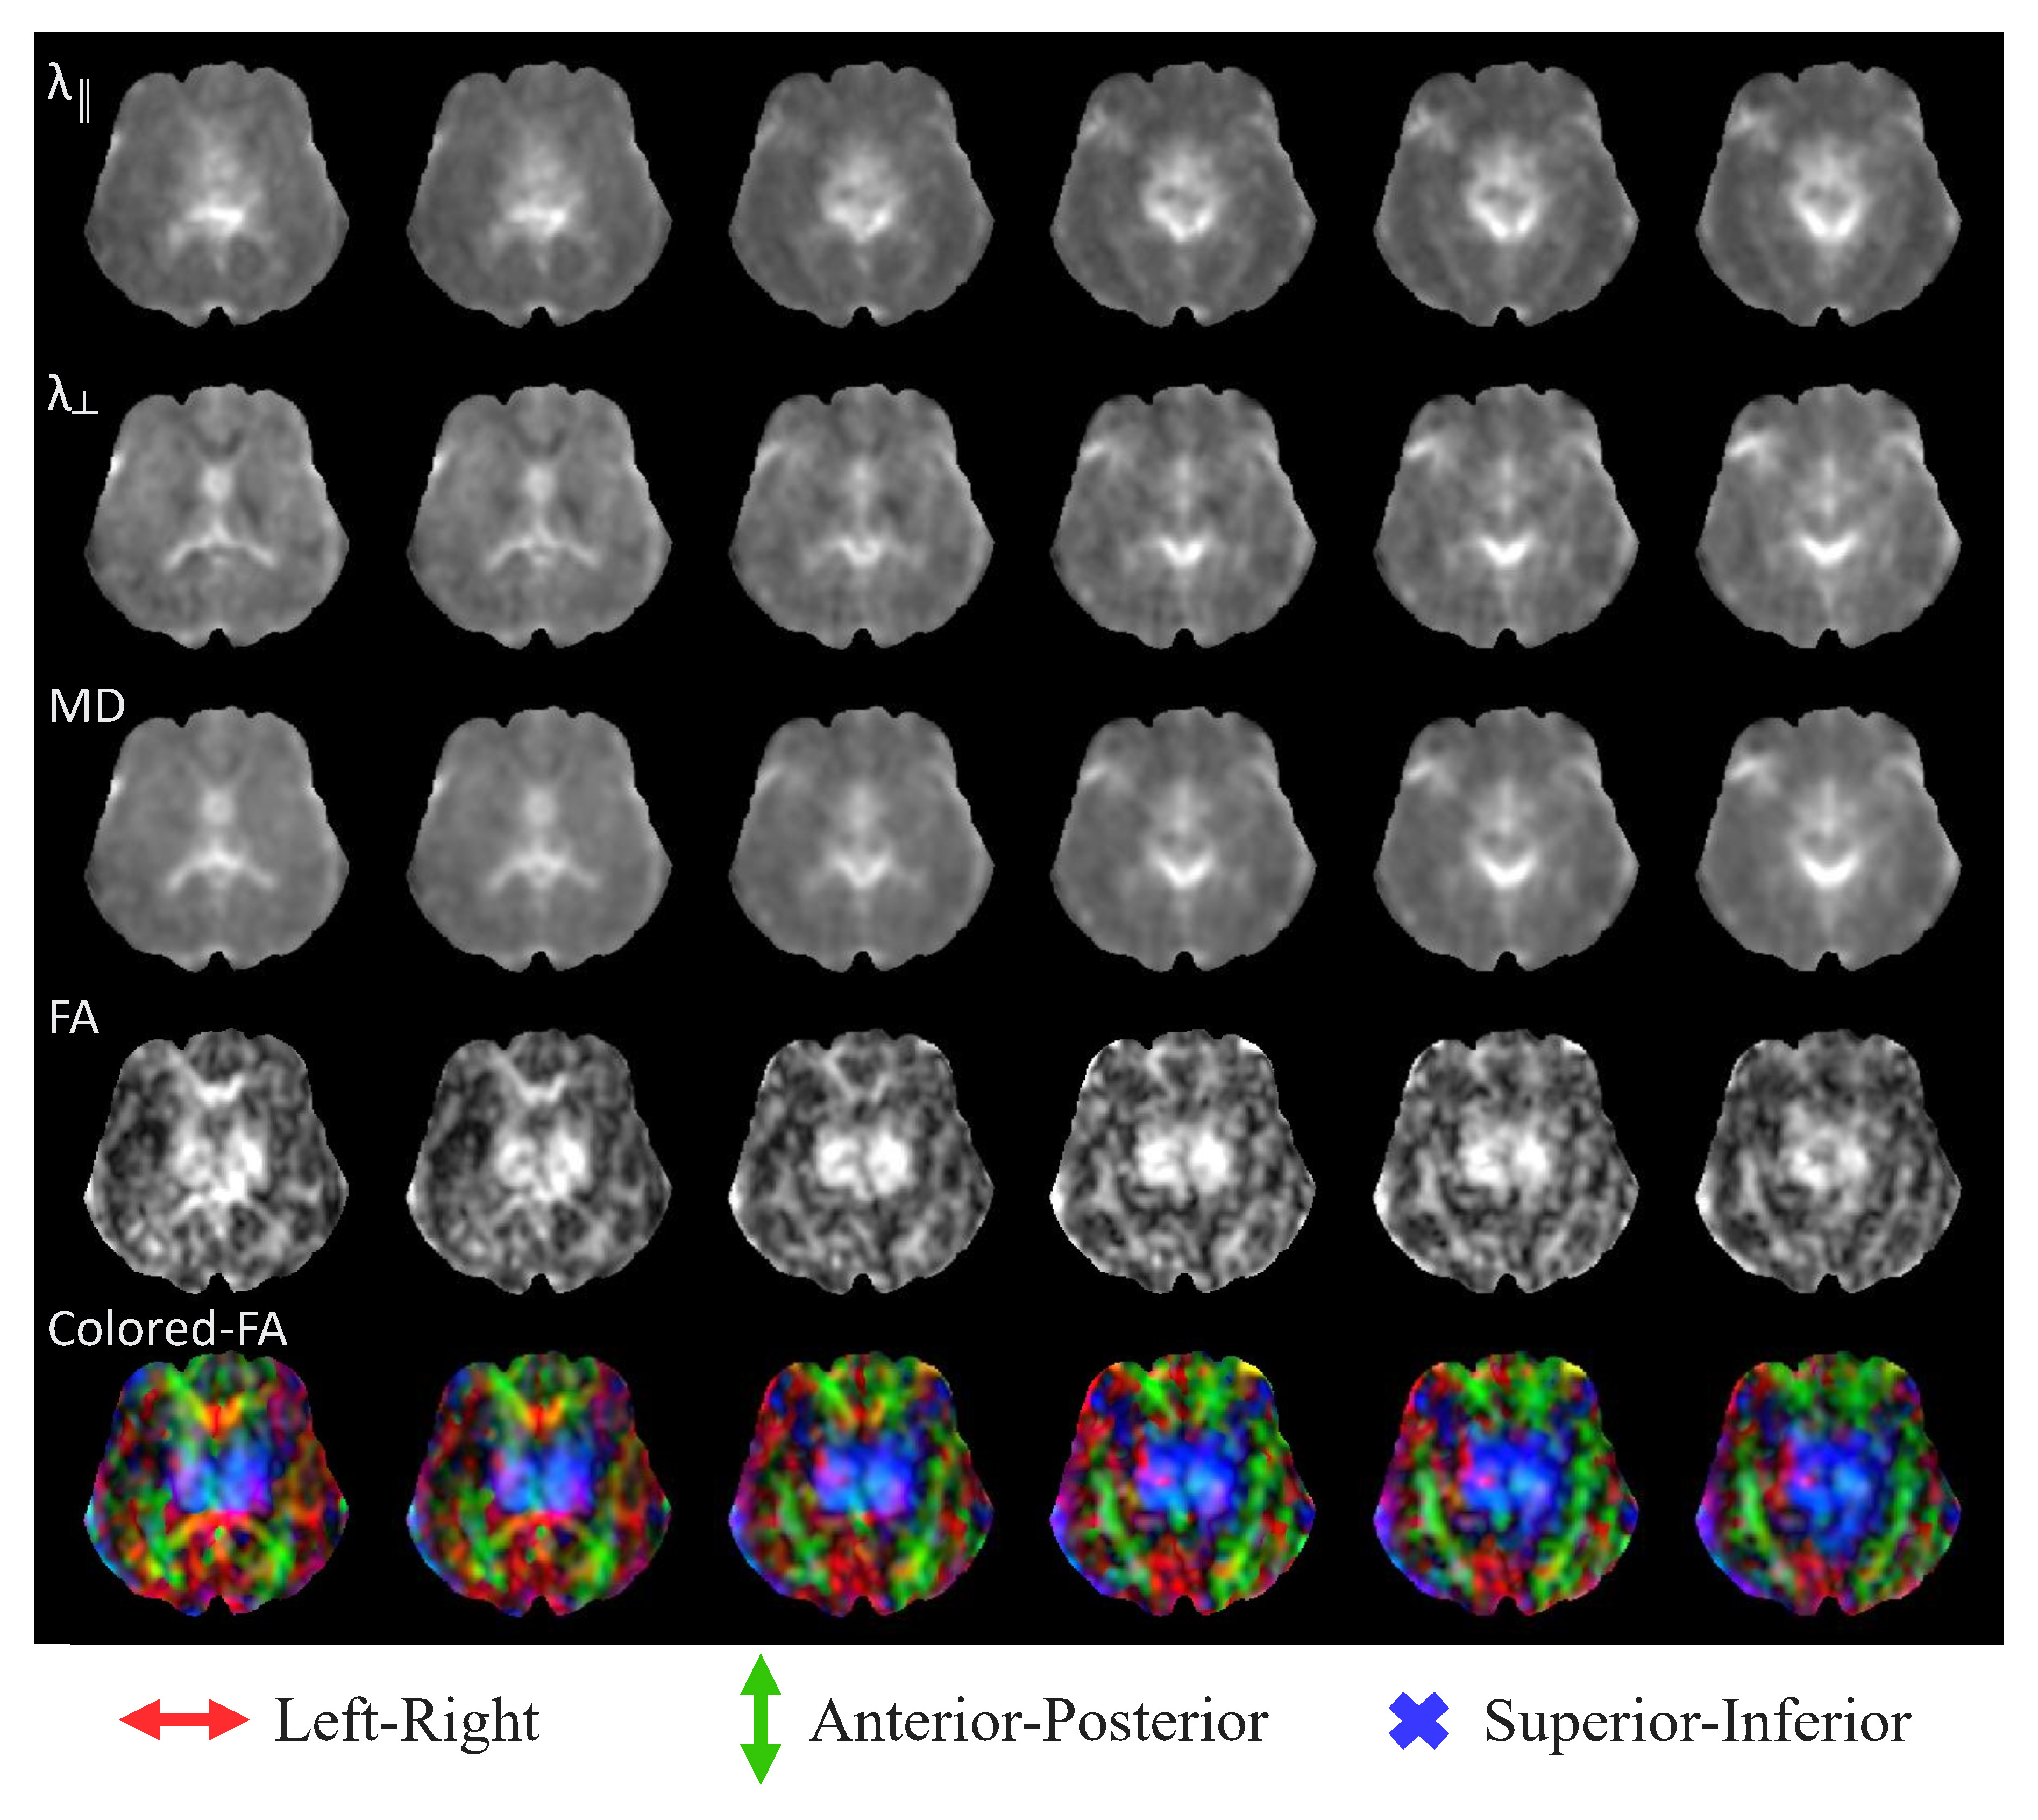
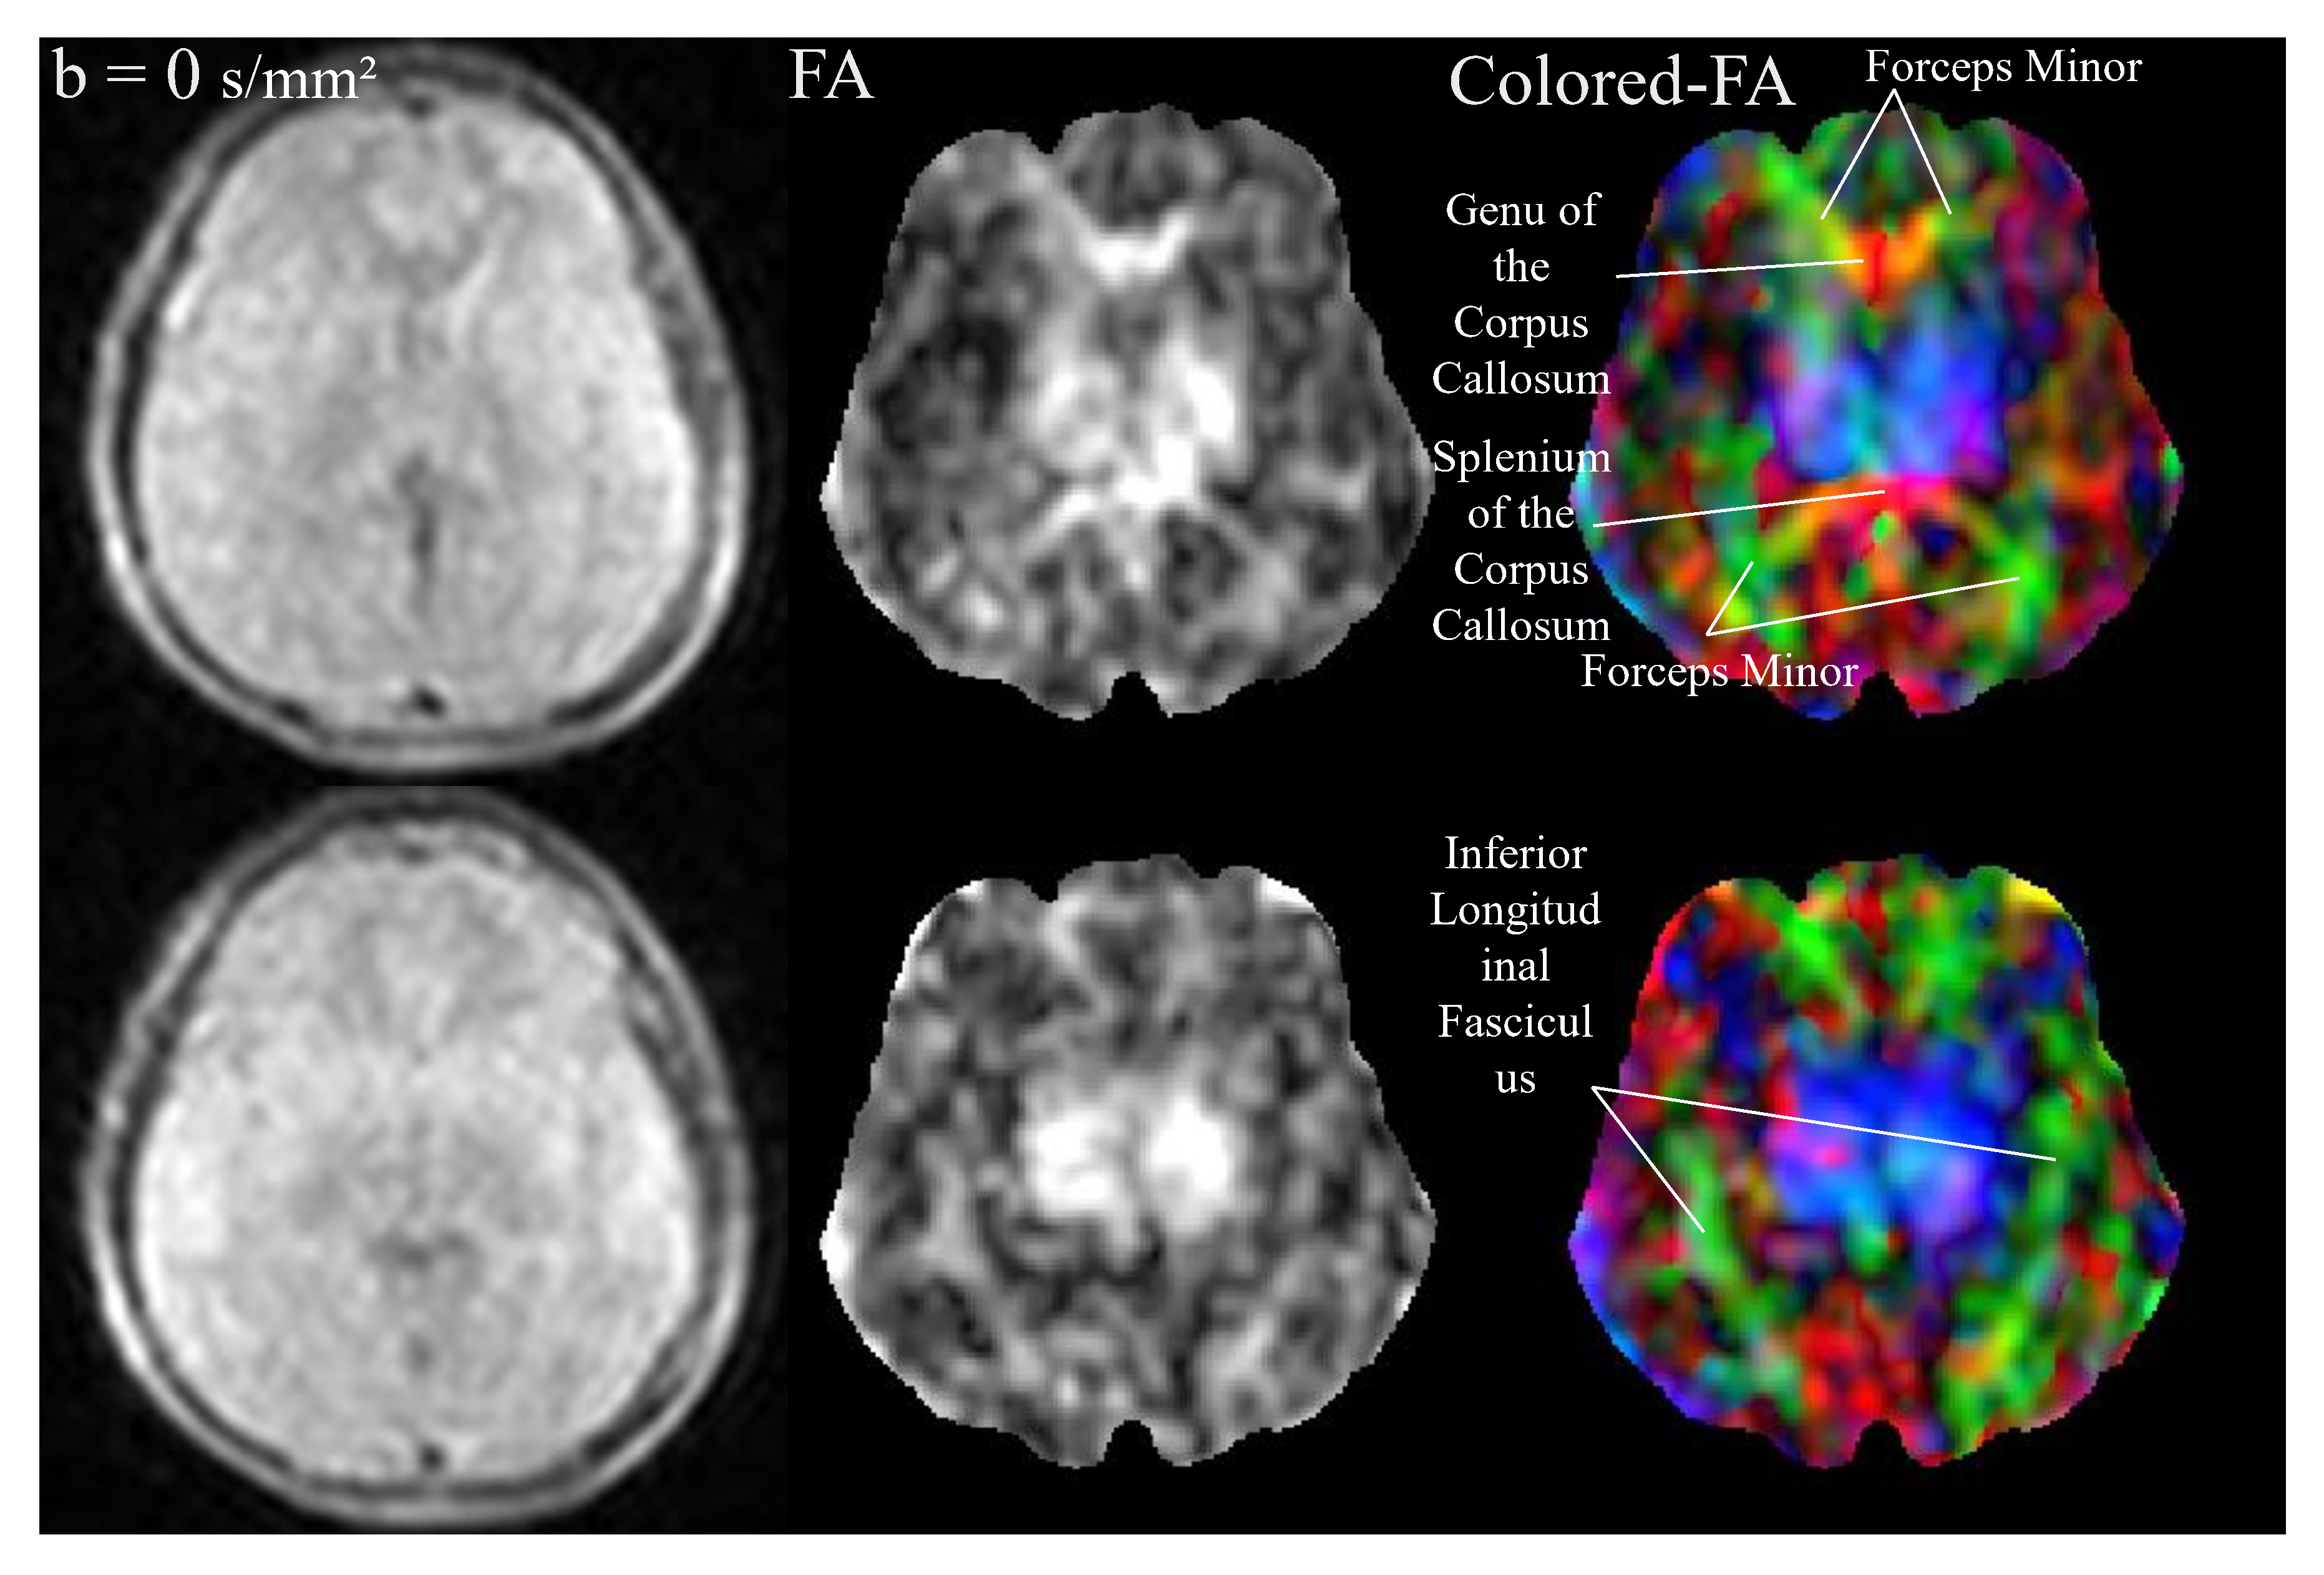
Fig.1 displays raw images including b-value = 0 images and six b-value = 500 s/mm2 diffusion-weighted images. Major tracts were clearly visible in all diffusion-weighted images. Fig.2 shows axial diffusivity, radial diffusivity, mean diffusivity, fractional anisotropy (FA), and colored-FA (principal eigenvector) maps. Fig.3 presents the visualization of cerebral white matter tracts using b-value = 0 FA and color-FA images. FA map offers insights into the directionality degree within the white matter. Axial DTI color maps exhibit labeled fiber tracts, enhancing the comprehension of the brain's structural connectivity.Discussion and Conclusions
To conclude, this study highlights the promising capabilities of diffusion tensor imaging (DTI) for examining the white matter structure within the human brain at ULF. Utilizing a 0.05 T system for DTI data acquisition and processing enabled the production of diffusion property maps, encompassing raw diffusion-weighted images, axial diffusivity, radial diffusivity, mean diffusivity, fractional anisotropy, and RGB (principal eigenvector) maps. These maps offer crucial information regarding the brain's white matter structural connectivity and diffusion features. The successful application of DTI on ultra-low field (ULF) MRI systems bears substantial importance for neuroscience research, particularly in exploring neuropathologies and treatment outcomes. The affordability and patient-friendly nature of ULF MRI systems render DTI more accessible to researchers working in resource-limited environments.Acknowledgements
This work was supported in part by Hong Kong Research Grant Council (R7003-19F, HKU17112120, HKU17127121, HKU17127022 and HKU17127523 to E.X.W).References
1.Shah G. Functional MRI and Diffusion Tensor Imaging. In: Moritani T, Capizzano AA, eds. Diffusion-Weighted MR Imaging of the Brain, Head and Neck, and Spine. Cham: Springer International Publishing; 2021:77-102. doi:10.1007/978-3-030-62120-9_6
2.Alexander AL, Lee JE, Lazar M, Field AS. Diffusion tensor imaging of the brain. Neurotherapeutics. 2007;4(3):316-329. doi:10.1016/j.nurt.2007.05.011
3.Conturo, T.E., Lori, N.F., Cull, T.S., Akbudak, E., Snyder, A.Z., Shimony, J.S., McKinstry, R.C., Burton, H. and Raichle, M.E., 1999. Tracking neuronal fiber pathways in the living human brain. Proceedings of the National Academy of Sciences, 96(18), pp.10422-10427.
4.Mori S, Crain BJ, Chacko VP, Van Zijl PCM. Three-dimensional tracking of axonal projections in the brain by magnetic resonance imaging. Annals of Neurology. 1999;45(2):265-269. doi:10.1002/1531-8249(199902)45:2<265::AID-ANA21>3.0.CO;2-3
5.Basser PJ, Mattiello J, LeBihan D. MR diffusion tensor spectroscopy and imaging. Biophysical Journal. 1994;66(1):259-267. doi:10.1016/S0006-3495(94)80775-1
6.Basser PJ, Mattiello J, Lebihan D. Estimation of the Effective Self-Diffusion Tensor from the NMR Spin Echo. Journal of Magnetic Resonance, Series B. 1994;103(3):247-254. doi:10.1006/jmrb.1994.1037
7.Mansfield P. REAL-TIME ECHO-PLANAR IMAGING BY NMR. British Medical Bulletin. 1984;40(2):187-190. doi:10.1093/oxfordjournals.bmb.a071970
8.Mazurek, M.H., Cahn, B.A., Yuen, M.M., Prabhat, A.M., Chavva, I.R., Shah, J.T., Crawford, A.L., Welch, E.B., Rothberg, J., Sacolick, L. and Poole, M., 2021. Portable, bedside, low-field magnetic resonance imaging for evaluation of intracerebral hemorrhage. Nature communications, 12(1), p.5119.
9.O’Reilly T, Teeuwisse WM, de Gans D, Koolstra K, Webb AG. In vivo 3D brain and extremity MRI at 50 mT using a permanent magnet Halbach array. Magnetic Resonance in Medicine. 2021;85(1):495-505. doi:10.1002/mrm.28396
10.He, Y., He, W., Tan, L., Chen, F., Meng, F., Feng, H. and Xu, Z., 2020. Use of 2.1 MHz MRI scanner for brain imaging and its preliminary results in stroke. Journal of Magnetic Resonance, 319, p.106829.
11.Cooley, C.Z., McDaniel, P.C., Stockmann, J.P., Srinivas, S.A., Cauley, S.F., Śliwiak, M., Sappo, C.R., Vaughn, C.F., Guerin, B., Rosen, M.S. and Lev, M.H., 2021. A portable scanner for magnetic resonance imaging of the brain. Nature biomedical engineering, 5(3), pp.229-239.
12.Sheth, K.N., Mazurek, M.H., Yuen, M.M., Cahn, B.A., Shah, J.T., Ward, A., Kim, J.A., Gilmore, E.J., Falcone, G.J., Petersen, N. and Gobeske, K.T., 2021. Assessment of brain injury using portable, low-field magnetic resonance imaging at the bedside of critically ill patients. JAMA neurology, 78(1), pp.41-47.
13.Man, C., Lau, V., Su, S., Zhao, Y., Xiao, L., Ding, Y., Leung, G.K., Leong, A.T. and Wu, E.X., 2023. Deep learning enabled fast 3D brain MRI at 0.055 tesla. Science Advances, 9(38), p.eadi9327.
14.Lau, V., Xiao, L., Zhao, Y., Su, S., Ding, Y., Man, C., Wang, X., Tsang, A., Cao, P., Lau, G.K. and Leung, G.K., 2023. Pushing the limits of low‐cost ultralow‐field MRI by dual‐acquisition deep learning 3D superresolution. Magnetic Resonance in Medicine.
15.Liu, Y., Leong, A.T., Zhao, Y., Xiao, L., Mak, H.K., Tsang, A.C.O., Lau, G.K., Leung, G.K. and Wu, E.X., 2021. A low-cost and shielding-free ultra-low-field brain MRI scanner. Nature communications, 12(1), p.7238.
16.Zhao Y, Xiao L, Liu Y, Leong AT, Wu EX. Electromagnetic interference elimination via active sensing and deep learning prediction for radiofrequency shielding‐free MRI. NMR in Biomedicine. May 2023:e4956. doi:10.1002/nbm.4956
17.Smith SM. Fast robust automated brain extraction. Human Brain Mapping. 2002;17(3):143-155. doi:10.1002/hbm.10062
Figures