1268
Enabling high SNR cardiac spin echo DTI with a Cima.X MR System featuring 200 mT/m maximum gradient strength1Cardiac Innovation Research Center, Heart Vascular and Thoracic Institute, Cleveland Clinic, Cleveland, OH, United States, 2Siemens Medical Solutions USA, Cleveland, OH, United States, 3Siemens Medical Solutions USA, Los Angeles, CA, United States, 4Cardiovascular Medicine, Heart Vascular and Thoracic Institute, Cleveland Clinic, Cleveland, OH, United States, 5Biomedical Engineering, Case Western Reserve and Cleveland Clinic, Cleveland, OH, United States, 6Imaging Institute, Cleveland Clinic, Cleveland, OH, United States
Synopsis
Keywords: DWI/DTI/DKI, Diffusion Tensor Imaging
Motivation: SNR and parameter map accuracy in cardiac DTI are limited by maximum gradient strength related to motion-compensation and diffusion encoding time, precluding evaluation of helical cardiomyocyte structure.
Goal(s): Our goal was to improve SNR and cardiac DTI tissue microstructure characterization using an MR system capable of 200mT/m maximum gradient strength.
Approach: DTI was performed in human and swine subjects using standard (40mT/m), performance (80mT/m), and ultra-high-performance (200mT/m) maximum gradient strengths, with zeroth, first, and second-order motion compensating gradients.
Results: SNR and DTI tissue characterization were improved with ultra-high-performance gradients, however second-order motion compensation continued to be required to prevent motion artifacts.
Impact: Ultra-high performance 200mT/m gradients enable high SNR cardiac DTI with improved characterization of helical cardiomyocytes, potentially addressing the clinical need for noninvasive cardiac microstructure evaluation.
Purpose
Breathing and cardiac motion pose significant challenges in diffusion tensor cardiac magnetic resonance (DT-CMR). While diffusion weighted (DW) acquisitions employing traditional (M0) and first-order (M1) motion-compensating diffusion gradients suffer from motion-related signal dropout, second-order (M2) motion-compensating diffusion gradients enable quality spin echo DT-CMR1,2. However, increasing motion compensation results in increased diffusion time and TE, corresponding to increased opportunity for motion during diffusion encoding and decreased signal to noise ratio (SNR). With the introduction of an MR system capable of 200mT/m maximum gradient strength, reduction in TE is possible, resulting in restored SNR and improved DT-CMR. Reduced diffusion time is also possible, which may enable the use of lower order motion compensation. In this work, DT-CMR data acquired using clinical standard (STD), performance (P), and ultra-high-performance (UHP) maximum gradient strengths are compared as are the effects of zeroth (M0), first (M1), and second (M2) order motion compensation at UHP gradient strengths.Methods
DT-CMR was performed in 15 healthy volunteers, 1 pericarditis patient, and 1 swine subject 8 weeks post-myocardial infarction (MI) under IRB and IACUC approved protocols on a 3T MR system (MAGNETOM Cima.X, Siemens Healthineers AG, Erlangen, Germany) capable of 200mT/m maximum gradient strength (free-breathing 2DRF zoomed diffusion prepared spin echo2, 350mm FOV, 128x48 matrix, TR=500ms, 12 diffusion directions, b0=50s/mm2, b=500s/mm2, 8 averages, end systole, human subjects: five 8-mm slices, swine subject: six 5-mm slices). Human subjects were scanned using five DTI protocols: STD-M2 (Gmax=40mT/m, TE=122ms), P-M2 (Gmax=80mT/m, TE=79ms), UHP-M2 (Gmax=200mT/m, TE=59ms), UHP-M0 (Gmax=200mT/m, TE=40ms), UHP-M1 (Gmax=200mT/m, TE=54ms). The swine subject was scanned using three DTI protocols (STD-M2, P-M2, and UHP-M2) and slice-matched late gadolinium enhancement (LGE) imaging was performed.Respiratory motion correction of DW images was achieved with MT-MOCO2. DTI analysis yielding mean diffusivity (MD), fractional anisotropy (FA), and helix angle (HA) maps was performed using a custom python library. Manual segmentations of the left ventricle (LV) were used to calculate mean MD, FA, and helix angle transmurality (HAT). SNR in DW images was calculated in the LV using a modified NEMA method 13. Paired t-tests were performed to test for significant differences between acquisition methods, with significance defined as p<0.05.
Results
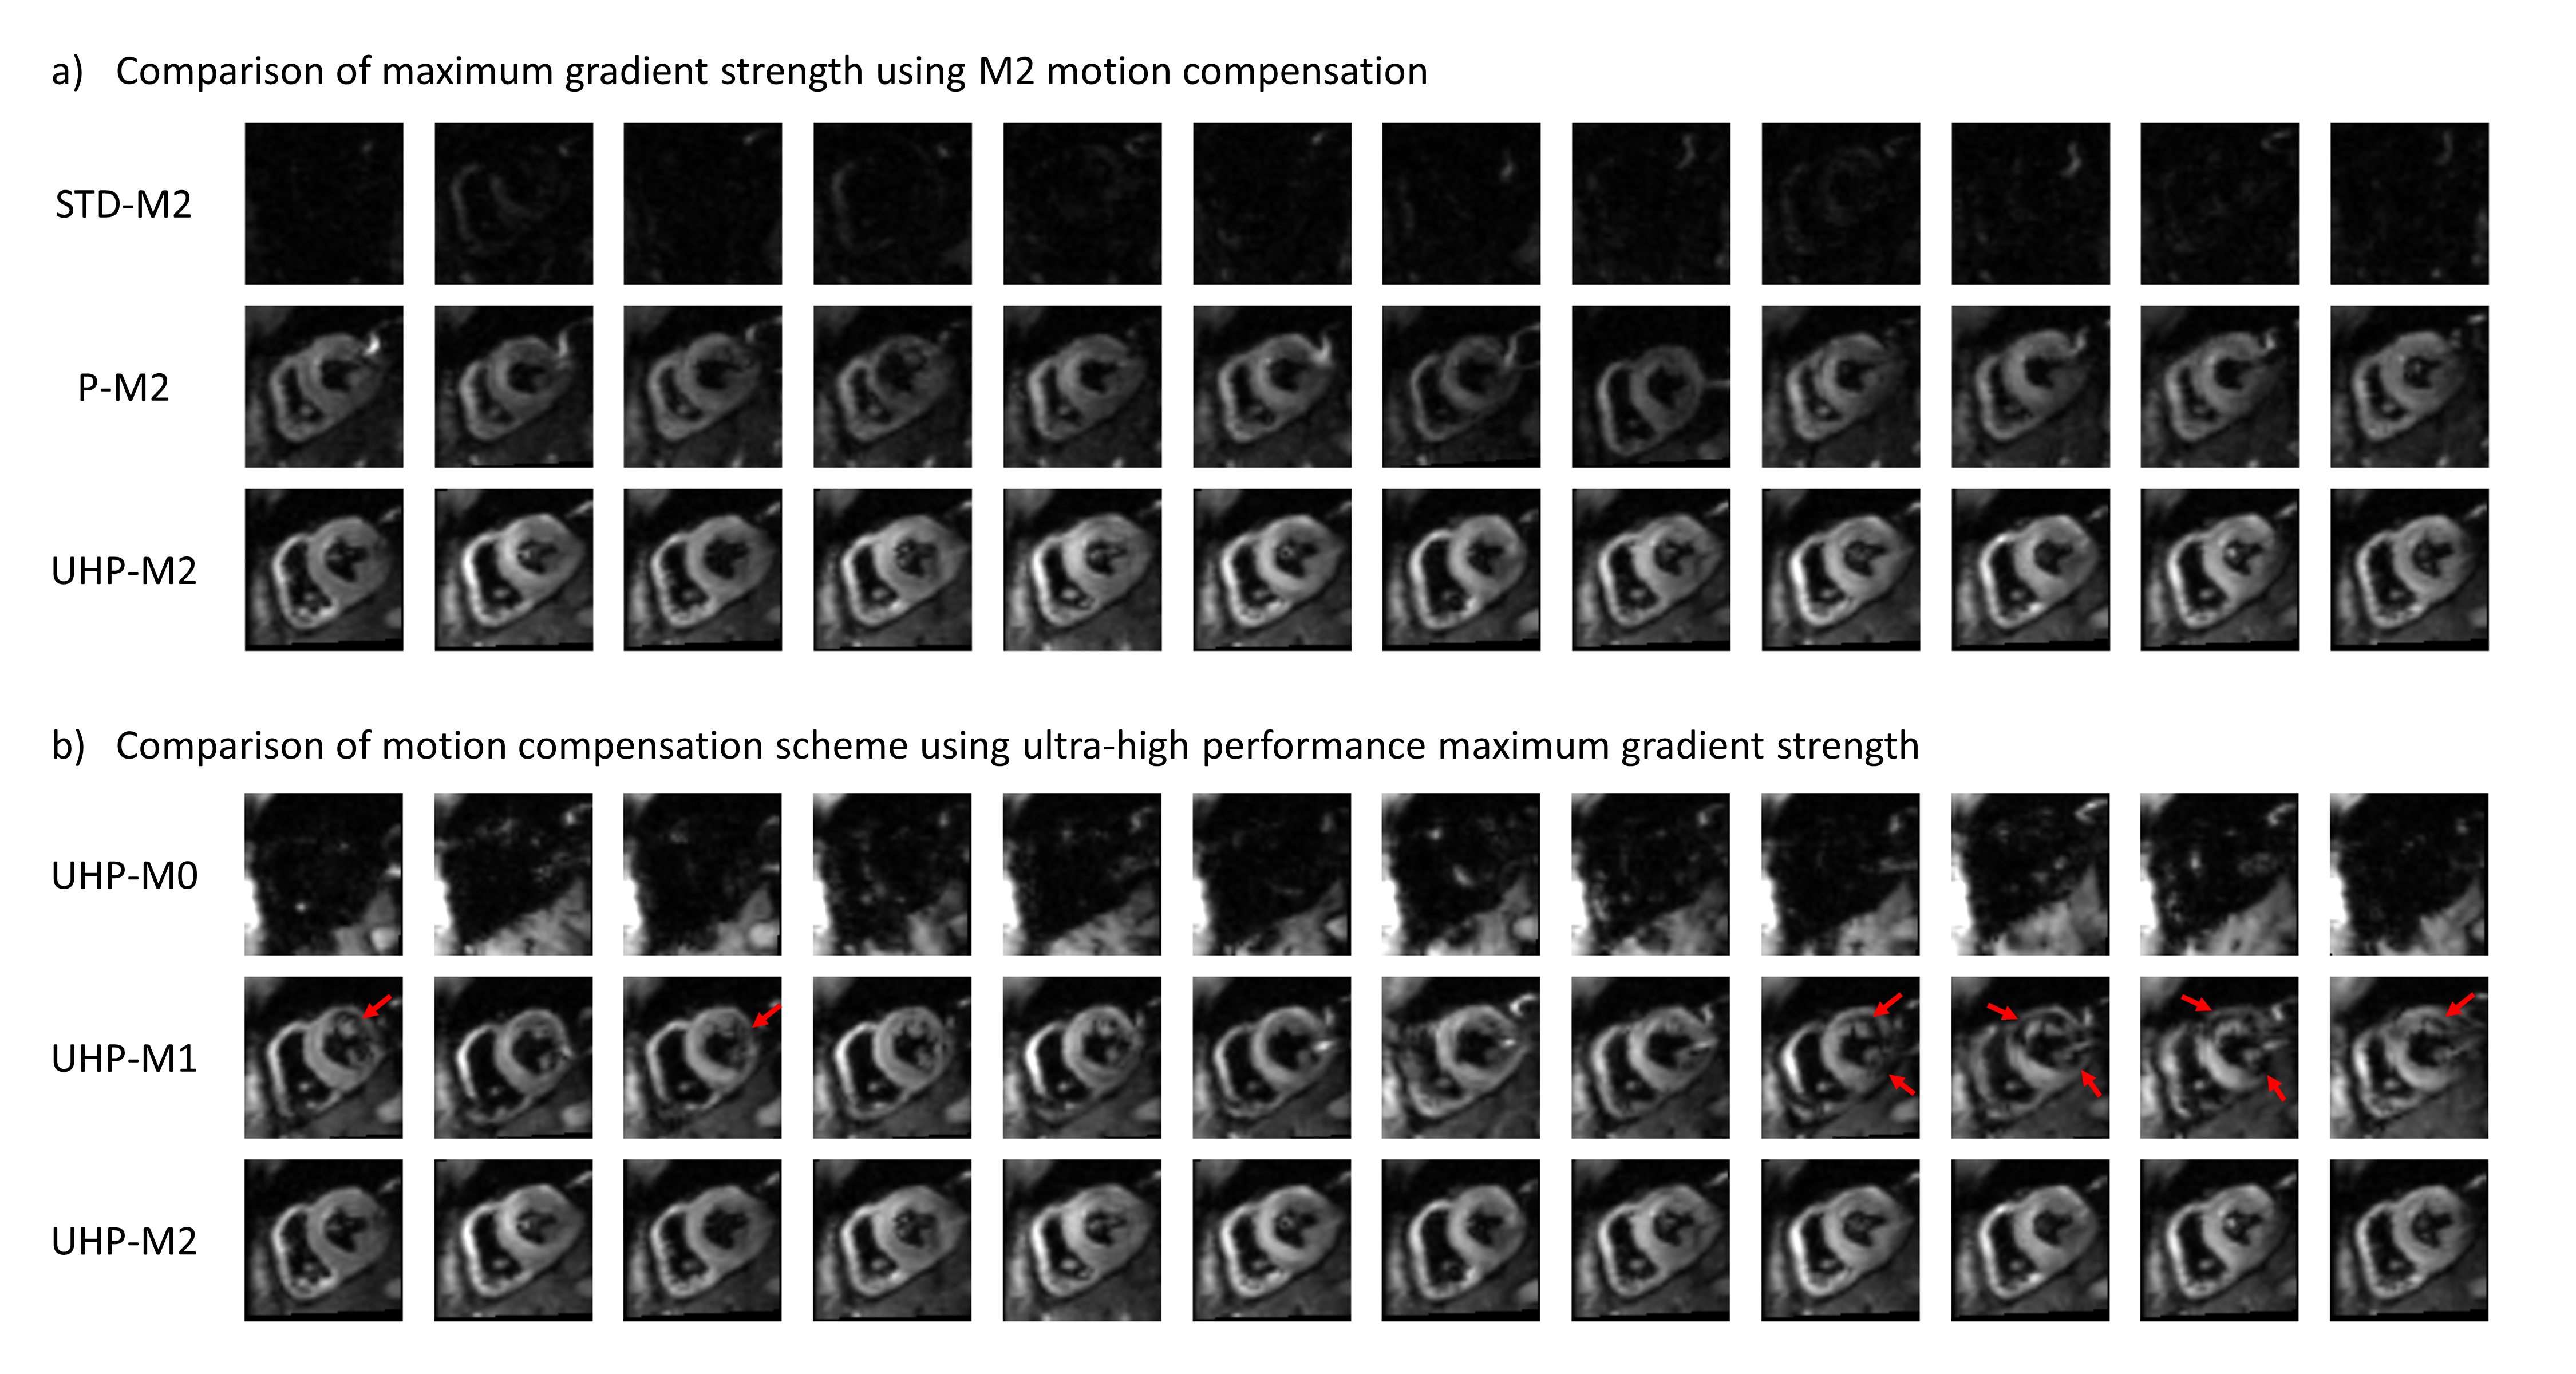
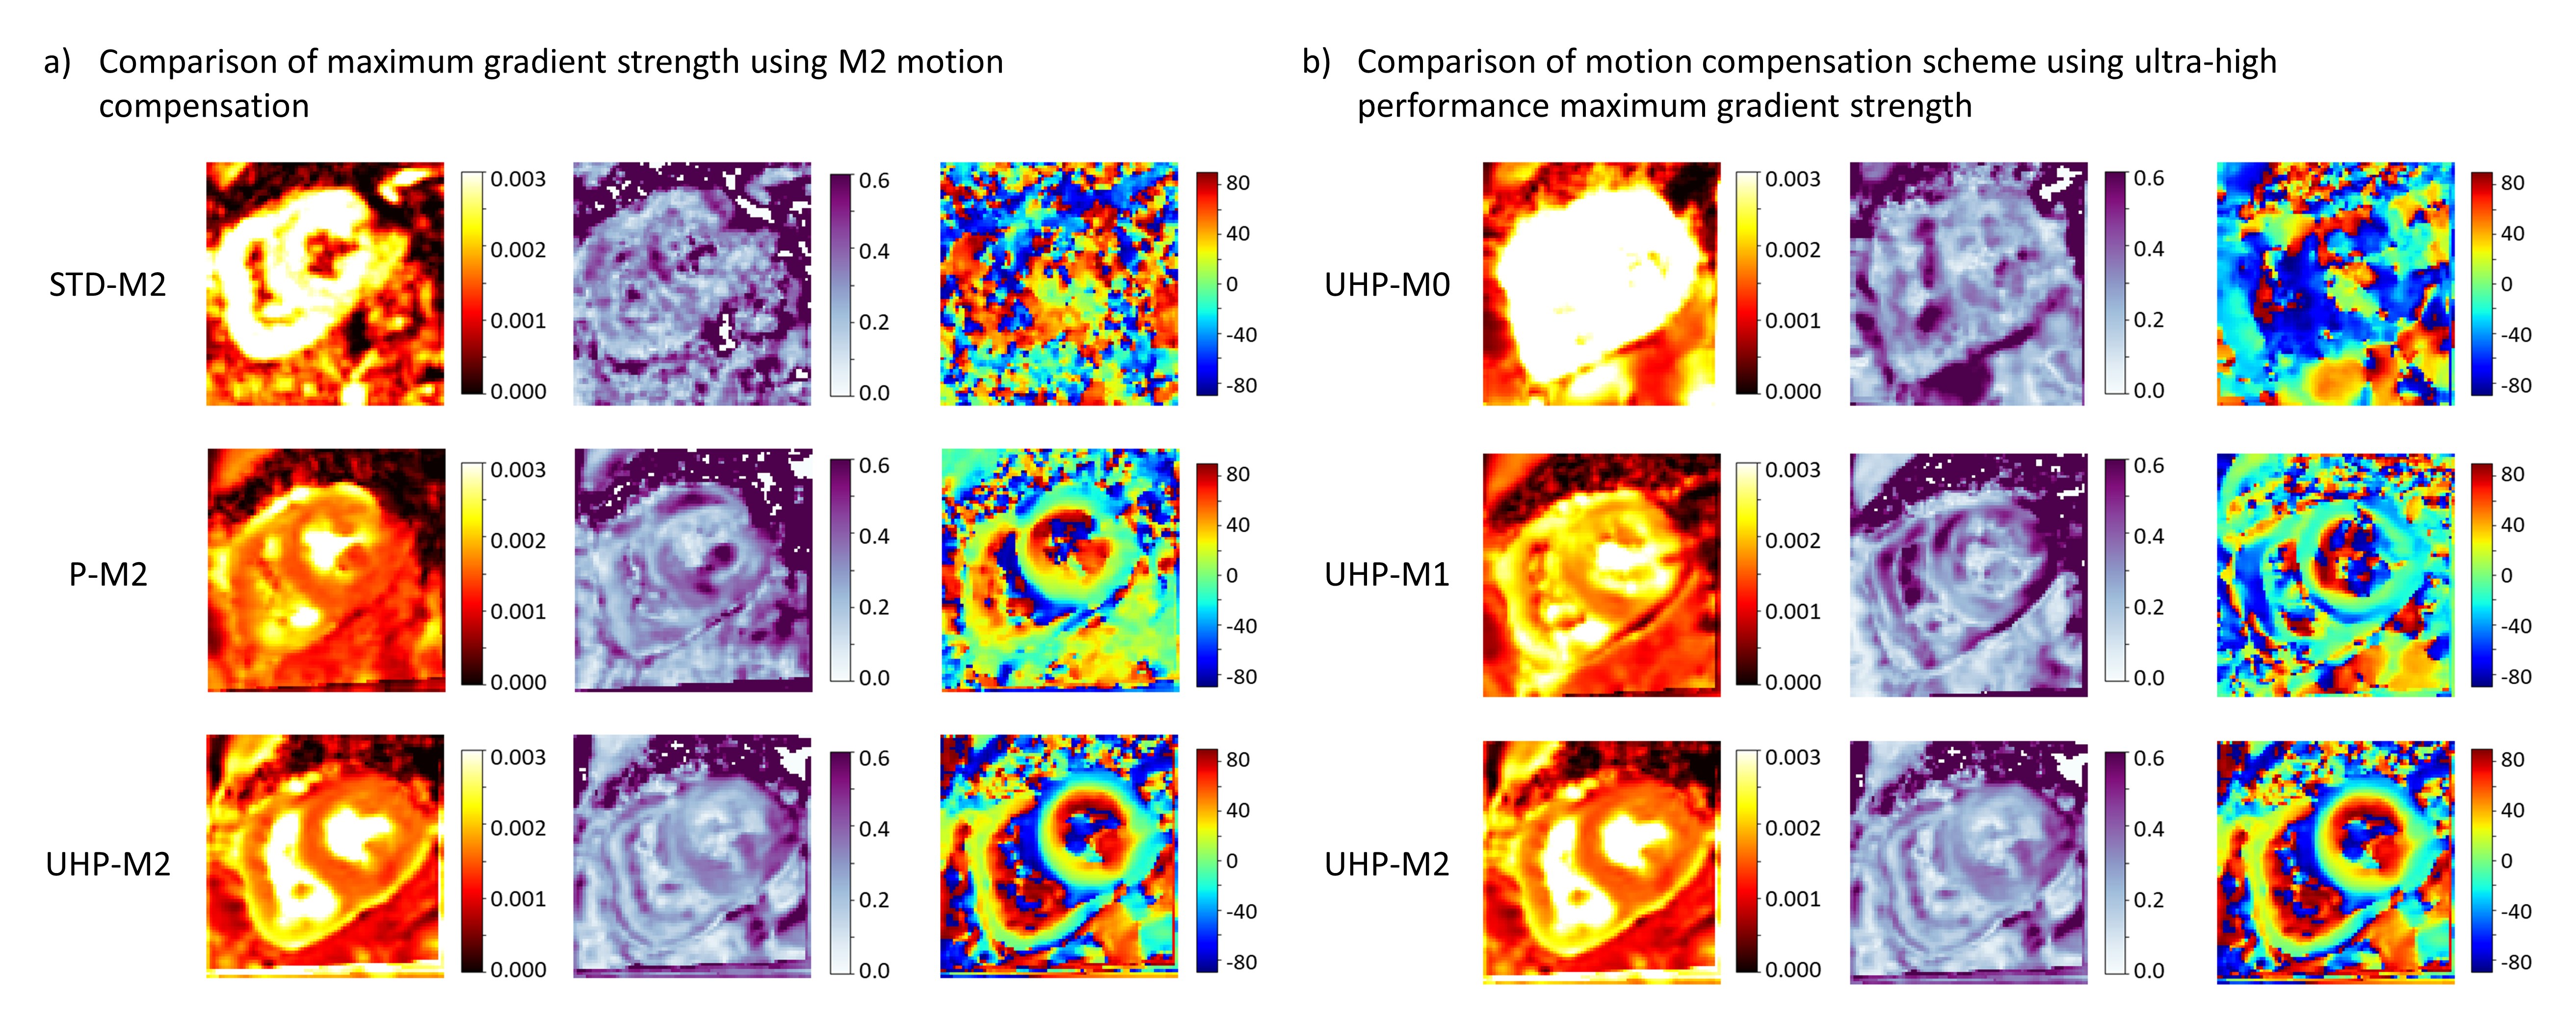
Figure 1 shows DW images from a representative volunteer. UHP-M2 images are observed to have superior signal intensity, while STD-M2 and UHP-M0 images have significantly reduced signal due to long TE and motion-induced dropout, respectively. UHP-M1 images also exhibit motion-induced dropout, as indicated by red arrows.Figure 2 shows MD, FA, and HA maps from a representative healthy volunteer. STD-M2 and UHP-M0 maps are extremely poor quality with almost no helix structure. Signal dropout in UHP-M1 data results in deviations from the expected right-to-left-handed helical structure of the LV in the HA map. While P-M2 and UHP-M2 maps demonstrate the expected decreasing transition in HA from endocardium to epicardium, the transition is smoother and better defined for UHP-M2 data.
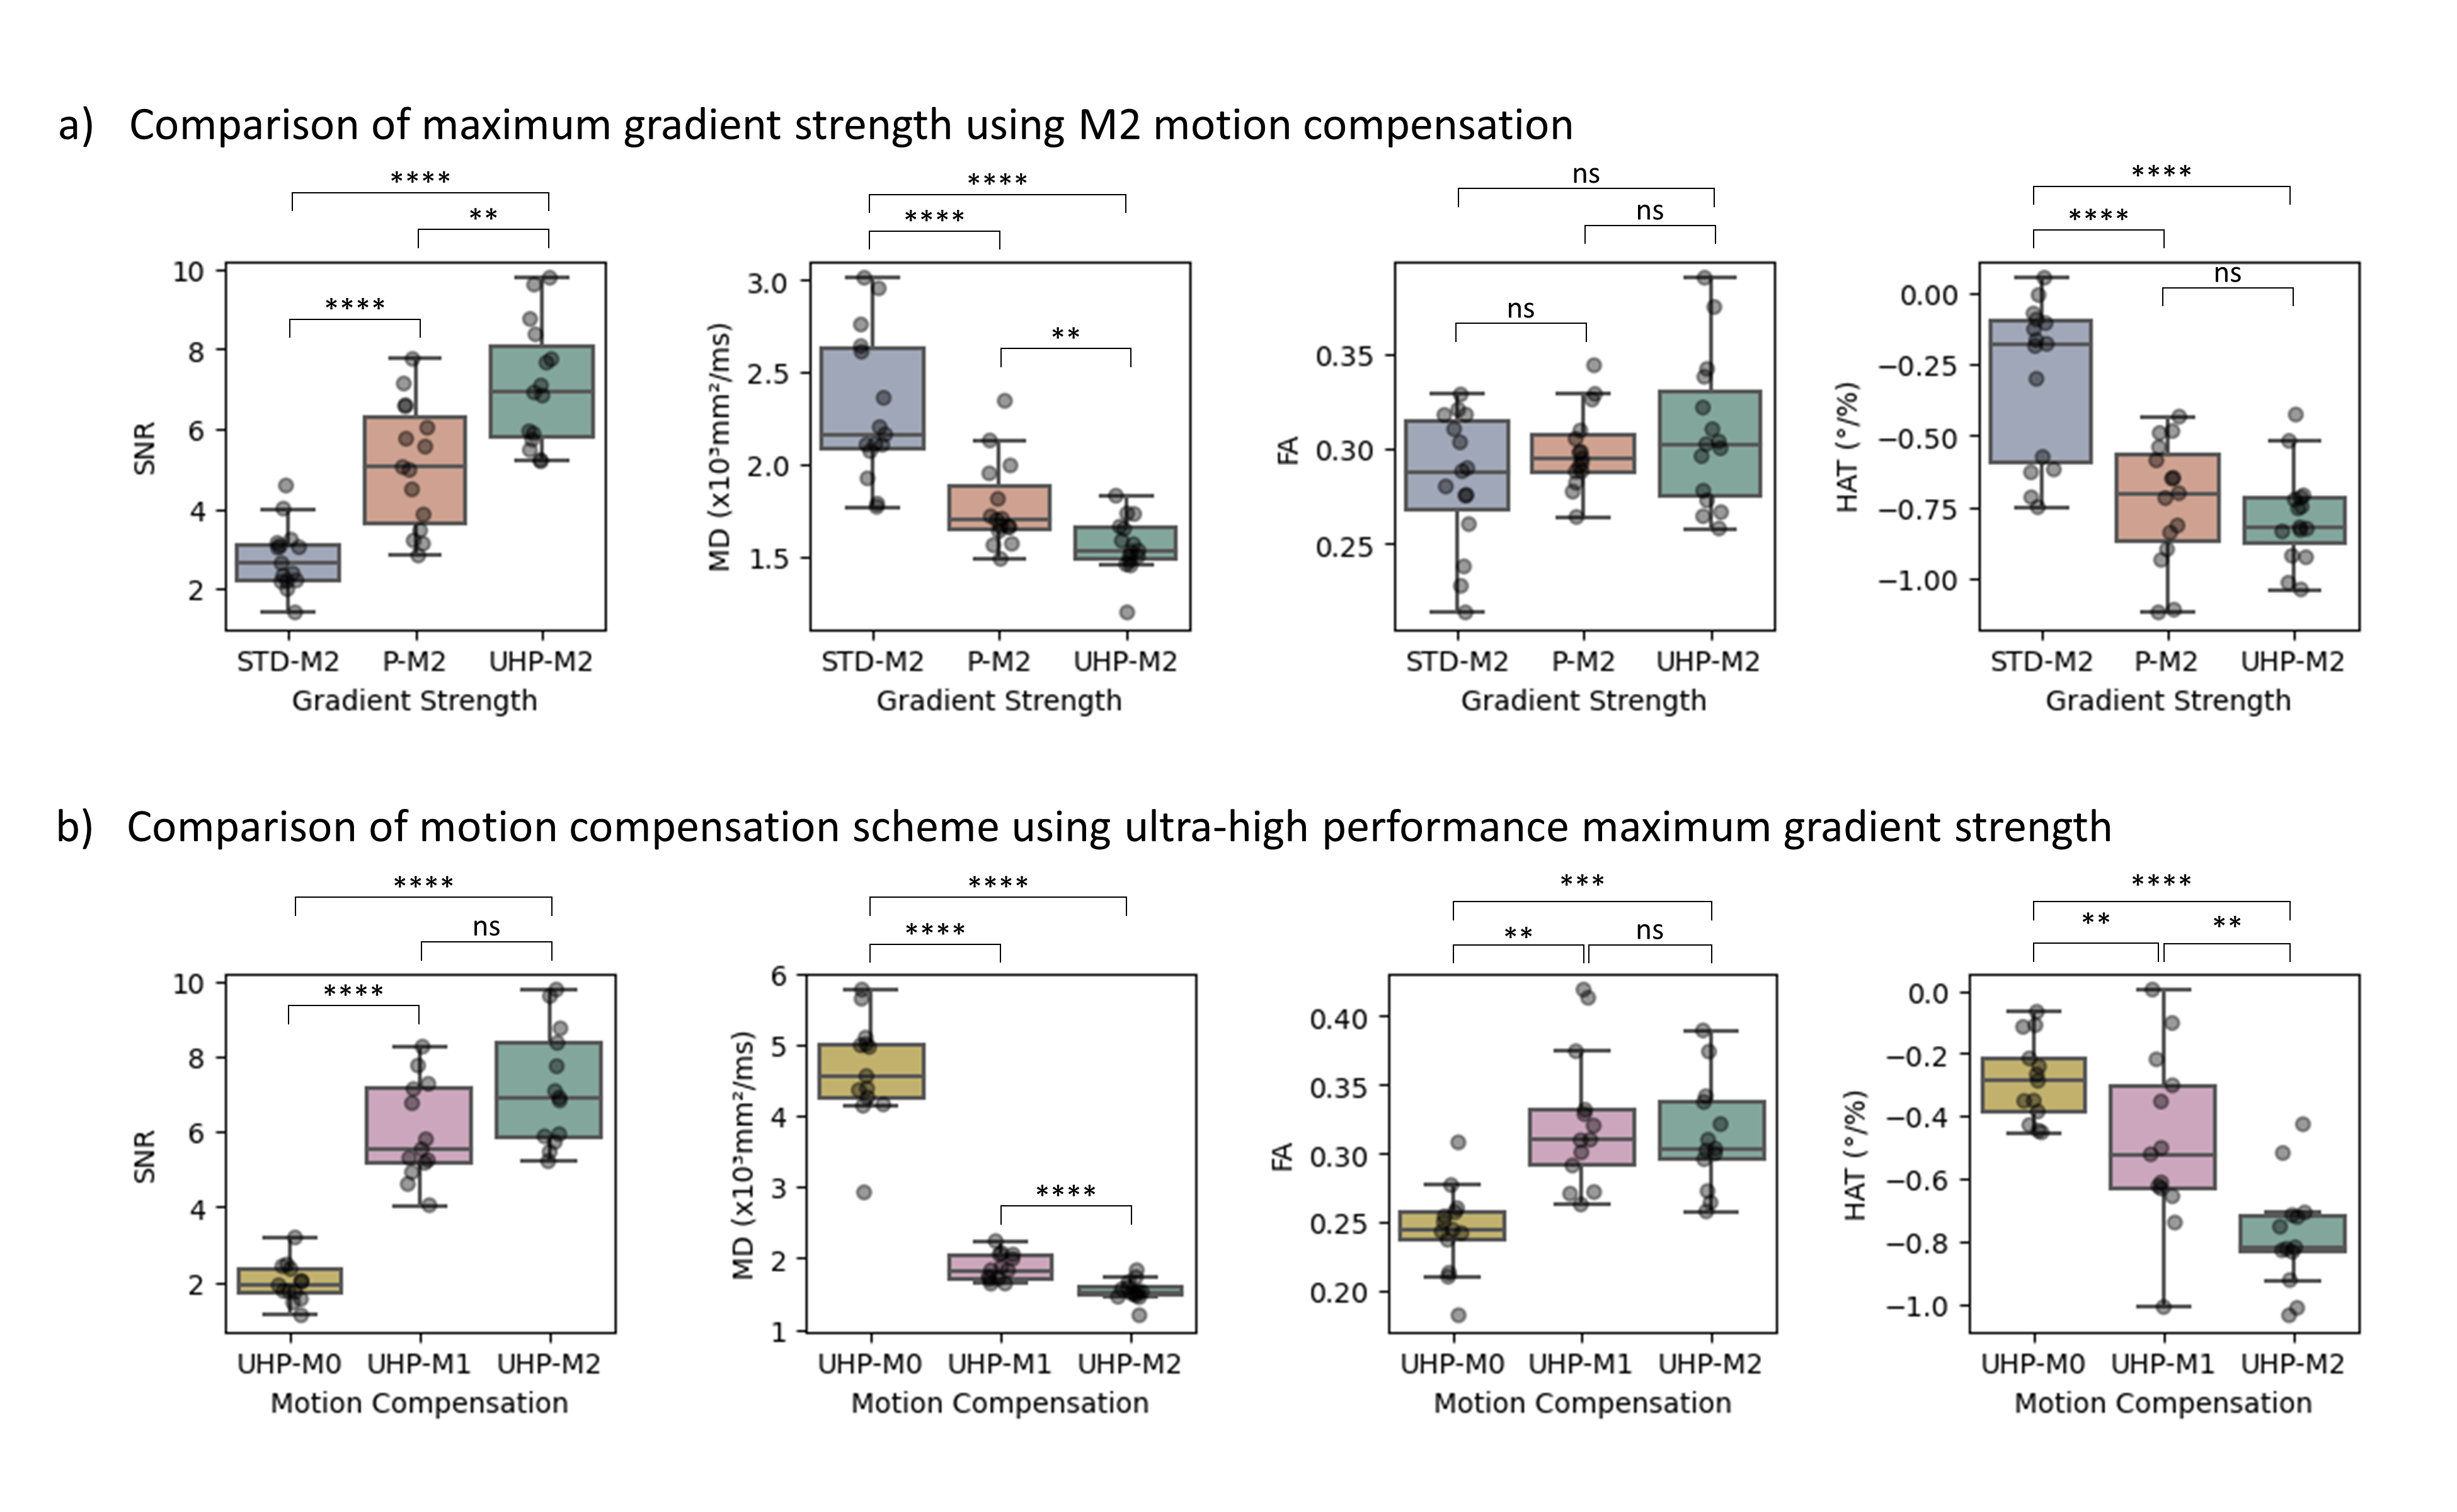
Results of paired t-tests for average SNR, MD, FA, and HAT in the LV from healthy volunteer data are presented in Figure 3. UHP-M2 images have significantly higher SNR than STD-M2 (p<0.0001) and P-M2 (p<0.01) images. While mean MD (p<0.01), FA (p>0.01), and HAT (p>0.01) from P-M2 and UHP-M2 data are comparable and within expected physiological ranges, UHP-M2 data yields reduced variability and decreased mean HAT, as expected for healthy volunteers4.
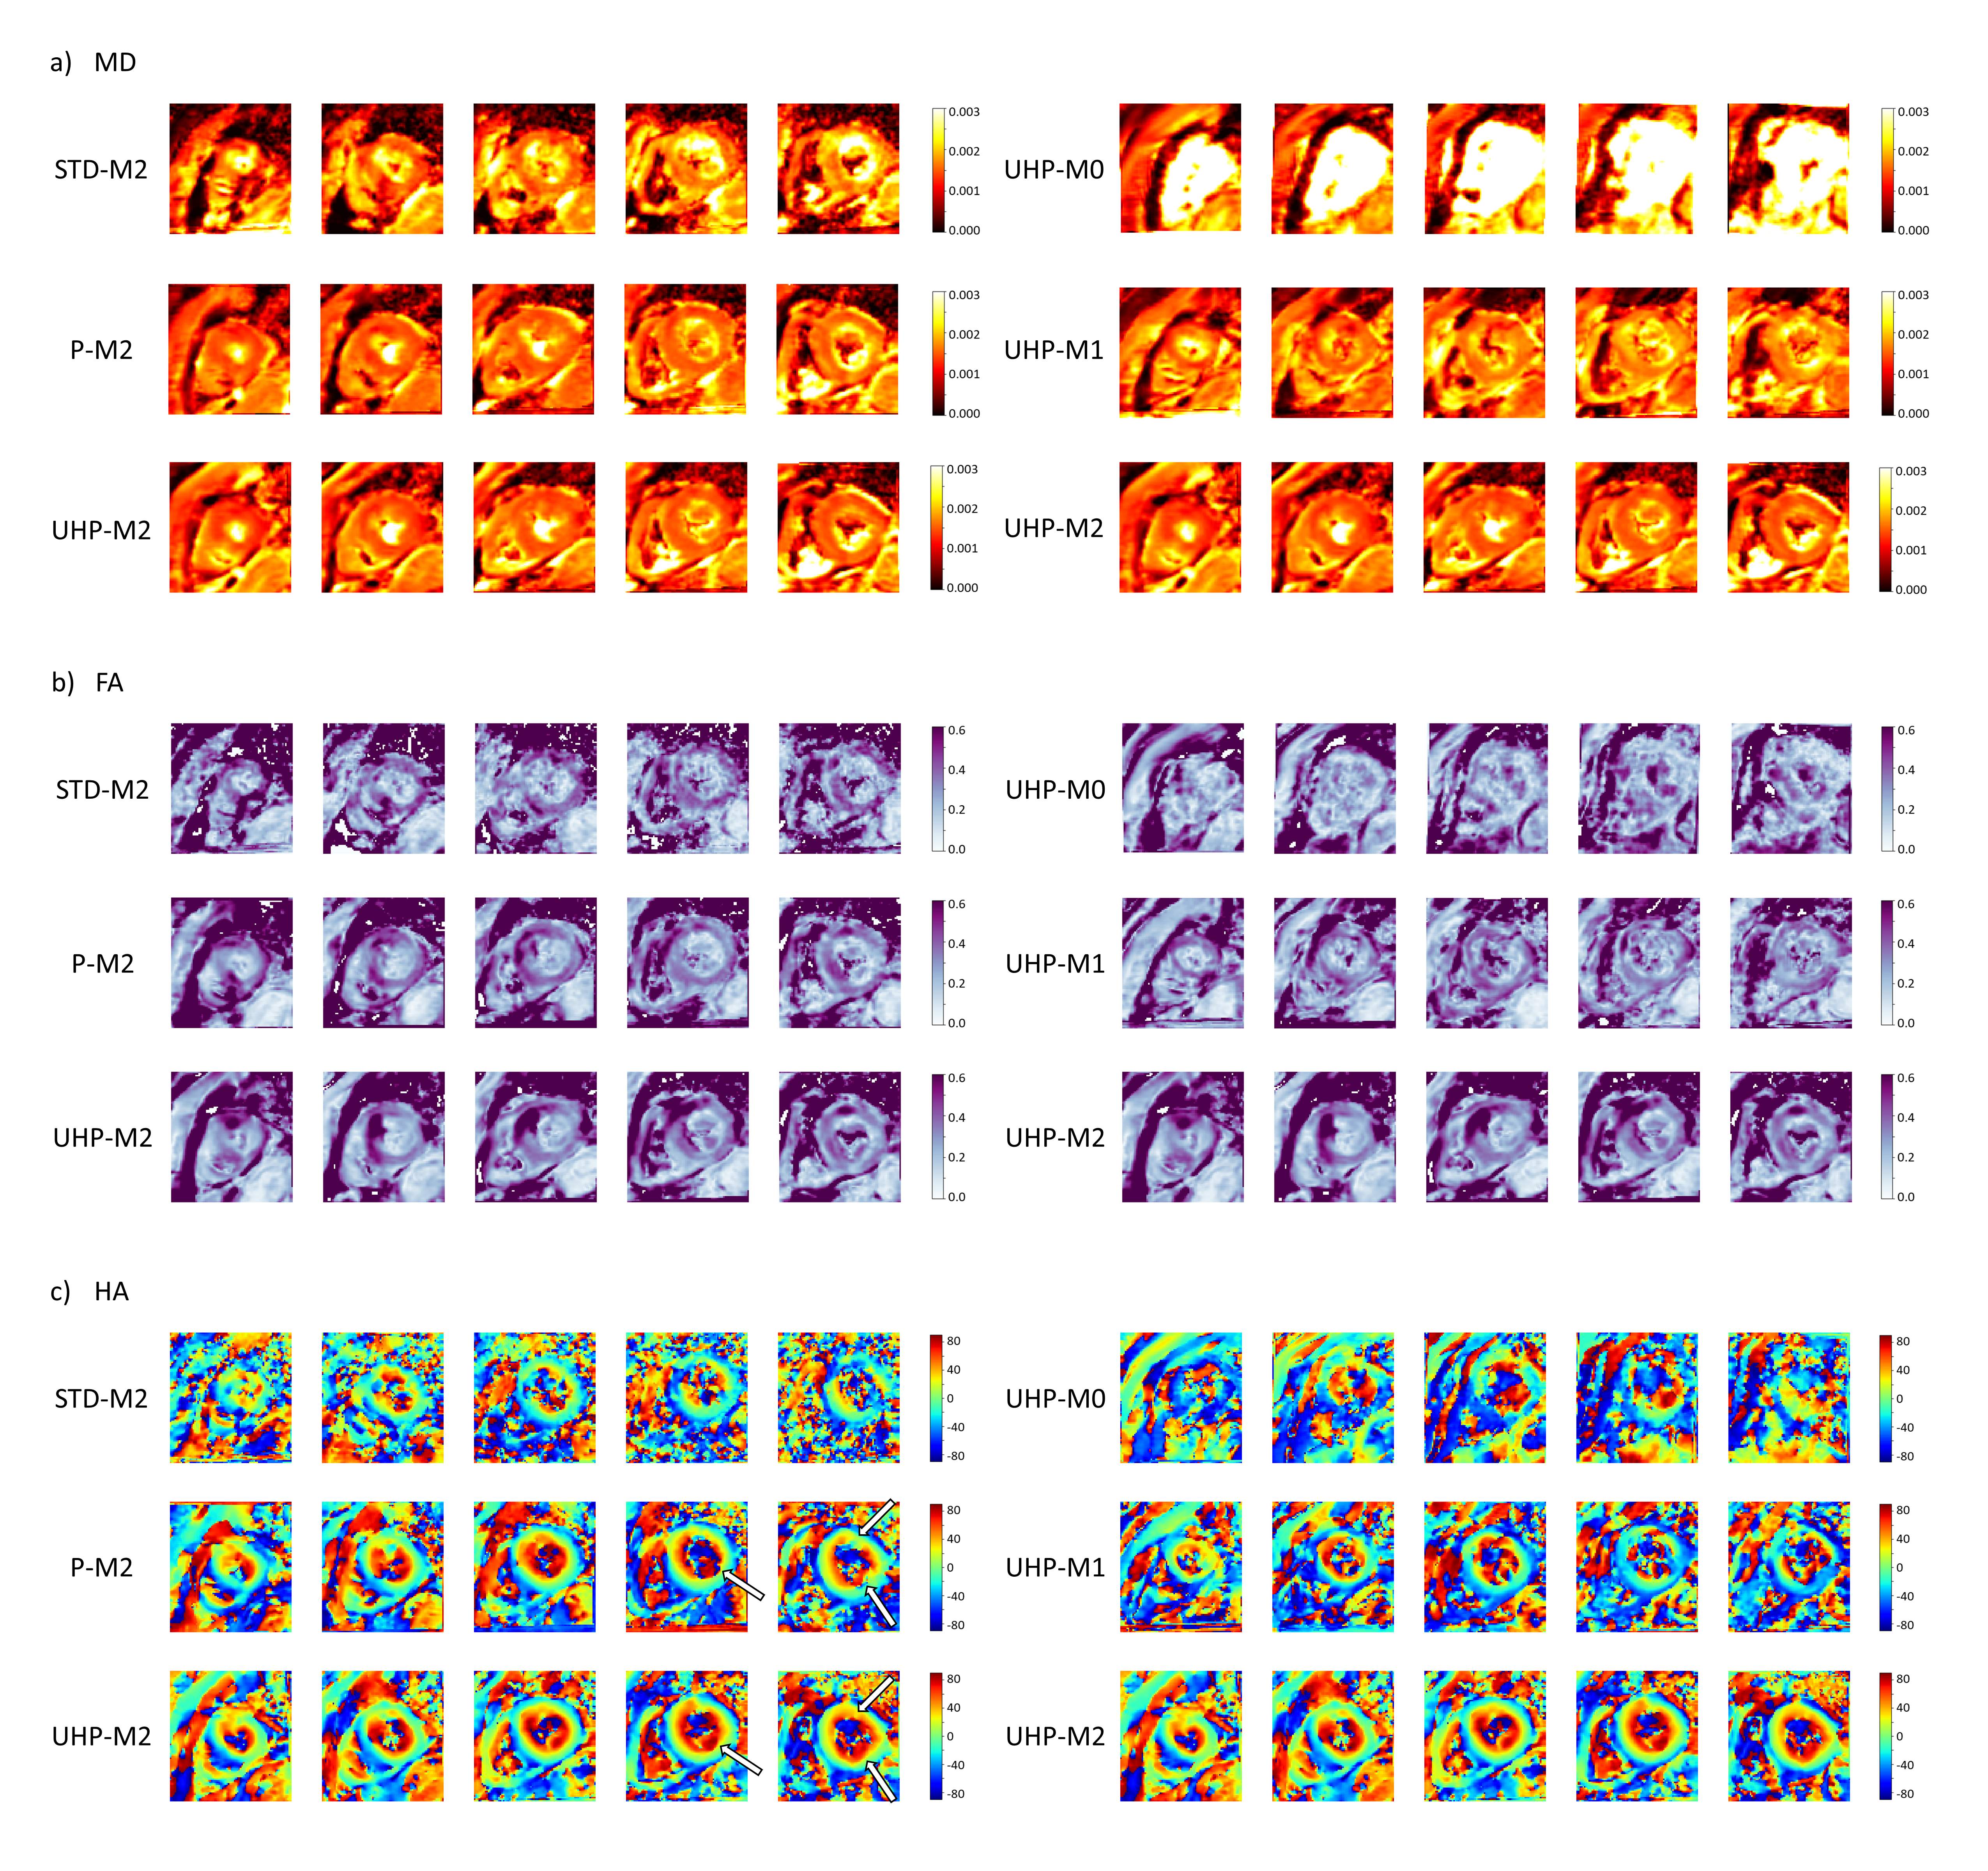
Figure 4 shows DTI maps obtained from patient data. STD-M2, UHP-M0, and UHP-M1 maps exhibit poor quality, suggesting impaired clinical utility. While P-M2 and UHP-M2 maps are comparable, disruptions of the expected, smoothly varying helical structure of the LV are observed in the basal slices of the P-M2 HA maps that are shown to be imaging artifacts due to their absence in the UHP-M2 data (indicated with arrows).
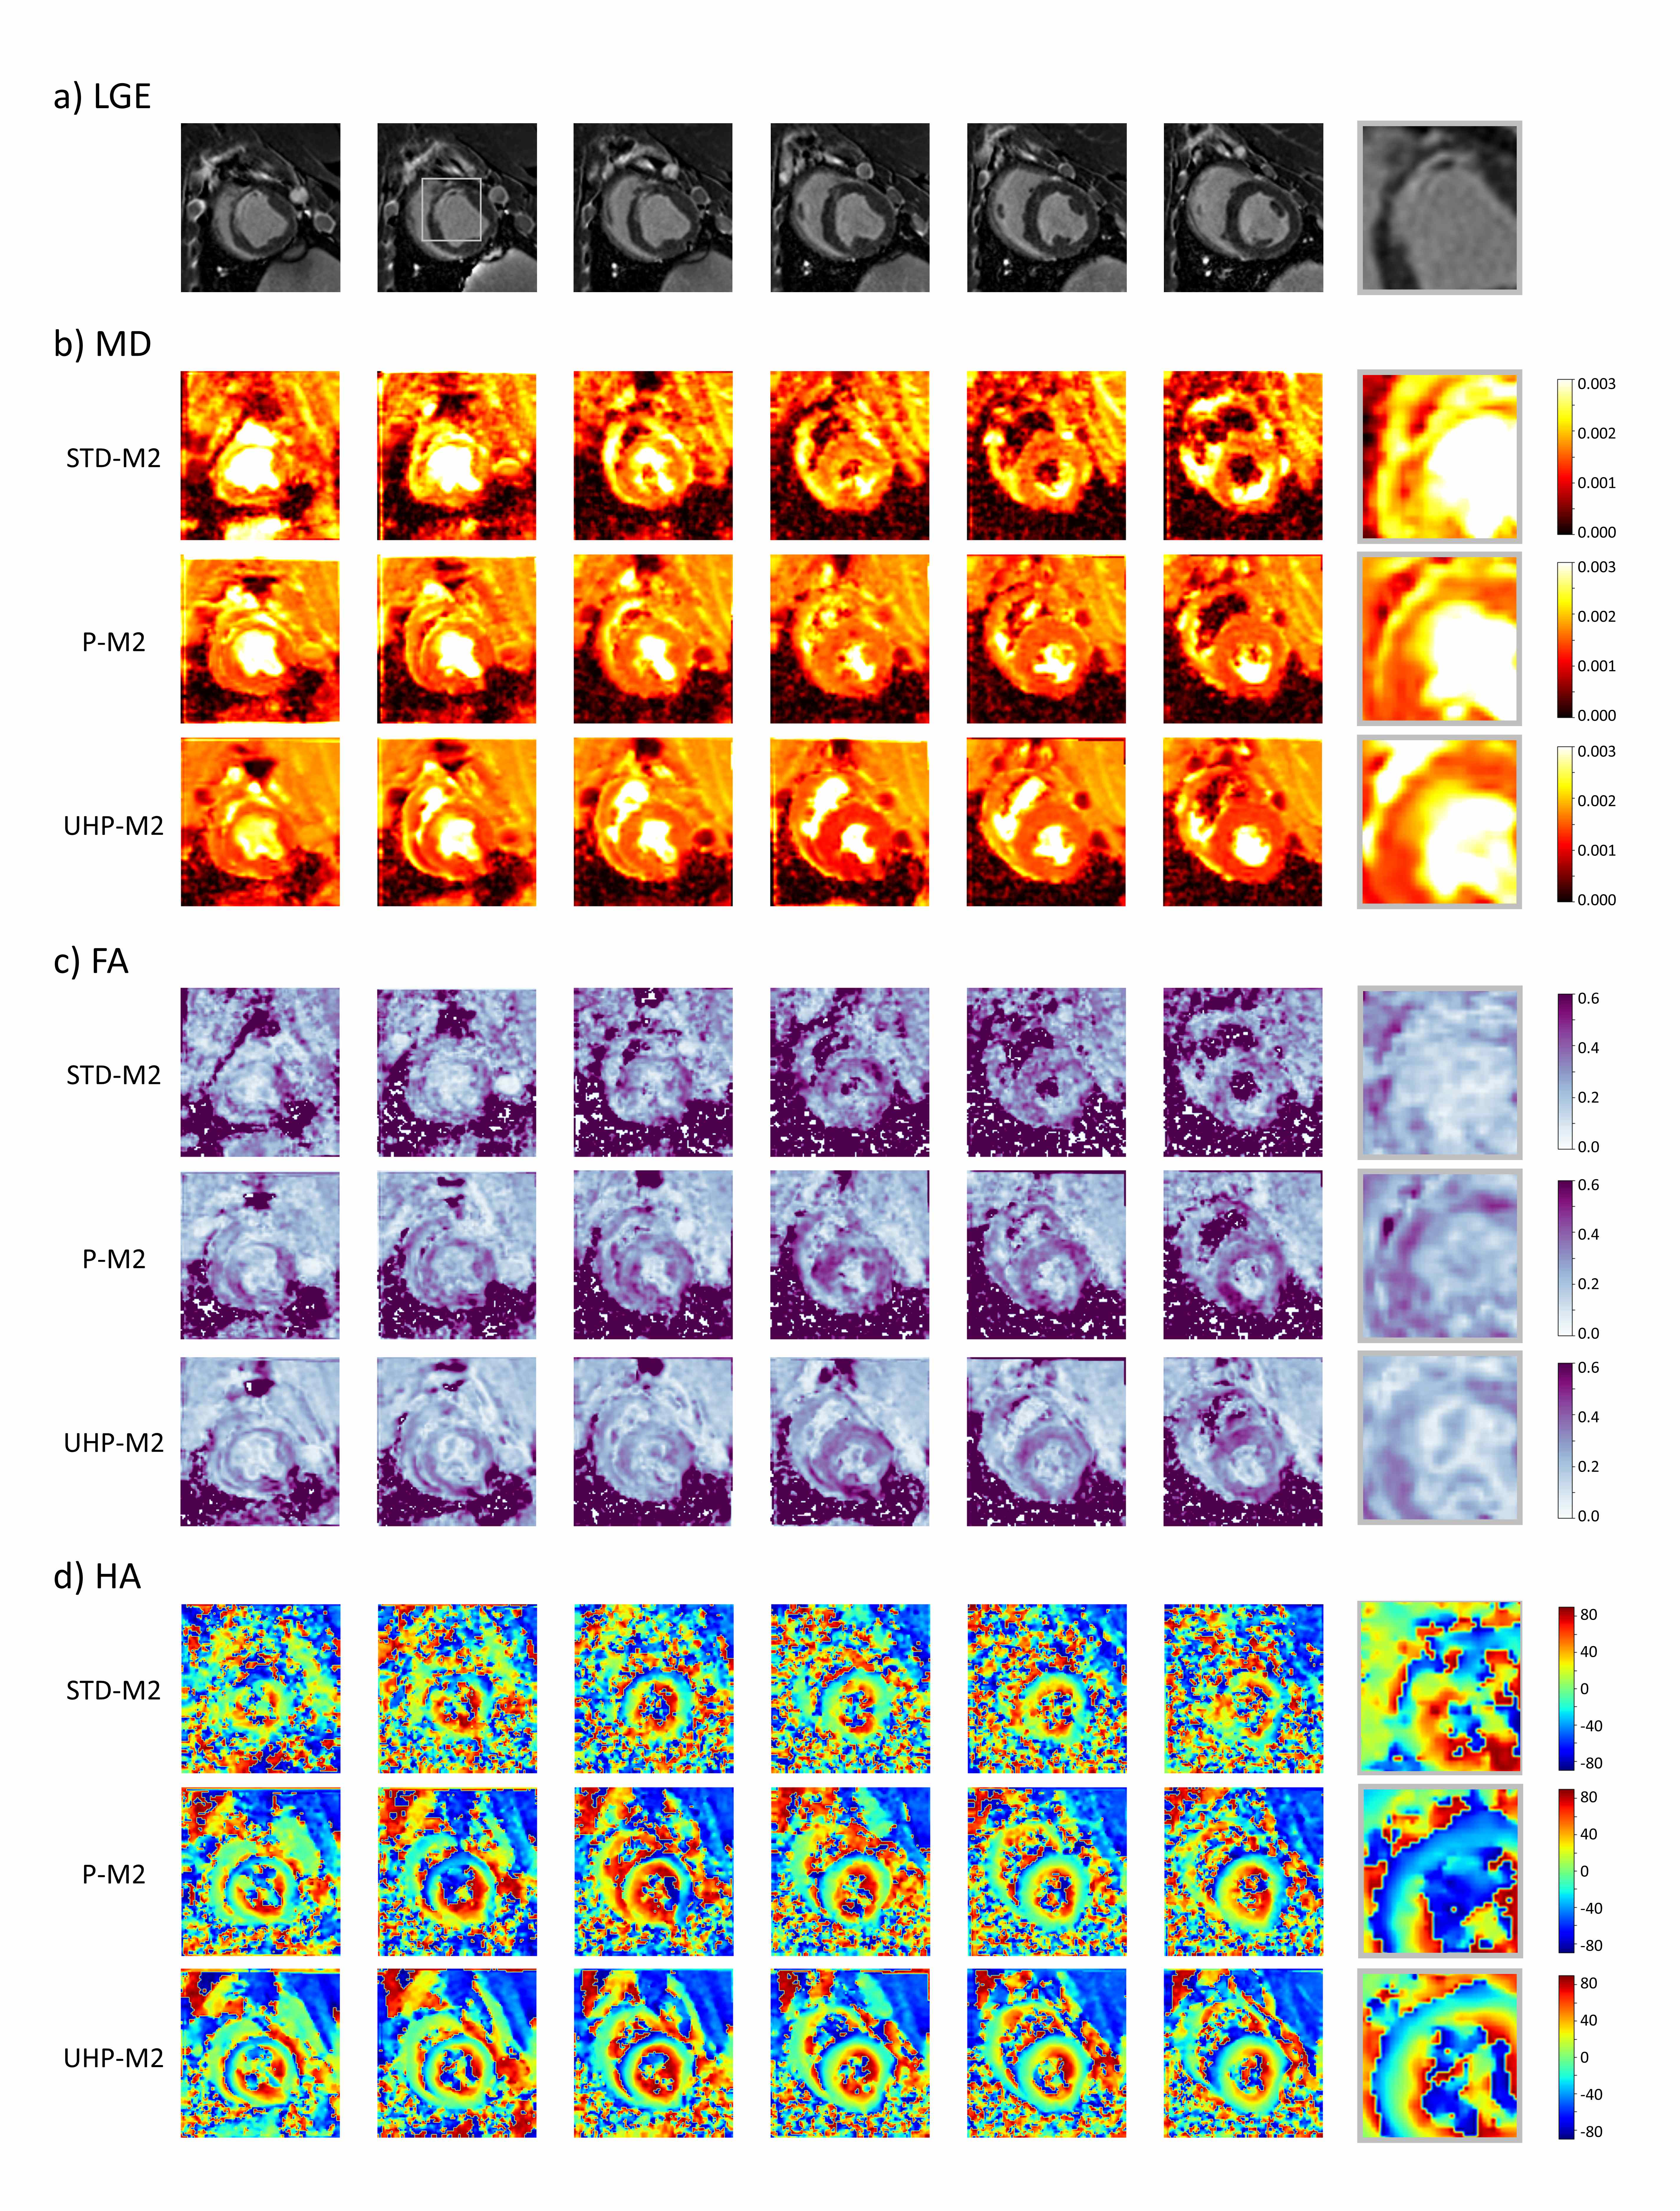
LGE images and DTI maps obtained from the swine subject are presented in Figure 5, with a magnified view of the scar region (gray box). While the regions of scar exhibit elevated MD, reduced FA, and reduced HA in P-M2 and UHP-M2 datasets, the boundaries of the scar are more clearly defined and show improved agreement with enhanced regions on LGE images in UHP-M2 maps.
Conclusion
While high-quality DT-CMR is possible on systems achieving Gmax=80mT/m, the use of UHP gradient systems (Gmax=200mT/m) enables short-TE acquisitions yielding significantly higher SNR DW images (p<0.01) and consequently improved DT-CMR. Despite shortened diffusion time possible with the UHP system, M2 compensation continues to be required to prevent motion-induced signal dropout in cardiac DW images. In swine and patient data, UHP gradients improved visualization of MI scar and helical cardiomyocyte structure, particularly in the endocardial border regions.Acknowledgements
This work was supported by NIHLBI (R01 HL151704, R01 HL159010) and NIBIB (R01 EB033853). We thank the Imaging Institute and the Cardiovascular Innovation Research Center for their support.References
- Nguyen C, Fan Z, Xie Y, et al. In vivo diffusion-tensor MRI of the human heart on a 3 tesla clinical scanner: An optimized second order (M2) motion compensated diffusion-preparation approach: Optimized in vivo M2 DT-CMR for a 3T clinical scanner. Magn Reson Med. 2016;76(5):1354-1363. doi:10.1002/mrm.26380
- Nguyen CT, Christodoulou AG, Coll‐Font J, et al. Free‐breathing diffusion tensor MRI of the whole left ventricle using second‐order motion compensation and multitasking respiratory motion correction. Magn Reson Med. 2021;85(5):2634-2648. doi:10.1002/mrm.28611
- Goerner FL, Clarke GD. Measuring signal‐to‐noise ratio in partially parallel imaging MRI. Med Phys. 2011;38(9):5049-5057. doi:10.1118/1.3618730
- Nguyen CT, Dawkins J, Bi X, Marbán E, Li D. Diffusion Tensor Cardiac Magnetic Resonance Reveals Exosomes From Cardiosphere-Derived Cells Preserve Myocardial Fiber Architecture After Myocardial Infarction. JACC Basic Transl Sci. 2018;3(1):97-109. doi:10.1016/j.jacbts.2017.09.005
Figures