1266
Validation and assessment of venous transit time in the human brain using VICTR MRI1Department of Biomedical Engineering, Johns Hopkins University School of Medicine, Baltimore, MD, United States, 2Department of Radiology & Radiological Science, Johns Hopkins University School of Medicine, Baltimore, MD, United States, 3Department of Neurology, Johns Hopkins University School of Medicine, Baltimore, MD, United States, 4Department of Radiology, New York University Grossman School of Medicine, New York, NY, United States
Synopsis
Keywords: Velocity/Flow, Perfusion, Transit Time, Vein
Motivation: Venous transit time (VTT) is insufficiently investigated and can be a useful marker for clinical populations with abnormalities in the cerebral venous system.
Goal(s): To further verify a novel non-contrast VICTR MRI and investigate advanced VTT properties and their age effects in the brain.
Approach: We compared the VTT from VICTR and a contrast-based method. Statistical properties of VTT distribution were studied in a caffeine challenge and compared between young and older subjects.
Results: VTT from VICTR MRI showed great agreement with contrast-based VTT. The mean, peak, and spread of VTT increased in the caffeine challenge. VTT is longer in the older subjects.
Impact: VICTR MRI can measure venous transit time in the adult brain which increases with age. The non-contrast measurement of venous transit time paves the way for several research avenues to better understand vascular function in the normal and pathological brain.
Introduction
The cerebral venous system is a crucial vascular network but is insufficiently investigated compared to its arterial counterpart1–4. Venous transit time (VTT) which denotes the time for the blood to travel from the capillary exchange sites to major veins, e.g., superior sagittal sinus (SSS), is a new hemodynamic parameter. We recently proposed a novel non-contrast MRI technique, Venous transit time Imaging by Changes in T1 Relaxation (VICTR), to measure VTT in the SSS5. Here, we further verified the measured VTT by comparison to a bolus tracking method using gadolinium (Gd)-based contrast agent and studied several more advanced VTT properties. Lastly, we assessed the age effect on VTT properties.Methods
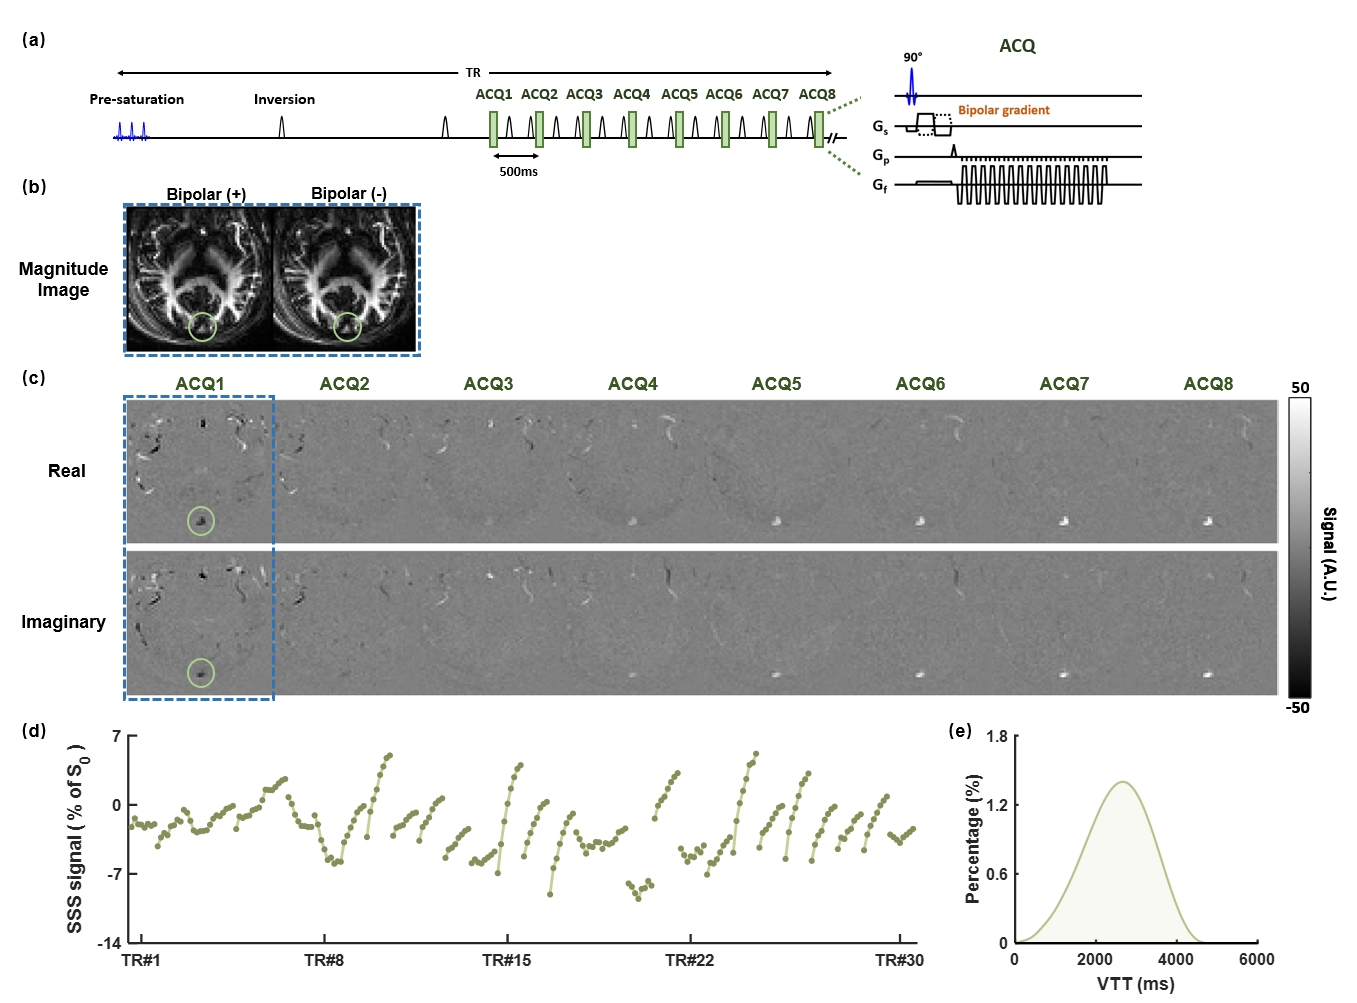
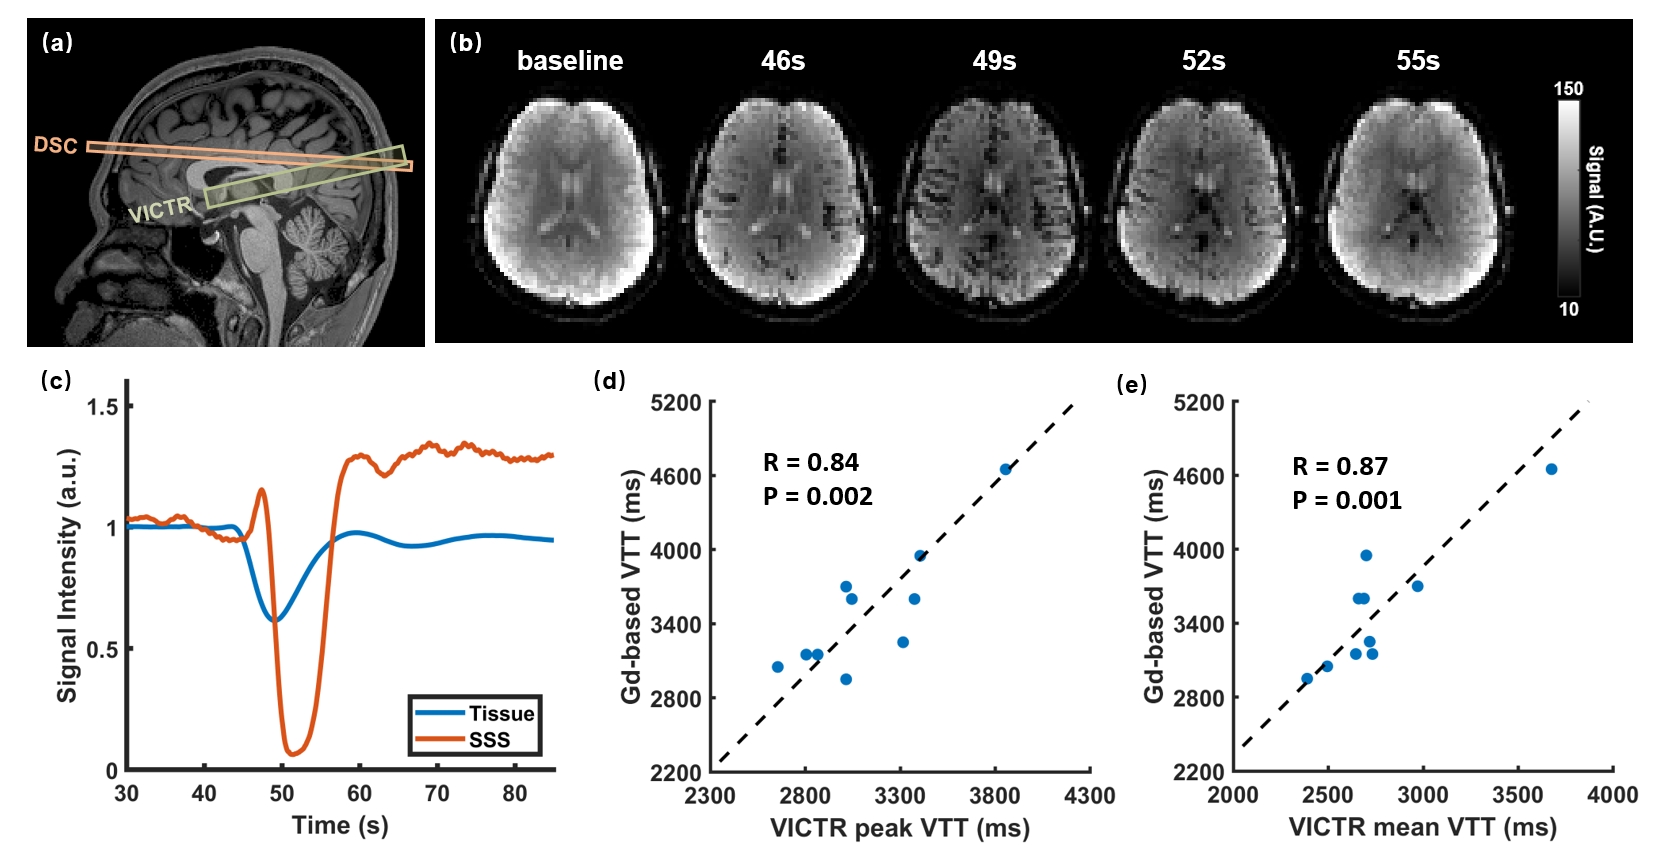
VICTR MRI: Figure 1 shows the diagram of the MR pulse sequence and data processing. Briefly, the water spins experience a two-phase T1 relaxation before measurement in the veins, i.e., recovery with tissue T1 and, once exchanged into the capillary, with blood T1 for a duration of VTT5. Given the biexponential T1 recovery, a distinct SSS signal trace can be measured at different time points, and a VTT distribution is then obtained. The scan was performed at posterior SSS with the following parameters: FOV=150×150×10mm3, voxel size=2.3×2.3×10mm3, 30 TR patterns, TE=14ms, VENC=35cm/s. An M0 scan with TR=10s and identical acquisition was performed to normalize the signal. All experiments were performed on a 3T Siemens Prisma with IRB approval.Study 1: Comparison with Gd–based method: Ten healthy volunteers (27±5 years, 3M/7F) participated in this experiment. Dynamic susceptibility contrast (DSC) MRI allows bolus tracking as the contrast agent passes by the capillary and veins, providing another VTT measurement. We thus performed a DSC scan with the following protocol6: single-slice, TR/TE=100/25ms, FOV=205×205×5mm3, voxel size=3.2×3.2×5mm3. MR contrast agent gadobutrol (Gadavist, Bayer Healthcare) was administrated intravenously (dose=0.1 mmol/kg, infusion rate=4 mL/s). To estimate the Gd-based VTT, we manually delineated the regions of SSS to obtain the averaged MRI signal. The mid-point of the times when the maximum and minimum slope of the signal appears was used as the SSS bolus arrival time (BAT). The same procedure was applied to a tissue ROI to obtain a tissue BAT. Gd-based VTT can then be obtained by: $$$VTT_{Gd}=BAT_{SSS}-BAT_{tissue}$$$.
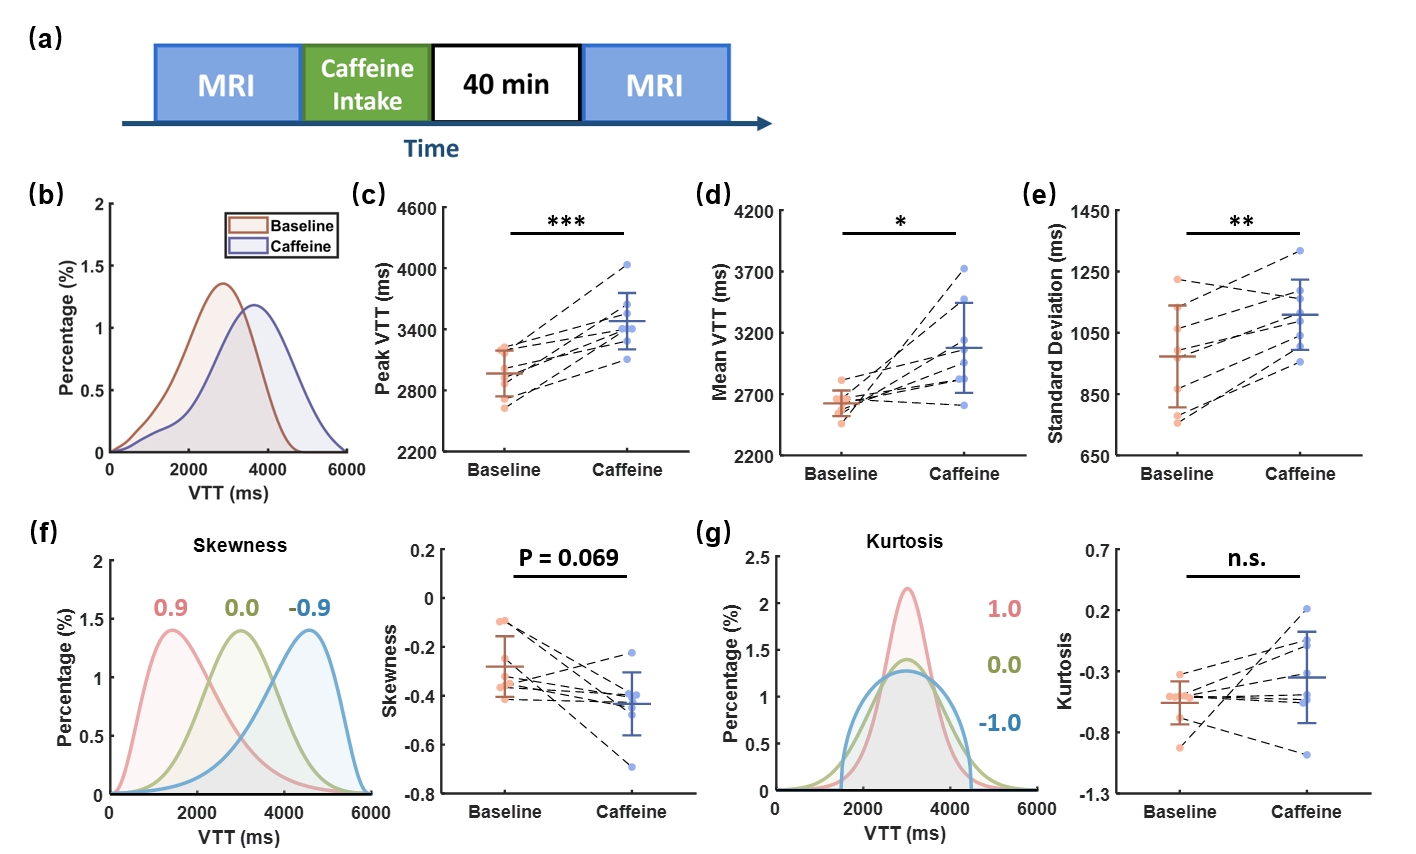
Study 2: Advanced VTT properties: The VTT we obtained experimentally from VICTR MRI was a distribution, e.g., Figure 1e. Our previous study has only explored one property of this distribution, namely the peak time of the distribution (peak VTT). In this study, we aimed to examine several other statistical properties of the VTT distribution, i.e., mean, standard deviation, skewness, and kurtosis. A vasoconstrictive caffeine challenge was conducted to study the sensitivity to physiological changes in each of these properties7,8. Eight healthy volunteers (28±6 years, 3M/5F) were enrolled and each underwent a baseline VICTR scan and another one after taking a 200mg caffeine tablet.
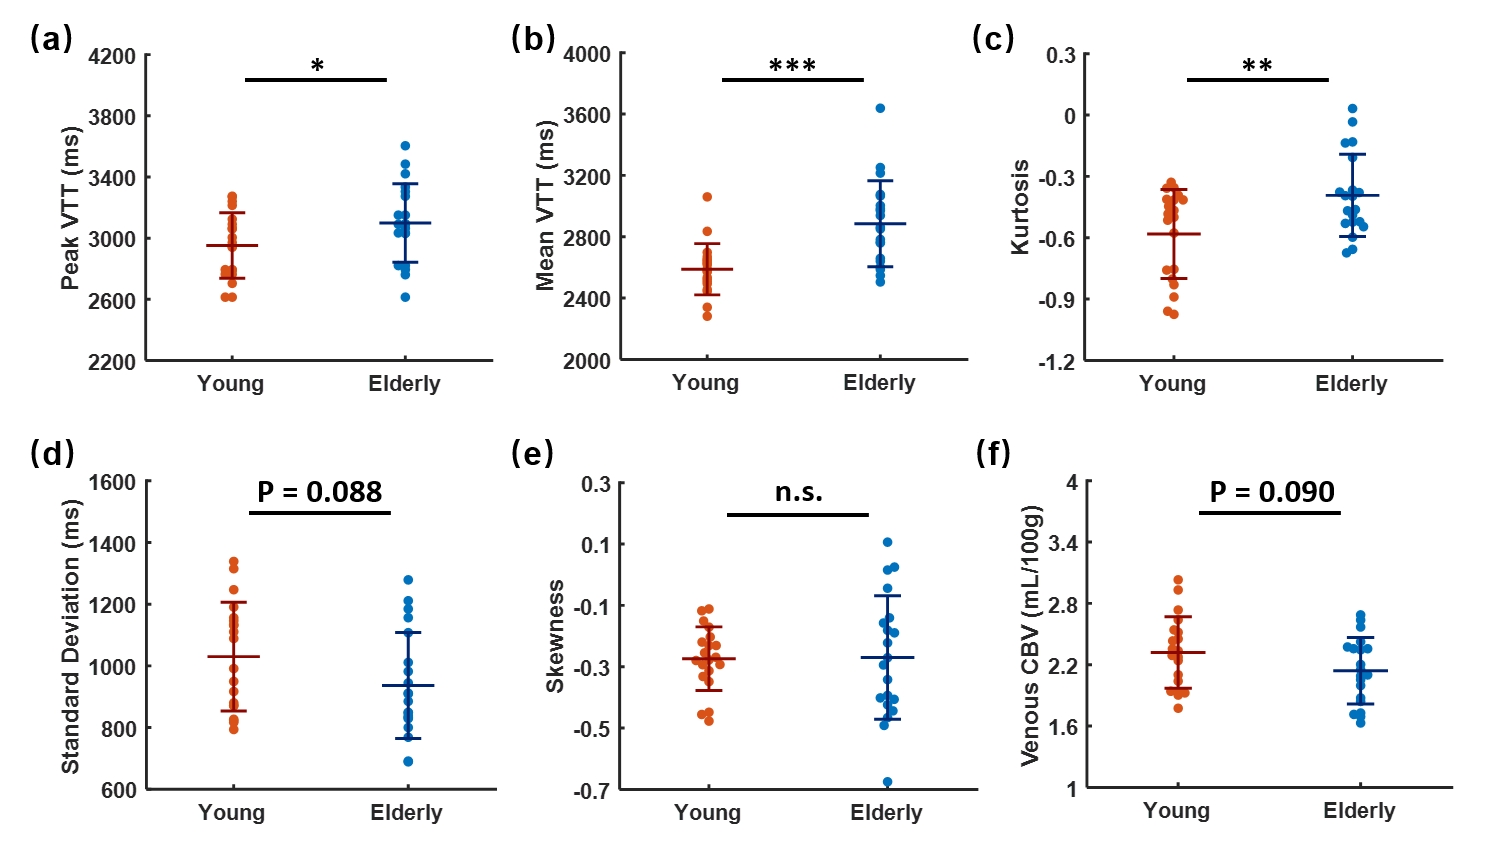
Study 3: Aging effect: VICTR MRI was performed on twenty healthy young (27±5yrs, 7M/13F) and twenty elderly subjects (73±8yrs, 9M/11F). Whole-brain cerebral blood flow (CBF) was also measured using phase-contrast MRI9. Another physiological parameter, global venous cerebral blood volume (vCBV), was quantified by: $$$vCBV = mean \ VTT \times CBF$$$.
Results and discussion
Study 1: Figure 2b shows representative baseline and post-contrast T2*-weighted images using the DSC method. The image intensity was substantially reduced after the contrast injection. The typical signal time courses in the tissue and SSS are shown in Figure 2c in which the tissue signal exhibits an early drop. Figure 2d-e shows that both peak (R=0.84, P=0.002) and mean VTT (R=0.87, P=0.001) of VICTR MRI have a significant correlation with Gd-based VTT.Study 2: Figure 3b shows the representative VTT distributions during the caffeine challenge. Figure 3c-3g shows that caffeine ingestion resulted in significant increases in peak (P<0.001), mean (P=0.020), and standard deviation (P=0.004) of VTT and there is a decreasing trend in skewness, with no change in kurtosis.
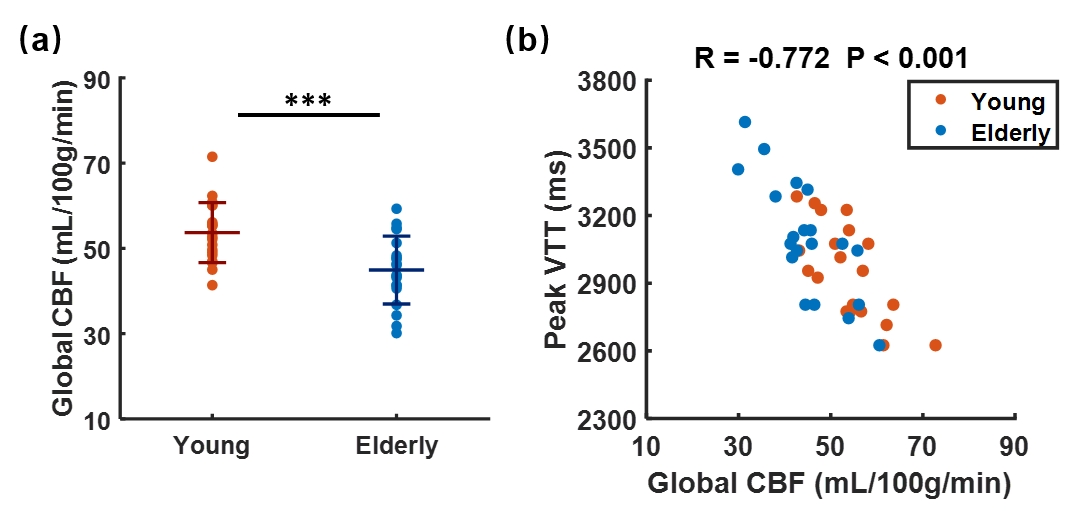
Study 3: Figure 4a-c shows that peak (P=0.045), mean (P<0.001) and kurtosis (P=0.006) are significantly higher in elderly subjects compared to young subjects. Figure 4d-e shows a decreasing trend in standard deviations but no changes in skewness with age. Figure 4f shows that the elderly generally have a lower vCBV. Figure 5 shows that the global CBF significantly decreases in elderly people and peak VTT is inversely correlated with the global CBF (R=-0.772, P<0.001), suggesting that the increased peak VTT in the elderly is associated with reduced CBF.
Conclusion
VICTR MRI results showed consistency with the contrast agent-based approach Several statistical properties of VTT distribution are sensitive to physiological changes. VTT becomes longer in the elderly compared to the younger subjects.Acknowledgements
No acknowledgment found.References
1. Wilson MH. Monro-Kellie 2.0: The dynamic vascular and venous pathophysiological components of intracranial pressure. J Cereb Blood Flow Metab. 2016;36(8):1338–50.
2. Schuchardt F, Schroeder L, Anastasopoulos C, et al. In vivo analysis of physiological 3D blood flow of cerebral veins. Eur. Radiol. 2015;25(8):2371–80.
3. Lee BC, Tsai HH, Liu CJ, et al. Cerebral Venous Reflux and Cerebral Amyloid Angiopathy: An Magnetic Resonance Imaging/Positron Emission Tomography Study. Stroke. 2023;54(4):1046–55.
4. Hua J, Liu P, Kim T, et al. MRI techniques to measure arterial and venous cerebral blood volume. Neuroimage. 2019;187:17–31.
5. Shi W, Jiang D, Moghekar A, et al. VICTR : Venous transit time ( VTT ) Imaging by Changes in T1 Relaxation. Proceedings of the ISMRM & SMRT Annual Meeting & Exhibition 32th Annual Meeting. 2023.
6. Liu P, Uh J, Devous MD, et al. Comparison of relative cerebral blood flow maps using pseudo-continuous arterial spin labeling and single photon emission computed tomography. NMR Biomed. 2012;25(5):779–86.
7. Lin Z, Jiang D, Liu P, et al. Blood–brain barrier permeability in response to caffeine challenge. Magn Reson Med. 2022;88(5):2259–66.
8. Addicott MA, Yang LL, Peiffer AM, et al. The effect of daily caffeine use on cerebral blood flow: How much caffeine can we tolerate? Hum Brain Mapp. 2009;30(10):3102–14.
9. Peng SL, Su P, Wang FN, et al. Optimization of phase-contrast MRI for the quantification of whole-brain cerebral blood flow. J Magn Reson Imaging. 2015;42(4):1126–33.
Figures