1265
Optimization of Echo Time for BOLD Dynamic Susceptibility Contrast MRI1Center for Neuroscience Imaging Research (CNIR), Institute for Basic Science (IBS), Suwon, 16419, Republic of Korea, Suwon, Korea, Republic of
Synopsis
Keywords: Perfusion, Perfusion, TE-dependency
Motivation: Achieving accurate quantification of absolute CBV and CBF in BOLD-DSC depends on maximizing the hypoxia-induced signal changes and accurately determining the arterial input function.
Goal(s): The choice of echo time affects both baseline signal-to-noise ratio and hypoxia-induced changes1,2, our study aimed to investigate the effects of different TEs on the quantification of CBV and CBF.
Approach: We systematically varied TE within the range of 11.57 ms to 20 ms , measured hypoxia-induced signal changes in arterial, venous, and somatosensory tissue voxels, and quantified perfusion metrics.
Results: We discovered that a shorter TE, which produces sufficient signal changes without causing arterial peak saturation, is preferable.
Impact: Shorter TE leads to less hypoxia-induced signal changes, while longer TE decreases baseline SNR and increase the risk of arterial signal saturation. This signal saturation leads to the underestimation of AIF, and consequently, overestimation of perfusion quantification.
Introduction
Non-invasive measurements of perfusion metrics, such as cerebral blood volume (CBV) and cerebral blood flow (CBF) are essential for effectively monitoring disease progression and treatment response. To achieve these non-invasive measurements, we adopted a BOLD dynamic susceptibility contrast (DSC) method with transient hypoxia3. In BOLD-DSC MRI, it is crucial to maximize hypoxia-induced signal changes and accurately determine arterial input functions. Therefore, optimizing the appropriate echo time (TE) becomes vital, as it impacts both the baseline signal-to-noise ratio and the magnitude of signal changes. A shorter TE results in reduced hypoxia-induced changes, while a longer TE reduces the baseline SNR and increases the risk of arterial signal saturation1,4. To address this, we systematically varied TE within the range of 11.57 ms to 20 ms across six mice, allowing us to measure hypoxia-induced signal changes in arterial, venous, and somatosensory tissue voxels, and accurately quantify perfusion metrics.Methods
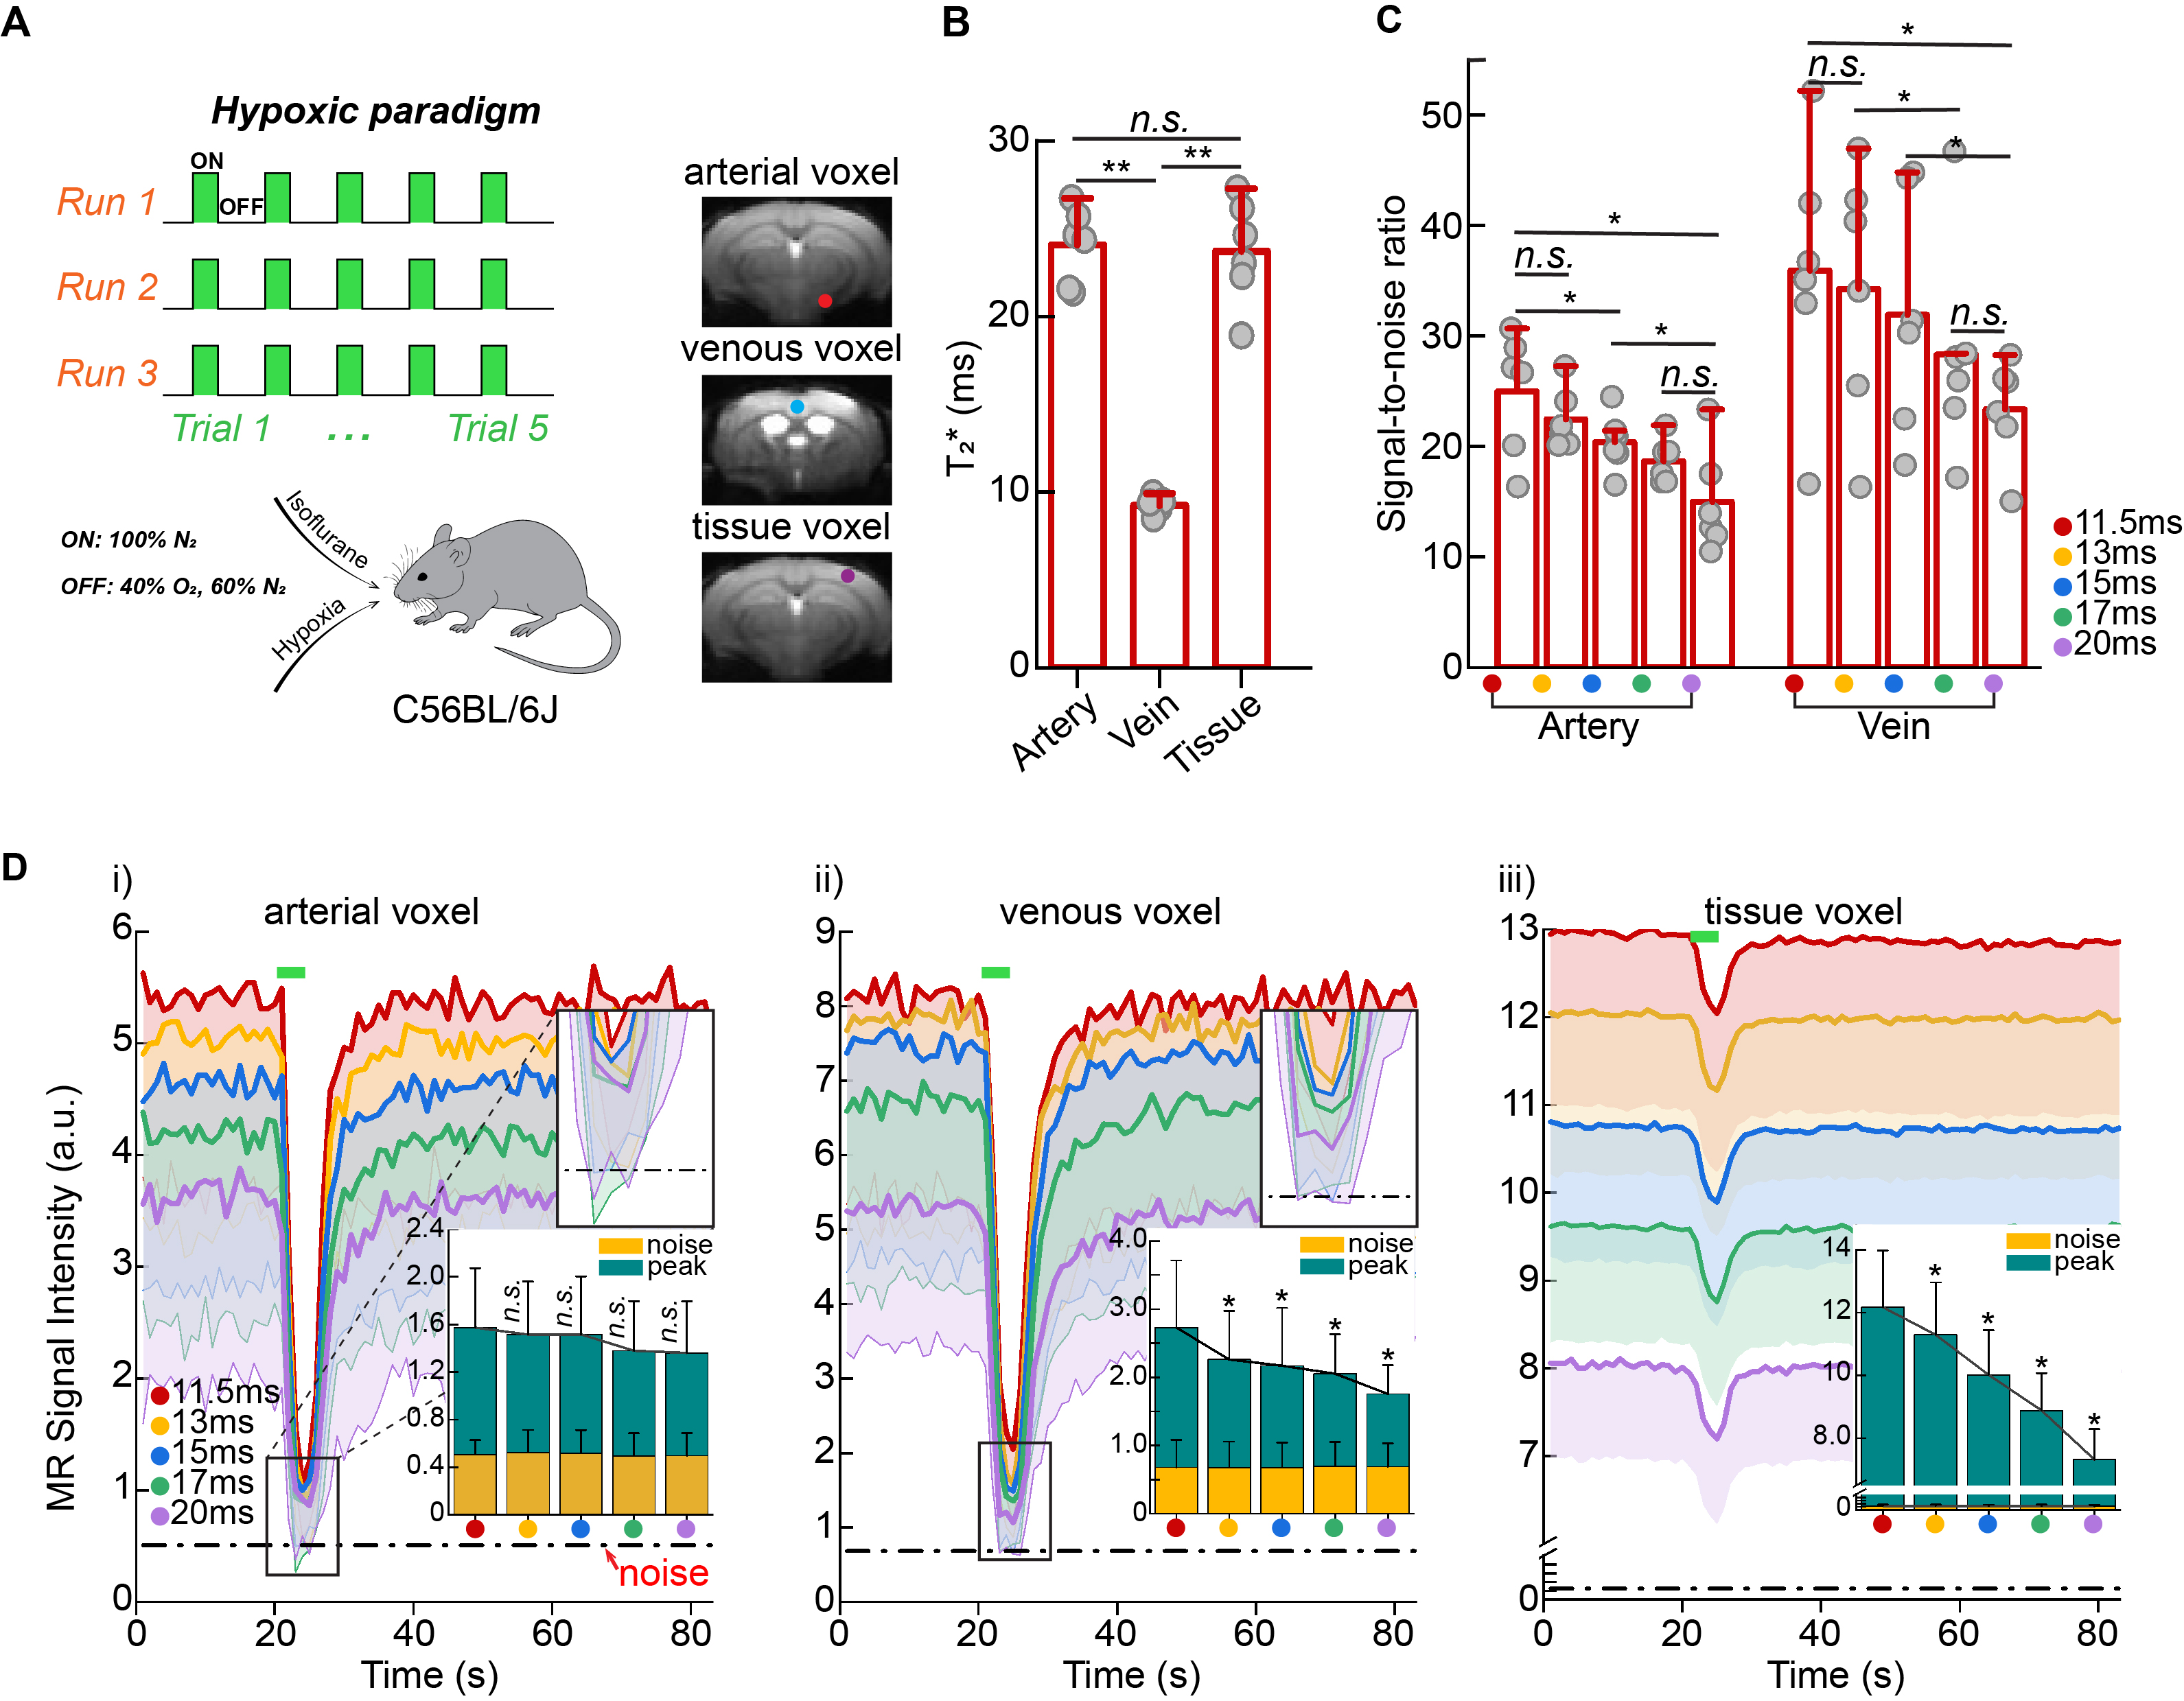
Hypoxic Gas StimulationTransient anoxic stimulus was delivered using a block design paradigm of 60s rest (40% O2/ 60% N2) and 5s stimulation (100% N2) alternatively repeated five times (Figure 1.A).
BOLD acquisitions
BOLD MRI studies were acquired on a 9.4T system using GE-EPI sequence with varying echo times TR/TEs =1000/11.5, 13, 15, 17 and 20ms, FA=50°, 156x156x500 μm3 , 20 slices. Hypoxic stimulus was administered under 1.5% Isoflurane in 6 animals.
Data analysis
An automatic algorithm was used for selecting candidate arterial and venous voxel, while tissue voxel was chosen from the somatosensory region. The noise level was given by the standard deviation (SD) of the baseline signal. Baseline SNR was calculated SNR= S0/SD (S0: mean baseline signal intensity). Hypoxia-induced ΔR*2 at different TEs were calculated based on: ∆S/S0=-TE × ΔR*2 (∆S: hypoxic-induced signal change). To quantify perfusion values from dynamic hypoxia-induced BOLD responses, we adopted the DSC theory3.
Results
Longer TEs cause arterial and venous peak signal saturationsThe baseline values were 24.07±2.17 ms for the artery, 9.23±0.59 ms for the vein, and 23.81±3.00 ms for the tissue (Fig. 1B). The effects of longer TEs on baseline signal and SNR were clearly observed in artery, vein, and tissue voxels with longer TEs reducing the baseline SNR (Figs. 1A, C). We observed peak saturations in the arterial voxel at TEs of 15, 17 and 20 ms (Fig. 1D-i), and in the venous voxel at TEs of 17 and 20 ms (Fig. 1D-ii).
Peak saturations lead to underestimations of arterial input function
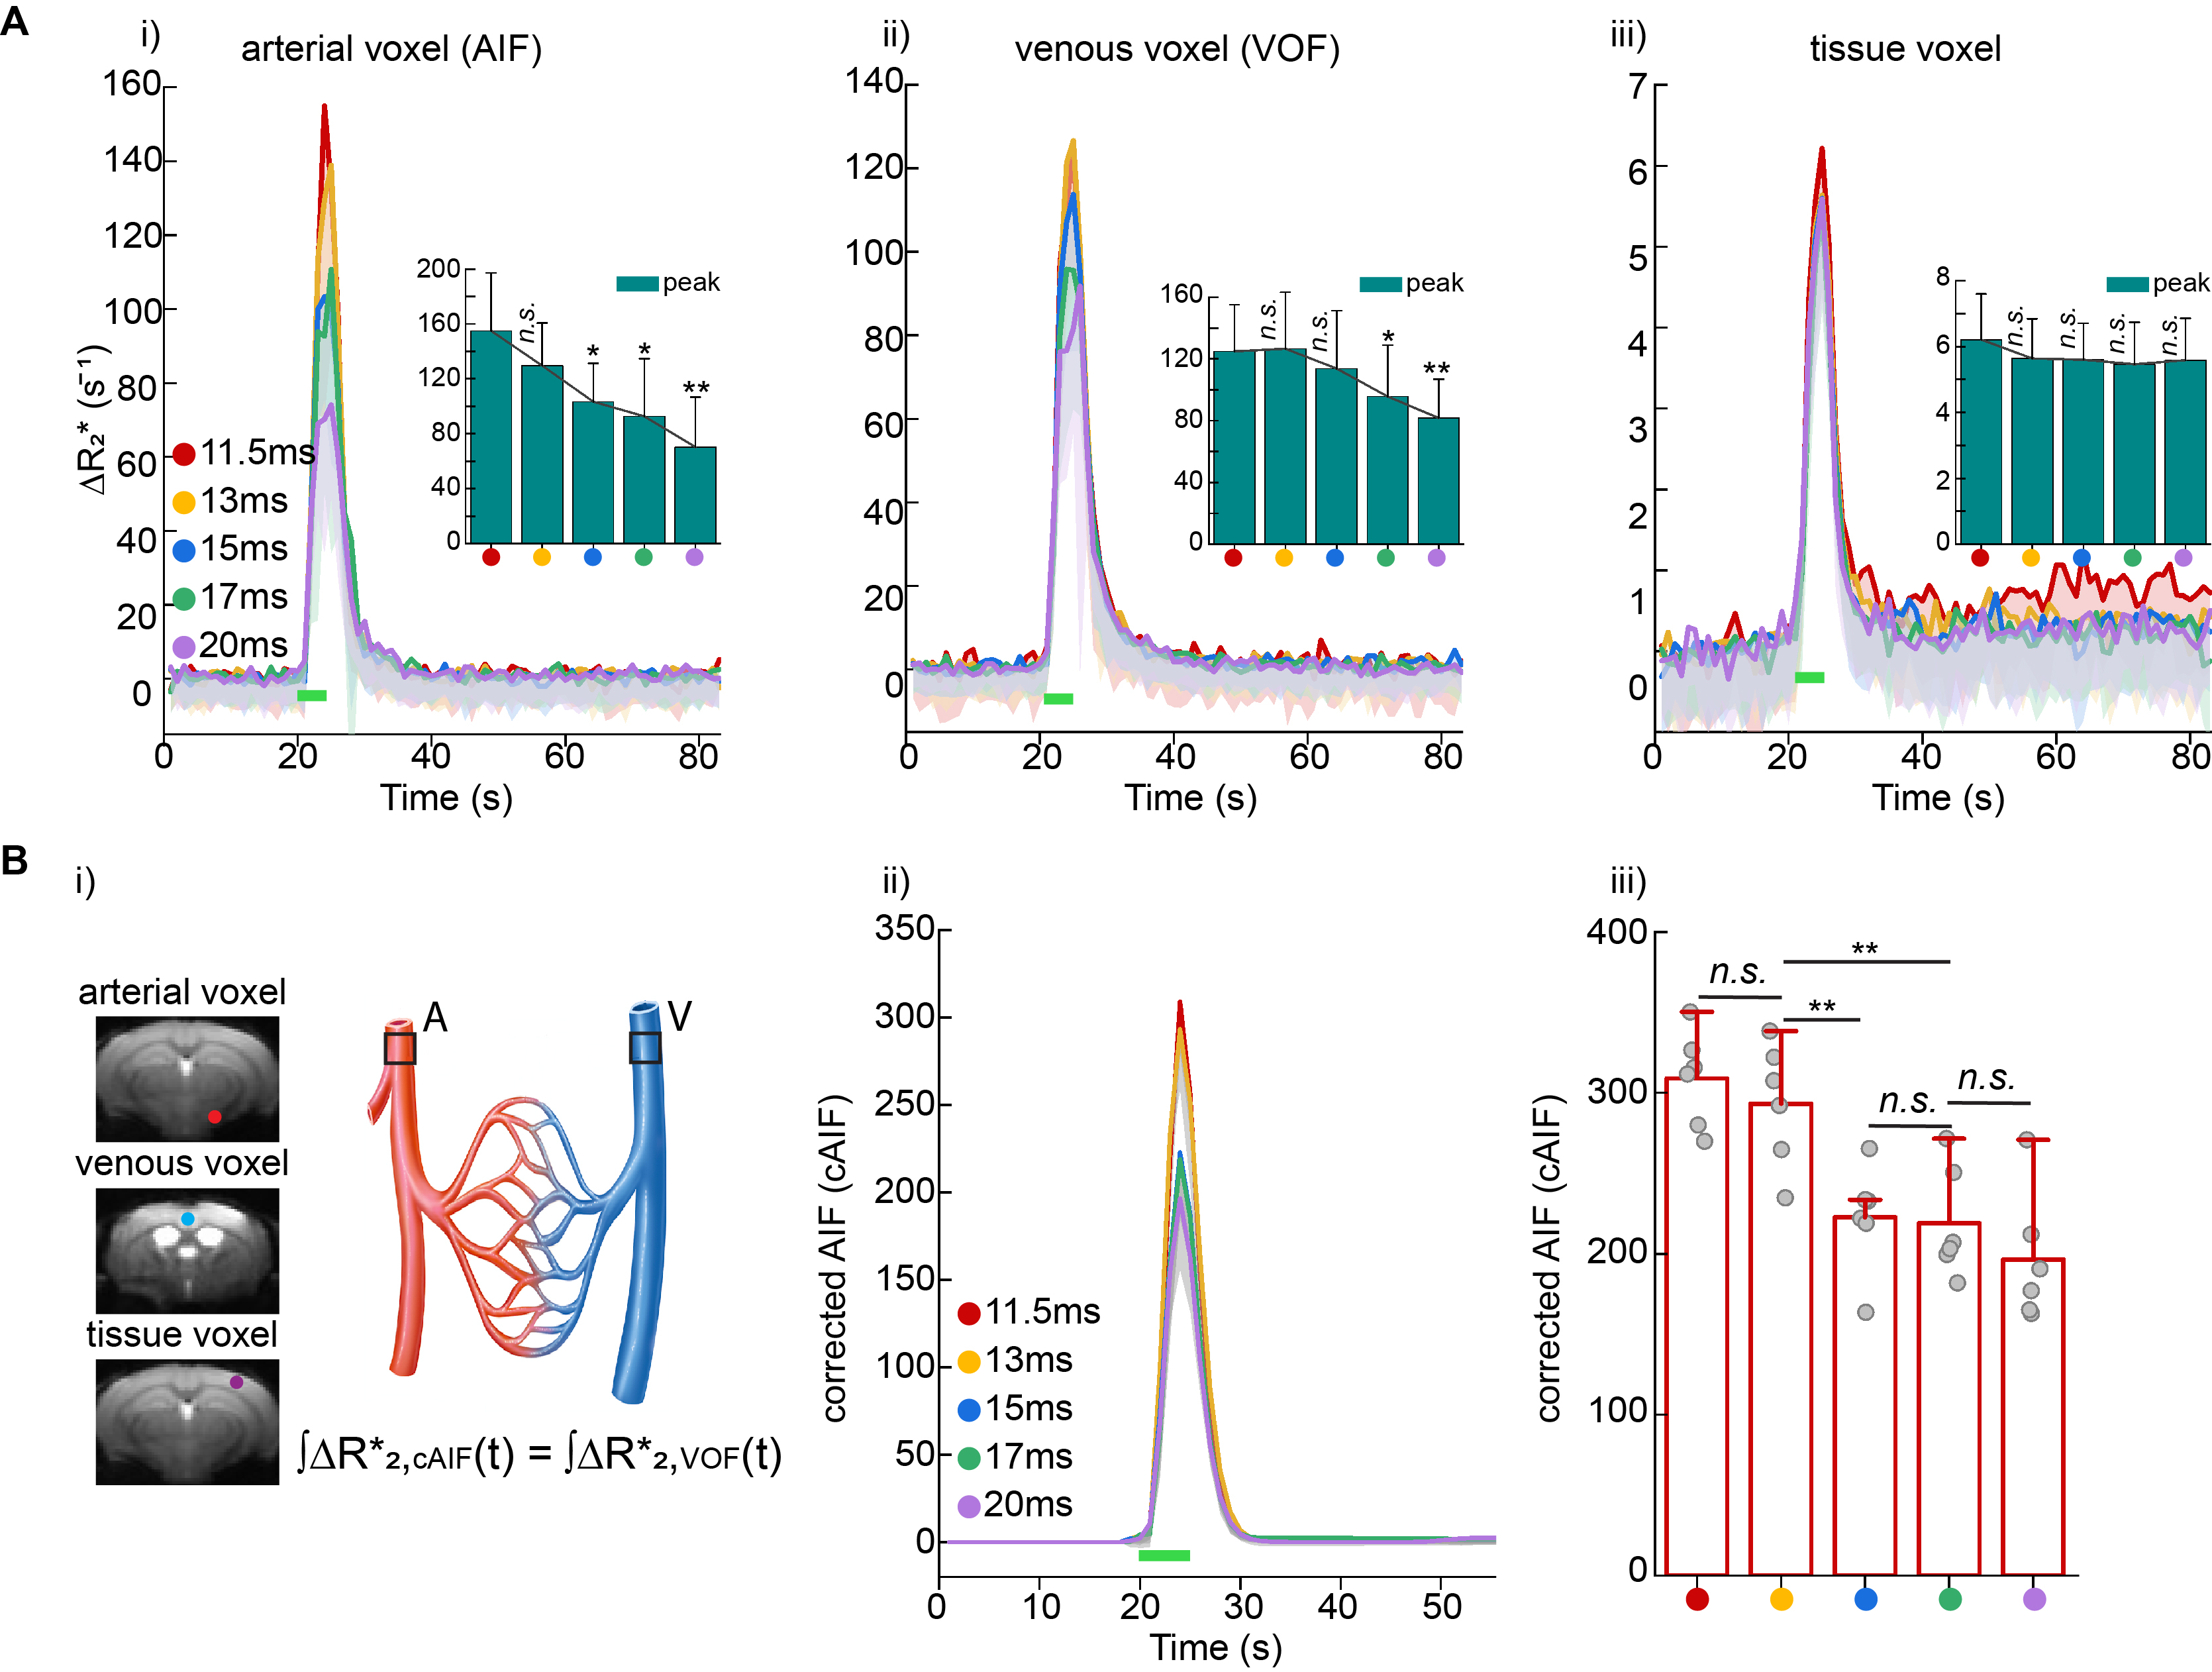
The signal time curves of the artery, vein and tissue were then converted to concentration time curves (ΔR*2). Noisy signal time curves from the artery and vein, acquired at longer TEs of 15ms, 17ms and 20 ms resulted in lower concentration time curves (Fig. 2A-i, ii), indicating that peak saturations at longer TEs cause underestimation of the arterial and venous concentration time curves. In contrast, at shorter TE values of 11.5 ms and 13 ms, significantly higher and similar concentration time curves were induced in the artery and vein. No significant differences were observed in the ΔR*2 curves obtained at all different TEs in tissue (Fig. 2A-iii). To remove partial volume effect of arterial voxel, the arterial ΔR*2 response was then normalized by the venous ΔR*2 response, resulting in a corrected AIF (Fig. 2B-i). We observed that the resulting corrected AIFs will be underestimated when the arterial and venous peak saturations occurred at longer TEs (Fig. 2B, i-ii).
Overestimations of perfusion metrics due to AIF underestimations
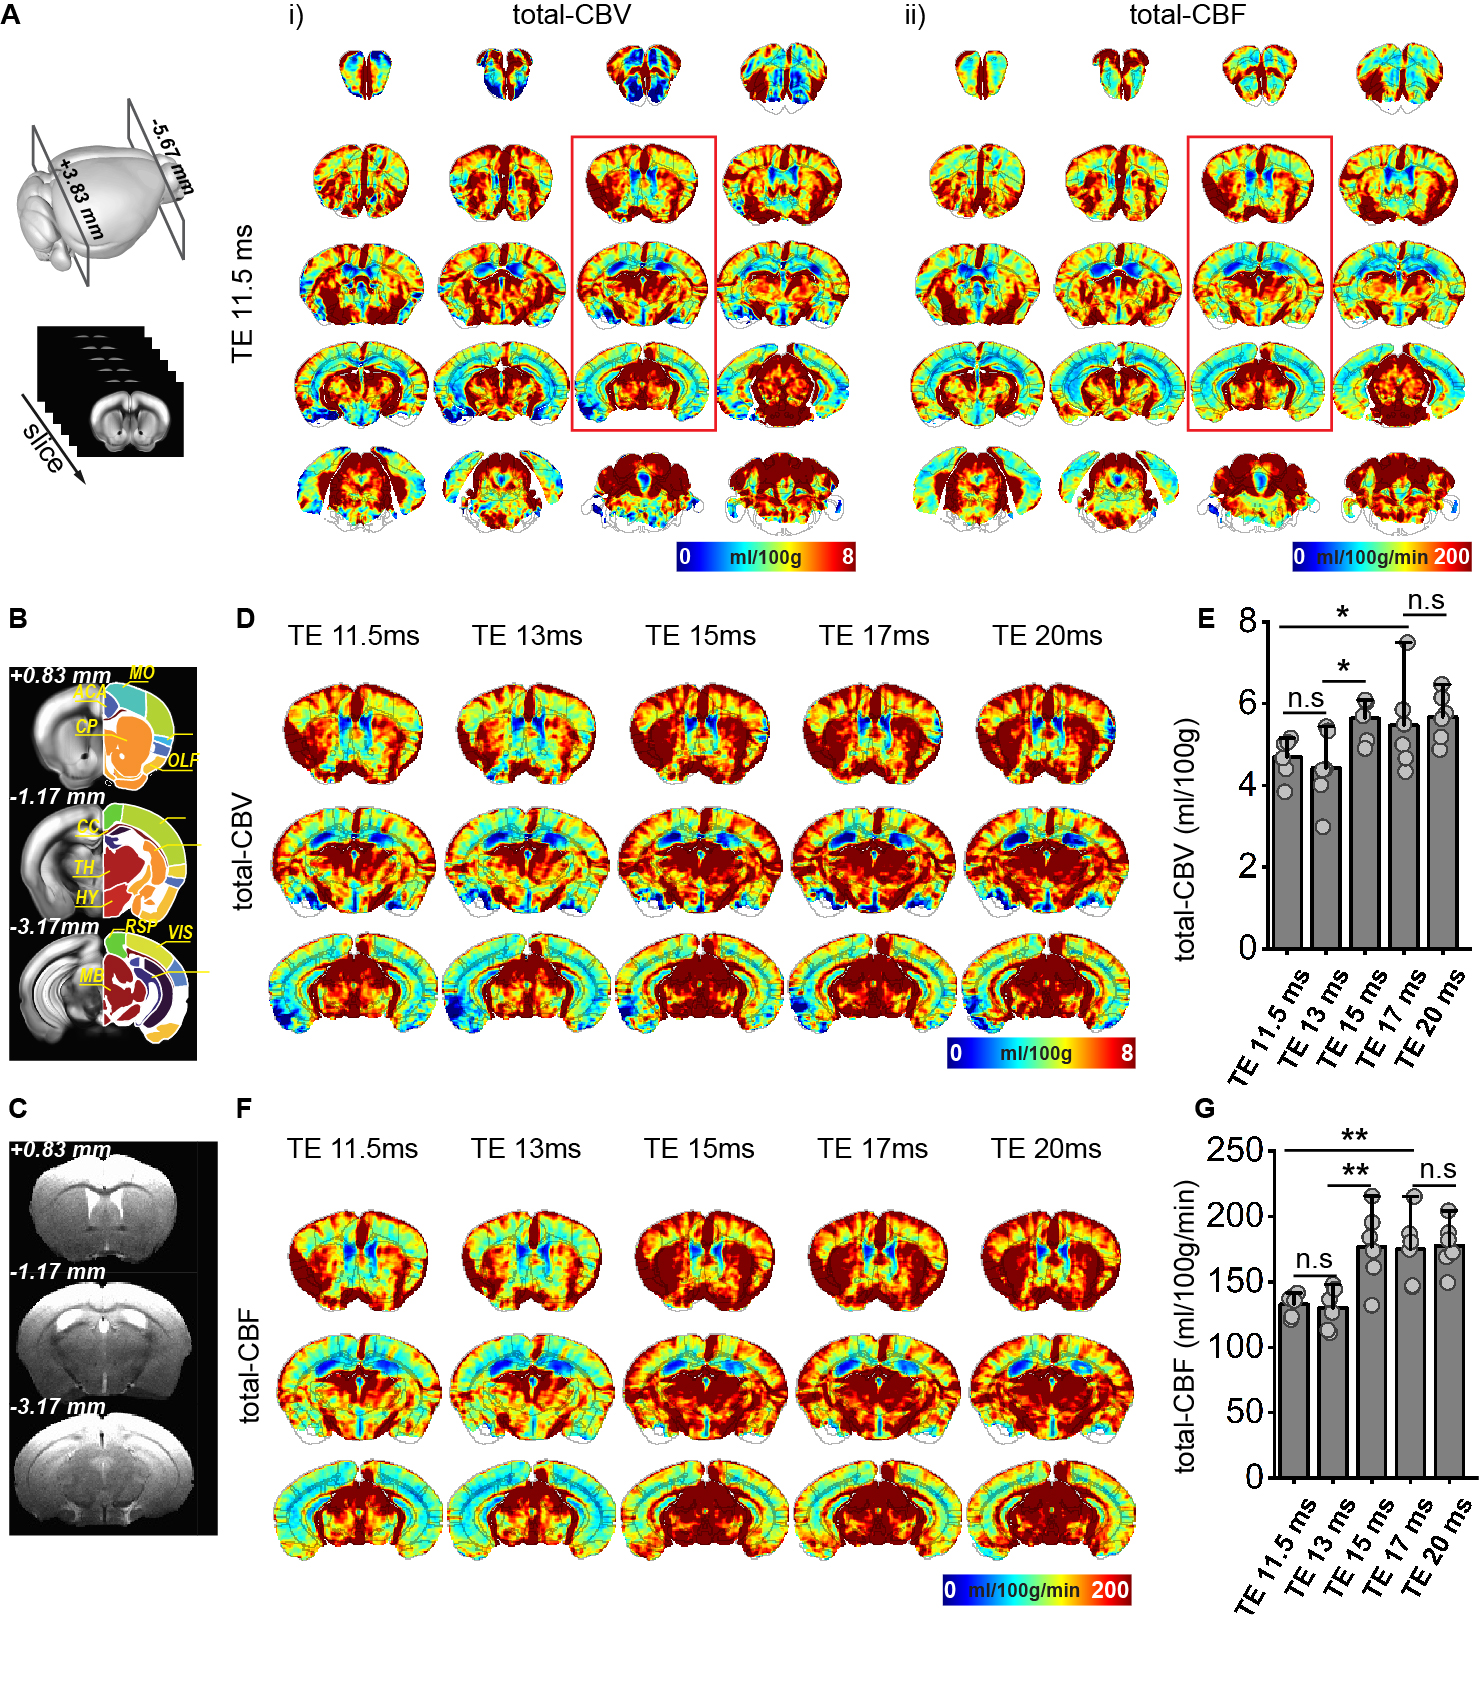
Hypoxia-induced GE-BOLD MRI signal changes were measured under various TEs, and subsequently converted into absolute CBV and CBF values with animal-specific corrected AIF3. To enhance clarity regarding the general patterns at these five TEs, we presented three selected slices of group-averaged maps for better visualization (Figs. 3, D, F). Our CBF values measured at TEs of 11.5 ms and 13 ms were similar and consistent with previous publications conducted under the same anesthetics5. Peak saturation of the AIF is a major source of systematic errors in the quantification of CBV and CBF in MRI2,4. Consequently, the calculated CBV and CBF under longer TEs (15 ms, 17 ms, and 20 ms) were increased (overestimated) as compared with those values of short TE (Figs. 3D-F).
Discussion and Conclusions
Our data demonstrates that a shorter TE results in fewer hypoxia-induced signal changes, while a longer TE leads to decreased baseline SNR and an increased risk of arterial signal saturation. The peak saturation of the AIF results in significant errors in the quantification of CBV and CBF and needs to be considered in DSC perfusion studies.Acknowledgements
This research was supported by the Institute of Basic Science (IBS-R015-D1).References
- Knutsson, L., Ståhlberg, F. & Wirestam, R. Aspects on the accuracy of cerebral perfusion parameters obtained by dynamic susceptibility contrast MRI: a simulation study. Magnetic resonance imaging 22, 789-798 (2004).
- Knutsson, L., Ståhlberg, F. & Wirestam, R. Absolute quantification of perfusion using dynamic susceptibility contrast MRI: pitfalls and possibilities. Magnetic Resonance Materials in Physics, Biology and Medicine 23, 1-21 (2010).
- Lee, D., Le, T. T., Im, G. H. & Kim, S.-G. Whole-brain perfusion mapping in mice by dynamic BOLD MRI with transient hypoxia. Journal of Cerebral Blood Flow & Metabolism, 0271678X221117008 (2022).
- Ellinger, R. et al. The impact of peak saturation of the arterial input function on quantitative evaluation of dynamic susceptibility contrast-enhanced MR studies. Journal of computer assisted tomography 24, 942-948 (2000).
- Munting, L. P. et al. Cerebral blood flow and cerebrovascular reactivity are preserved in a mouse model of cerebral microvascular amyloidosis. Elife 10 (2021).
Figures