1264
Iso-1.25mm Whole-cerebrum pCASL at 7T for Mapping Depth-dependent Cortical Gray Matter and Tract-specific White Matter Cerebral Blood Flow1Laboratory of FMRI Technology (LOFT), Mark & Mary Stevens Neuroimaging and Informatics Institute, Keck School of Medicine, University of Southern California, Los Angeles, CA, United States, 2Neuro Image Computing Research (NICR), Mark & Mary Stevens Neuroimaging and Informatics Institute, Keck School of Medicine, University of Southern California, Los Angeles, CA, United States, 3Department of Neurology, Keck School of Medicine, University of Southern California, Los Angeles, CA, United States
Synopsis
Keywords: Arterial Spin Labelling, Arterial spin labelling, 7T, Compressed Sensing
Motivation: Mapping CBF in the whole cerebrum extent at a microvascular level at 7T has been hampered by SNR, susceptibility artifacts, BOLD effect, and field inhomogeneity.
Goal(s): We aim to achieve an isotropic 1.25 whole cerebrum pCASL imaging.
Approach: We developed a pCASL sequence which incorporates recent optimizations of labeling and background suppression and a 3D TFL readout. Poisson-disc undersampling and compressed sensing were used to improve image quality.
Results: CBF mapping with high SNR and resolution was achieved, revealing depth-dependent CBF and an inverse relationship between tract-specific CBF and fractional anisotropy.
Impact: The proposed pCASL imaging technique will impact neuroscientists by enabling fine-grained mapping of CBF at microvascular level in cortical gray matter and white matter at 7T.
Background
Cerebral blood flow(CBF) mapping using Arterial Spin Labeling(ASL) at microvascular level is limited by spatial resolution and signal-to-noise ratio. The advent of 7T mitigates the limitations with increased sensitivity(SNR) and prolonged T1 relaxation times. However, higher resolution ASL at 7T has been hampered by technical challenges. Previous studies that have acquired high resolution whole-brain ASL using EPI[1] and GRASE[2] sequences were prone to susceptibility artifacts, BOLD effect, and sub-optimal labeling method (PASL) or efficiency due to field inhomogeneities. Building upon recent studies[3,4], which combined optimized pCASL labeling, robust background suppression(BS), and distortion-free 3D TFL readout, this work aims to achieve an isotropic 1.25mm whole-cerebrum pCASL imaging with compressed sensing(CS), which may enable mapping of depth-dependent cortical gray matter and tract-specific white matter CBF.Methods
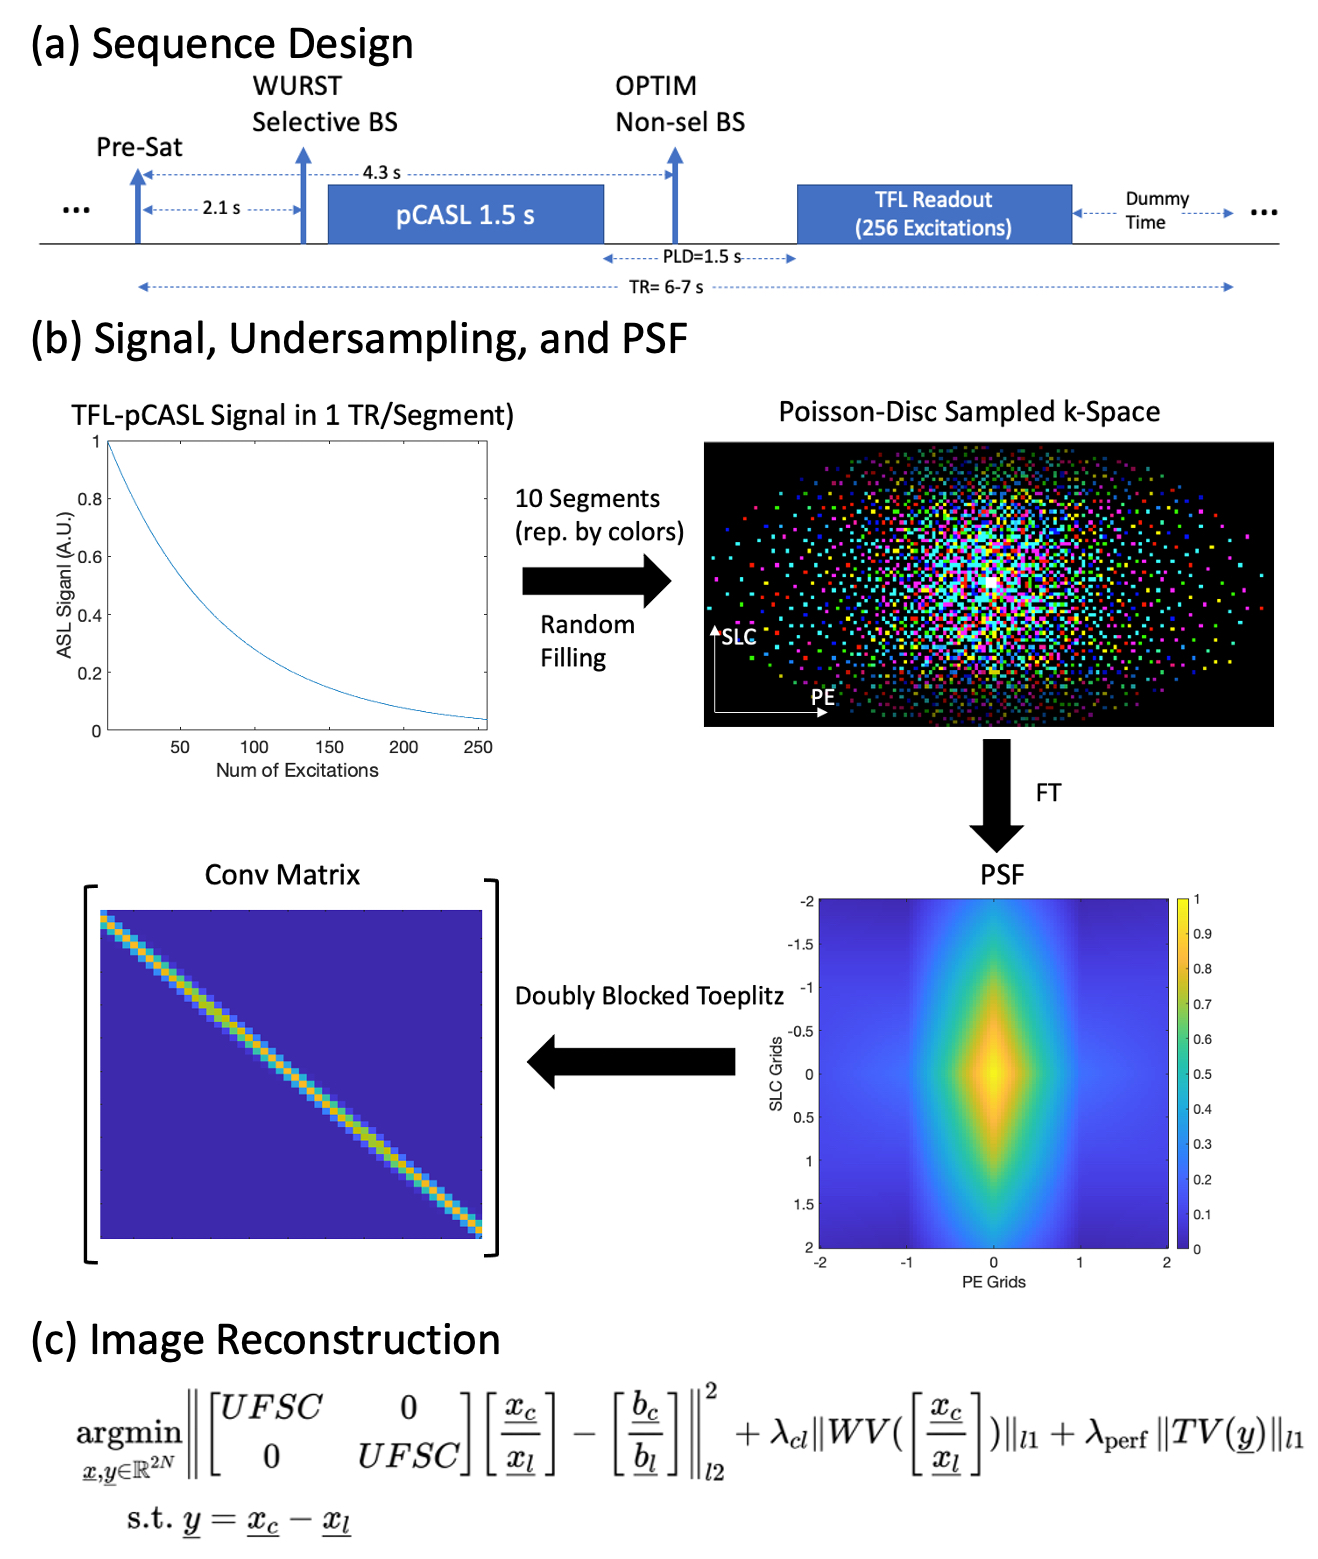
A centric-ordered 3D TFL readout with Poisson-disc undersampling (R=4.5) was employed for the pCASL sequence. BS, emphasizing on CSF, was achieved using a selective WURST pulse[5] before and a non-selective OPTIM BS pulse[6] after labeling. The undersampled k-space was randomly segmented into 10 segments to prevent excessive decay of ASL signal. Point spread function(PSF) was estimated, according to blood T1 and T2 values, from the undersampled k-space through a sequence of interpolation, smoothing, IFFT, and later formulated as a doubly blocked toeplitz matrix. Figure1(c), where matrix U, F, S, and C denote undersampling, FFT, sensitivity, and convolutional blurring, respectively, describes the reconstruction that deblurred ASL control(xc) and label(xl) images were simultaneously solved from undersampled k-space data(b) employing CS. This reconstruction leverages sparsity in Wavelet and TV transforms of ASL and perfusion images(y), respectively.Under the approval of a local IRB, four healthy subjects (3M, age=27.2±1.5 yrs) underwent MRI scan on a 7T Siemens Terra scanner with a NOVA 8Tx/32Rx head coil within the first level SAR. A standard 0.7mm3 T1w MP2RAGE was acquired and used to place labeling plane at C1 segment of the internal carotid arteries. pCASL labeling parameters were: labeling duration=1.5s, post labeling delay=1.5s, RF duration=300 us, RF gap=250 us, average/maximum gradient=0.04/0.586 mT/m, and flip angle=15°. A phase-cycled pCASL pre-scan was employed in 2mins using 2D single-slice TFL readout (3x3x10mm) to correct phase accrual of pCASL due to off-resonance[7]. Isotropic 1.25mm pCASL imaging was acquired with the following imaging parameters: FOV=220×200×100mm, matrix size=176×160×80, echo spacing=6.5ms, TE=3ms, TR=6-7s, FA=8°, 10 segments, and 10 control/label pairs acquired in 20-23mins. A separate M0 was obtained by acquiring a fully sampled central k-space region (176x40x20) in 8.2s. DTI (whole brain, iso-1.5mm, 99 directions, 11mins) of 1 subject was also acquired.
Image reconstruction was performed offline using an in-house MATLAB program employing FISTA and ADMM algorithms, where λcl=4e-3 and λperf=5e-6. CBF maps were calculated as described by[4]. Cortical surfaces and depths were reconstructed using the recon-all pipeline in Freesurfer[8] on the T1w volume. DTI was processed using HCP pipeline[9] to obtain fractional anisotropy (FA) and tractography. Registrations between CBF and other volumes were done in Freesurfer.
Results
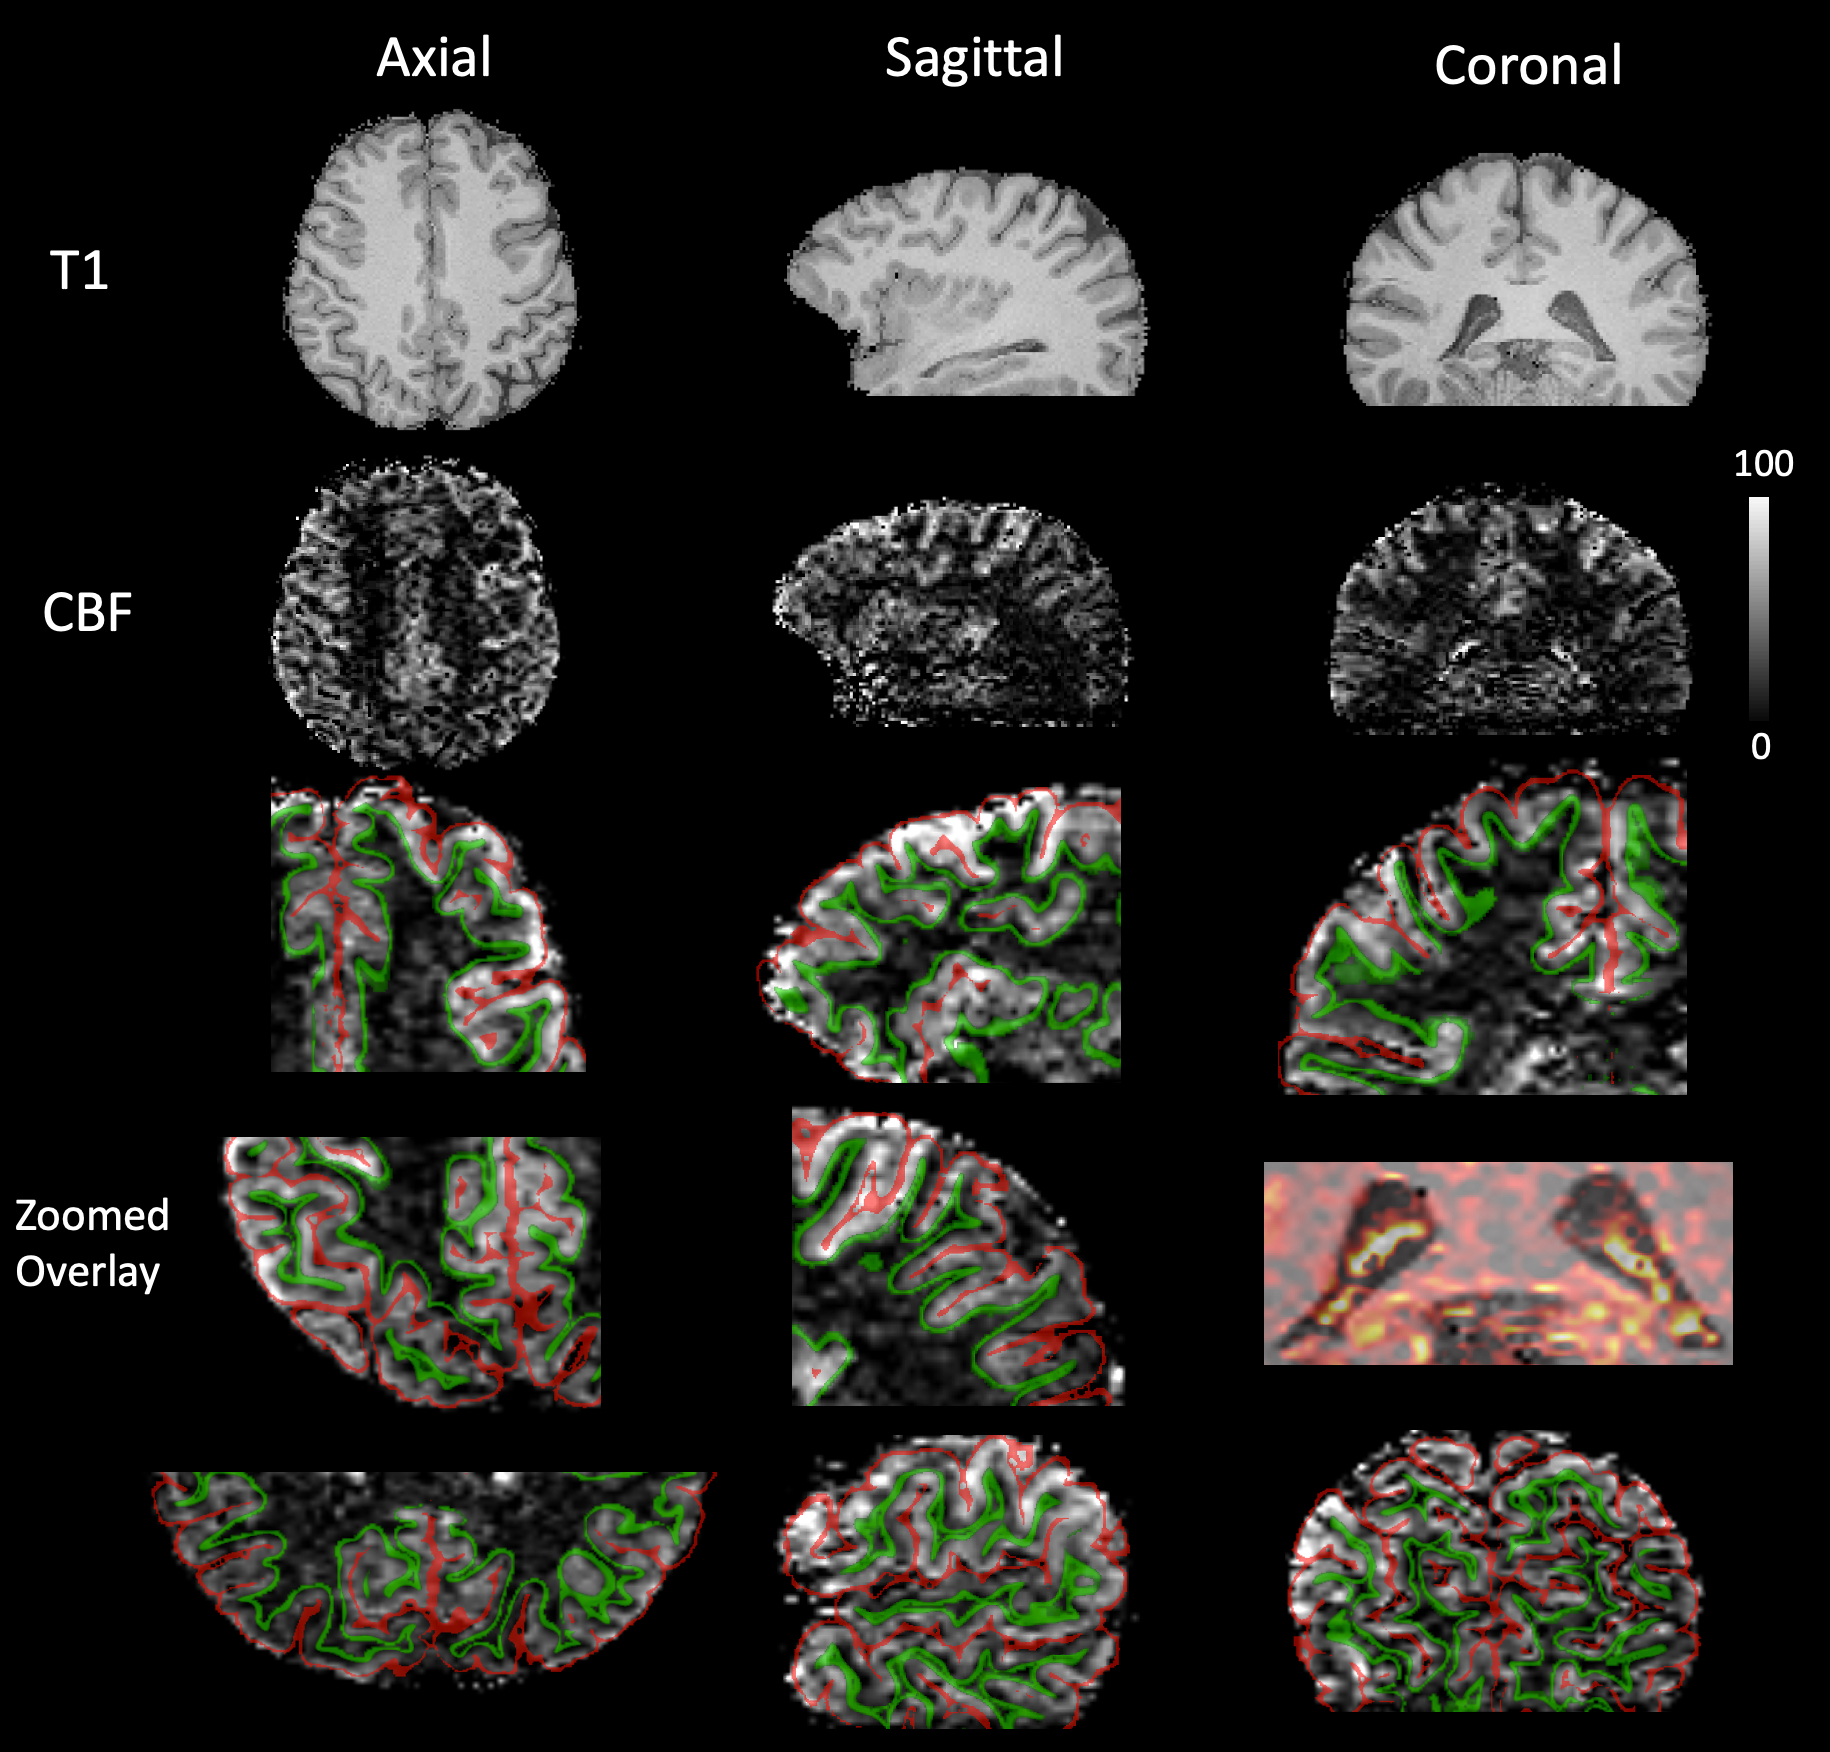
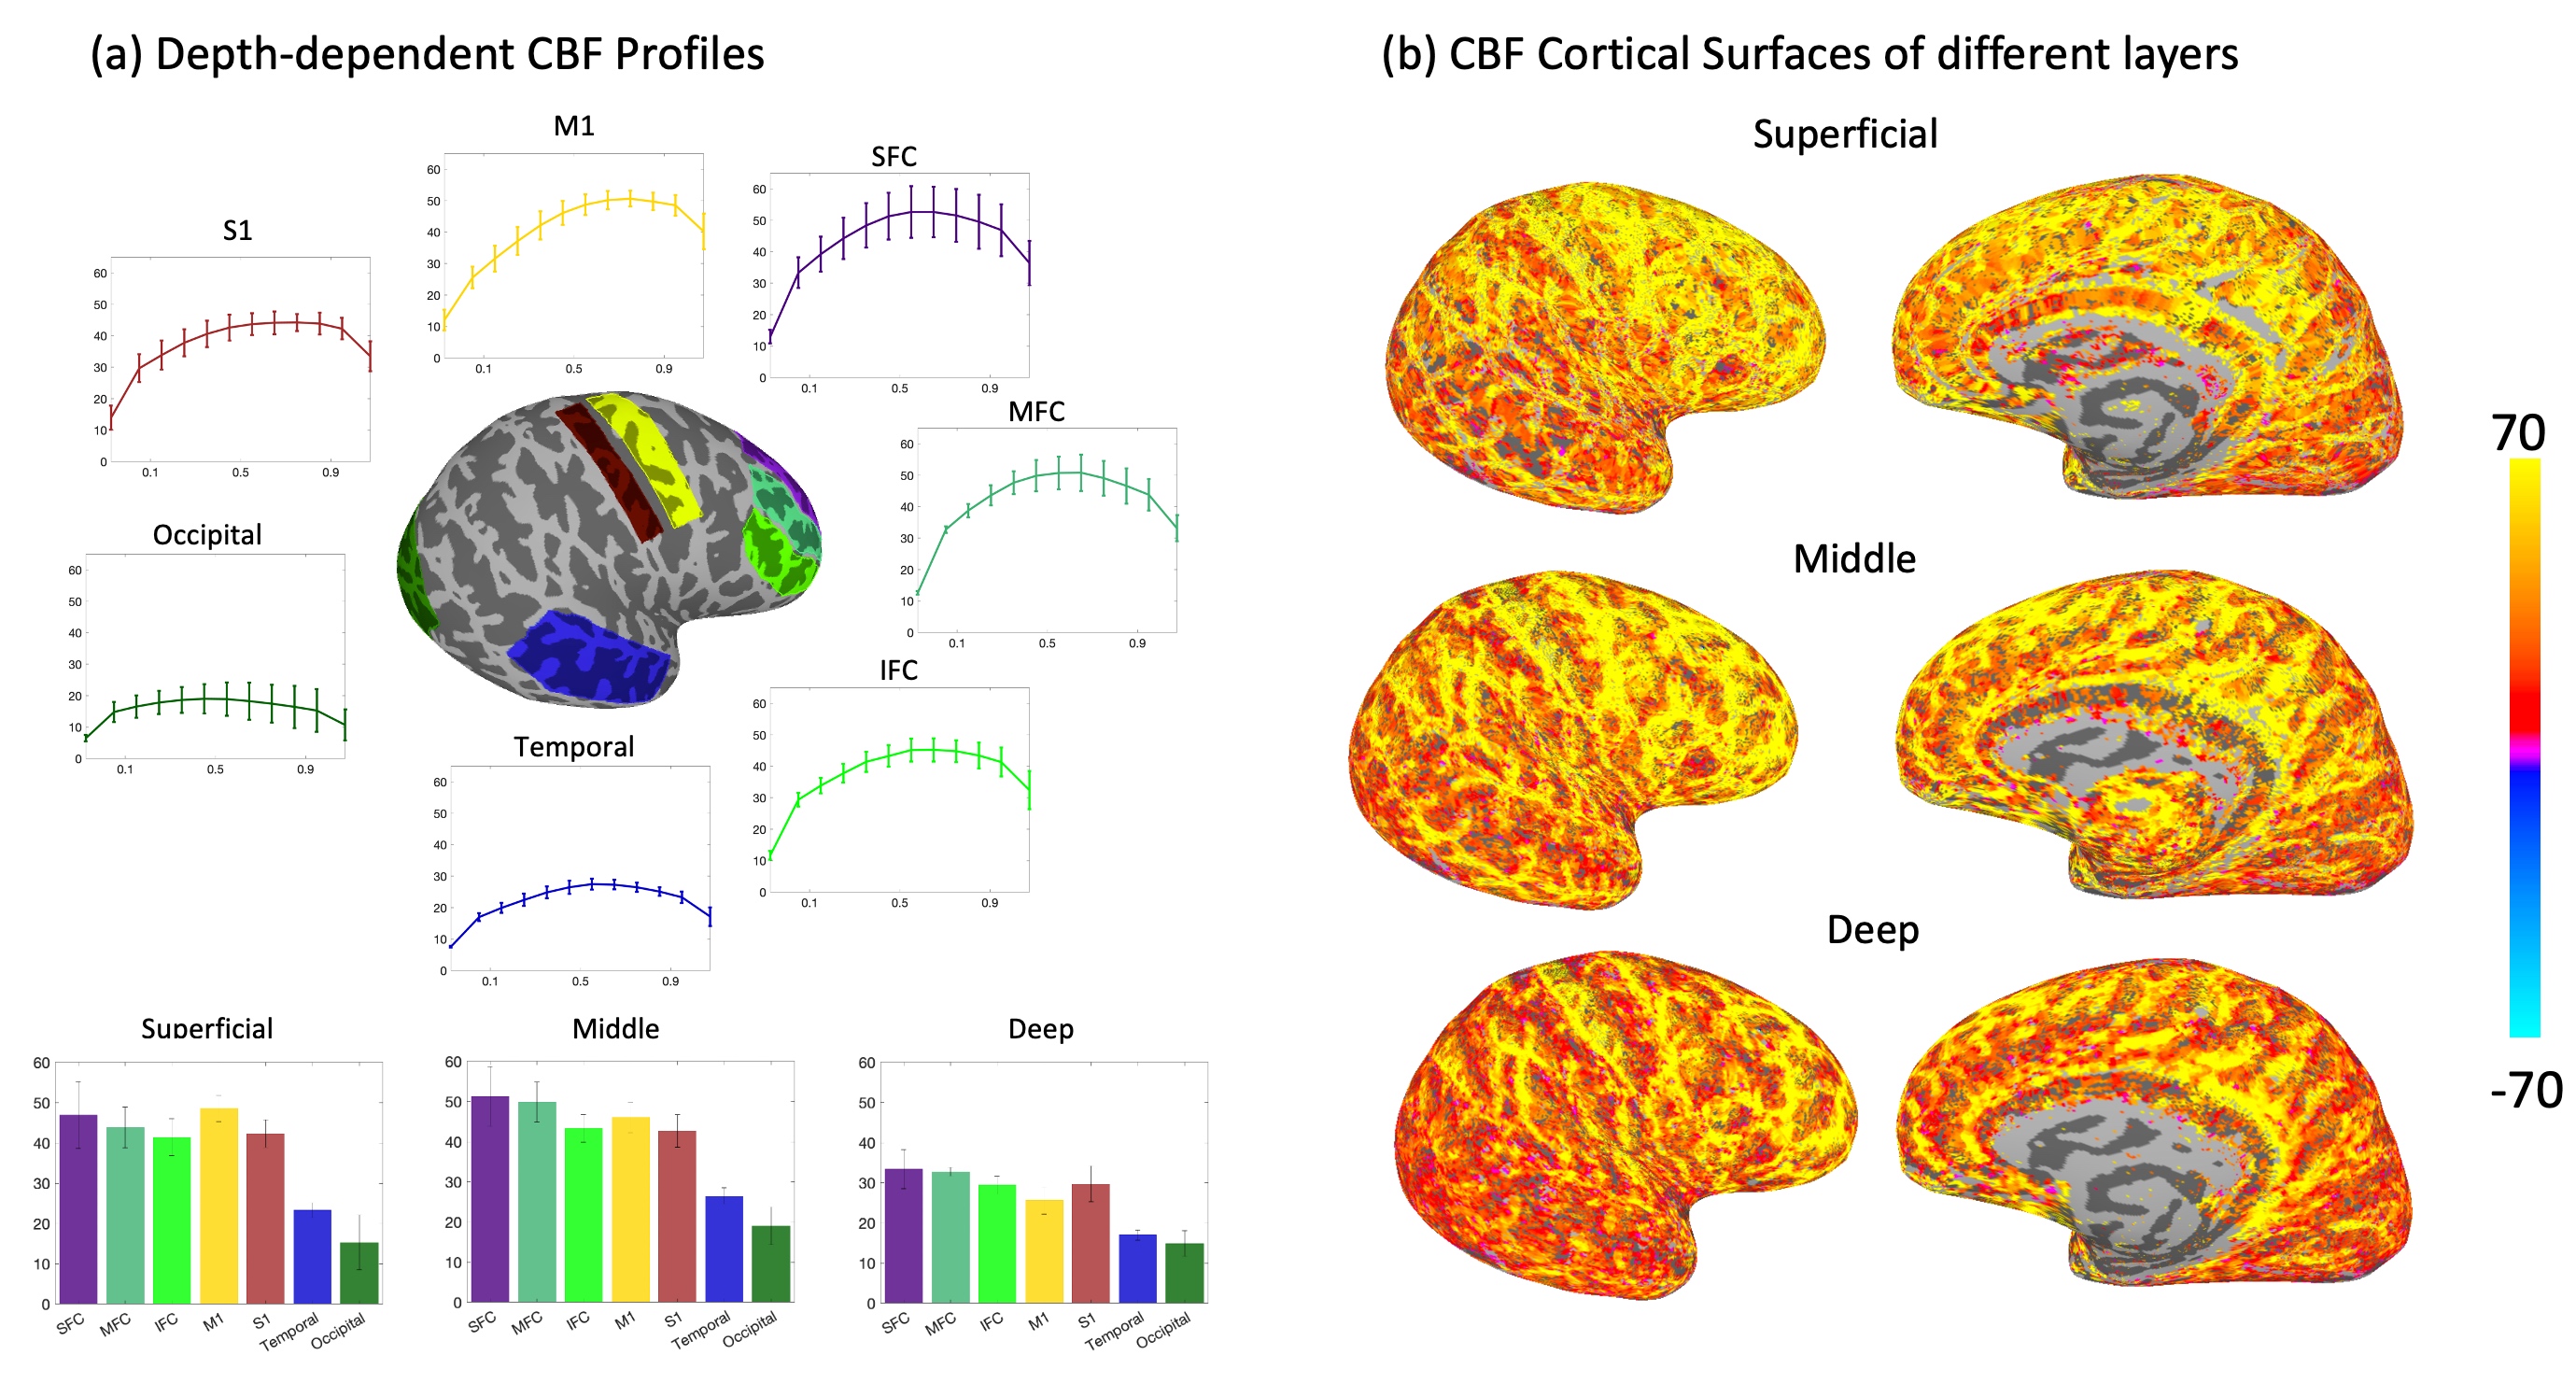
Figure 2 presents CBF maps with high SNR and resolution from a representative subject, demonstrating excellent anatomical fidelity across all views. The zoomed CBF maps highlight the detailed delineation of the superior, middle, and inferior frontal cortex, primary motor(M1) and somatosensory(S1) areas, as well as frontal and occipital cortical regions, and the visual cortex, with clear demarcation of white matter and CSF boundaries. Additionally, the choroid plexus (overlaid on T1w) is distinctly visualized due to the enhanced resolution.Figure 3(a) displays CBF profiles across various cortical depths, revealing a distinct pattern: the middle layer generally exhibits the highest CBF across all examined regions, including the SFC, MFC, IFC, M1, S1, and the temporal and occipital areas. These profiles also suggest that superficial layers receive more blood flow than the deeper layers. Notably, the temporal and occipital regions display significantly lower CBF levels compared to the others. Complementing these observations, a mapping of CBF across the cortical surface from the superficial to the deep layer is shown in Figure 3(b).
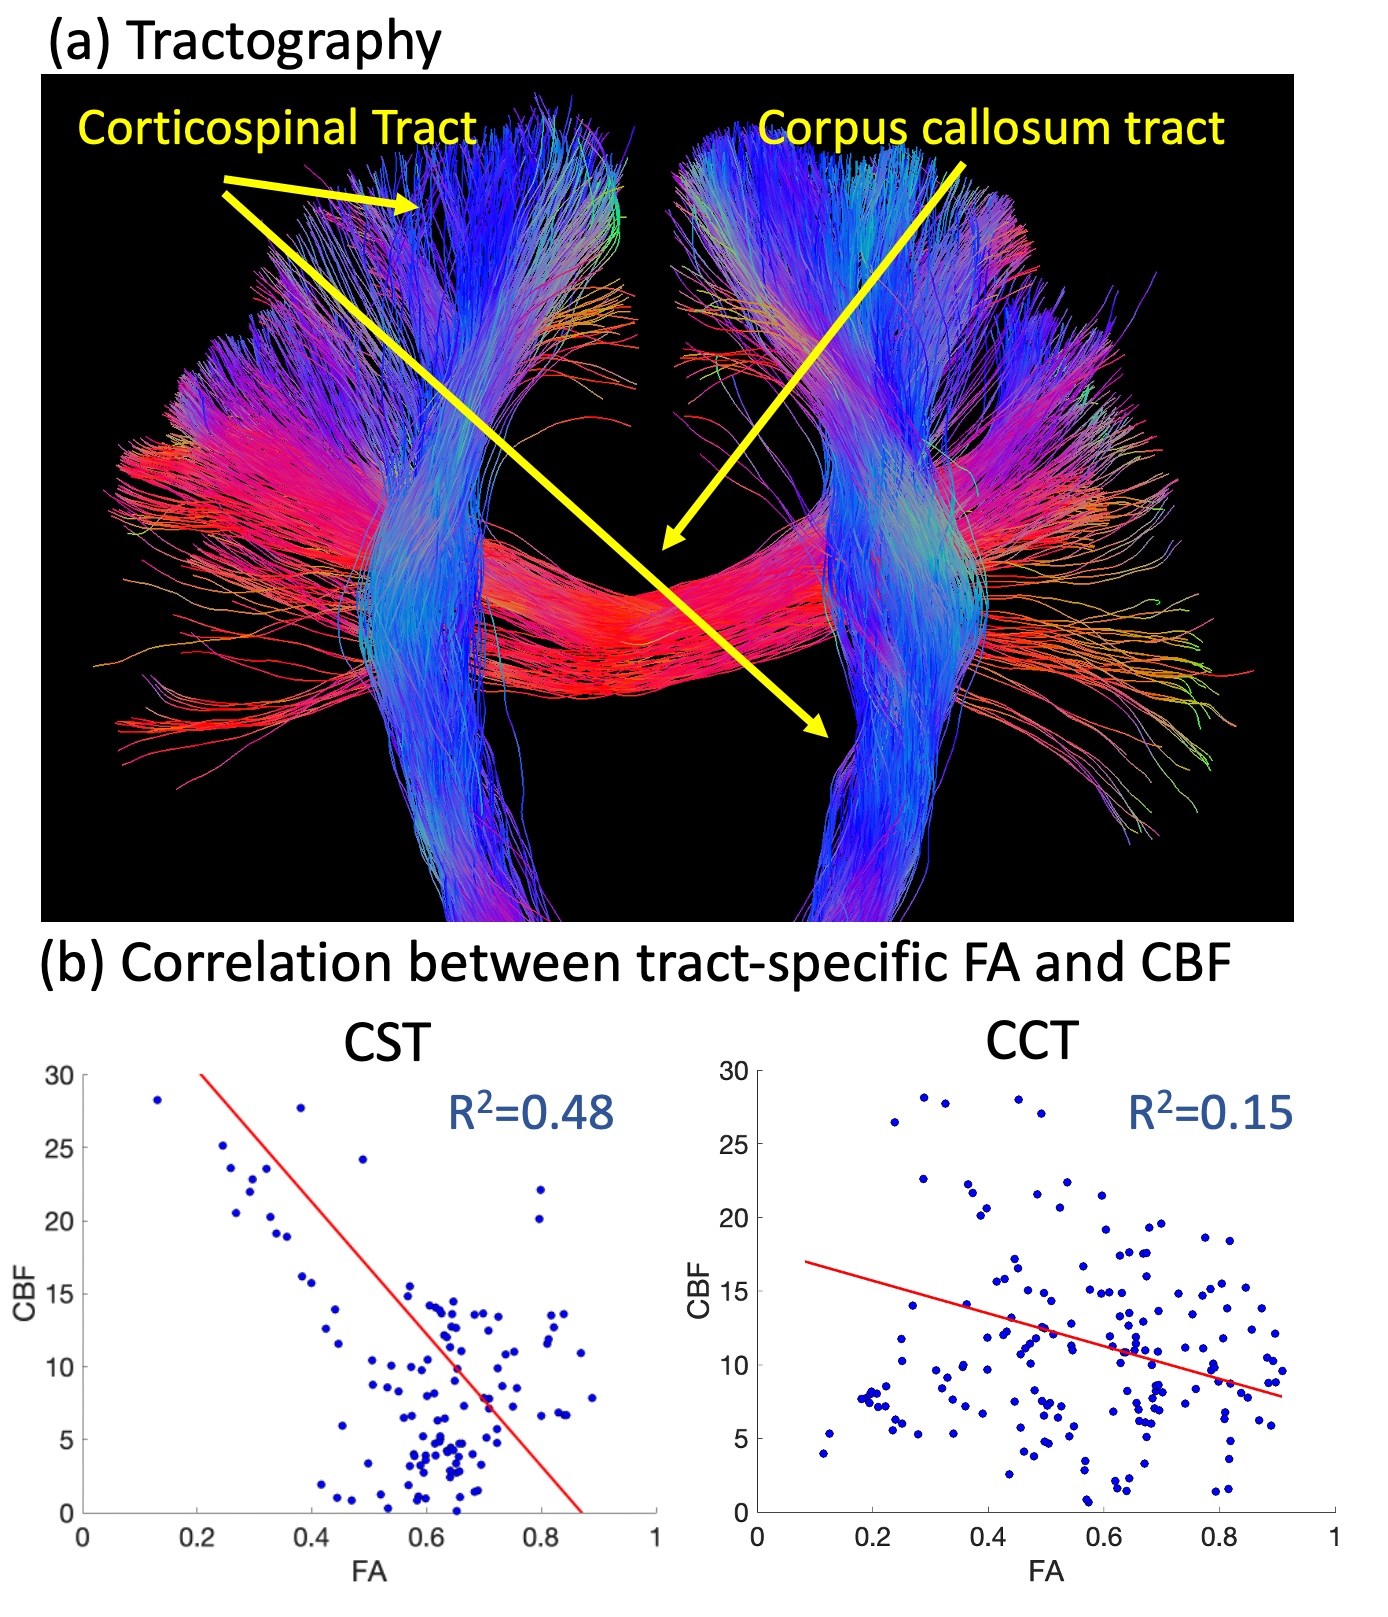
Figure 4(a) displays in-vivo tractography of Corticospinal(CST) and Corpus callosum(CCT), where average CBF and FA values were calculated on each fiber tract. The scatter plot in Fig4(b) suggests that fiber tracts with higher FA values tend to have lower CBF, and vice versa.
Conclusion
The study demonstrates the potential of iso-1.25mm whole cerebrum TFL-pCASL imaging with CS reconstruction at 7T for fine-grained CBF mapping across cortical depths and tract-specific white matter. Enhanced SNR and resolution allowed for precise visualization of CBF, revealing the depth-dependent and regional variations. Additionally, an inverse relationship between FA values and CBF in fiber tracts was observed.Acknowledgements
This work is supported by US NIH grants R01-EB032169 and R01-EB028297.References
[1] S. Kashyap, D. Ivanov, M. Havlicek, L. Huber, B. A. Poser, and K. Uludağ, “Sub-millimetre resolution laminar fMRI using Arterial Spin Labelling in humans at 7 T,” PLOS ONE, vol. 16, no. 4, p. e0250504, Apr. 2021, doi: 10.1371/journal.pone.0250504.
[2] X. Shao, S. M. Spann, K. Wang, L. Yan, S. Rudolf, and D. Wang, “High-resolution whole brain ASL perfusion imaging at 7T with 12-fold acceleration and spatial-temporal regularized reconstruction,” Proc. Intl. Soc. Mag. Reson. Med. 28, 2020, Accessed: Nov. 04, 2023. [Online]. Available: https://cds.ismrm.org/protected/20MProceedings/PDFfiles/0023.html
[3] K. Wang et al., “Optimization of pseudo-continuous arterial spin labeling at 7T with parallel transmission B1 shimming,” Magnetic Resonance in Medicine, vol. 87, no. 1, pp. 249–262, 2022, doi: 10.1002/mrm.28988.
[4] C. Zhao et al., “Whole-Cerebrum distortion-free three-dimensional pseudo-continuous arterial spin labeling at 7T,” NeuroImage, vol. 277, p. 120251, Aug. 2023, doi: 10.1016/j.neuroimage.2023.120251.
[5] K. Wang, X. Shao, L. Yan, S. J. Ma, J. Jin, and D. J. J. Wang, “Optimization of adiabatic pulses for pulsed arterial spin labeling at 7 tesla: Comparison with pseudo-continuous arterial spin labeling,” Magnetic Resonance in Medicine, vol. 85, no. 6, pp. 3227–3240, 2021, doi: 10.1002/mrm.28661.
[6] C. Graf, M. Soellradl, C. S. Aigner, A. Rund, and R. Stollberger, “Advanced design of MRI inversion pulses for inhomogeneous field conditions by optimal control,” NMR in Biomedicine, vol. 35, no. 11, p. e4790, 2022, doi: 10.1002/nbm.4790.
[7] G. Saib et al., “Time-of-flight angiography at 7T using TONE double spokes with parallel transmission,” Magnetic Resonance Imaging, vol. 61, pp. 104–115, Sep. 2019, doi: 10.1016/j.mri.2019.05.018.
[8] “Freesurfer v6.0.” Accessed: Nov. 04, 2023. [Online]. Available: https://github.com/freesurfer/freesurfer/tree/fs-6.0
[9] “HCPpipelines v4.7.0.” Accessed: Nov. 04, 2023. [Online]. Available: https://github.com/Washington-University/HCPpipelines/releases/tag/v4.7.0
Figures