1262
High-Fidelity ASL Perfusion Imaging Using Unsuppressed Water Signals in MR Spectroscopic Imaging1Siemens Medical Solutions USA, Inc., Urbana, IL, United States, 2Beckman Institute for Advanced Science and Technology, University of Illinois at Urbana-Champaign, Urbana, IL, United States, 3Laboratory of FMRI technology (LOFT), USC Mark and Mary Stevens Neuroimaging and Informatics Institute, Keck School of Medicine, University of Southern California, Los Angeles, CA, United States, 4National Center for Supercomputing Applications, University of Illinois at Urbana-Champaign, Urbana, IL, United States, 5Department of Electrical and Computer Engineering, University of Illinois at Urbana-Champaign, Urbana, IL, United States, 6School of Biomedical Engineering, Shanghai Jiao Tong University, Shanghai, China, 7Department of Bioengineering, University of Illinois at Urbana-Champaign, Urbana, IL, United States
Synopsis
Keywords: Arterial Spin Labelling, Arterial spin labelling, Spectroscopy
Motivation: ASL and MRSI experiments are currently performed using different sequences, and EPI-based ASL methods suffer from spatial distortion and limited SNR.
Goal(s): To develop a water unsuppressed MRSI based imaging method for high-fidelity ASL-based perfusion imaging.
Approach: The SPICE sequence was integrated with a PASL module for ASL acquisition, and a GS model-based method was used for image reconstruction.
Results: The proposed method achieved ASL at 2×2×2 mm3 resolution and MRSI at 2×3×3 mm3 within 9 minutes in total. Compared with typical EPI-based methods, the resulting ASL images were free from spatial distortion, and had adequate SNR within a short scan time.
Impact: This work presents a new method for high-fidelity ASL-based perfusion imaging combining with MRSI-based metabolic imaging. With further development, it may provide a powerful brain imaging tool for both functional studies and clinical applications.
Introduction
ASL-based perfusion imaging and MRSI-based metabolic imaging provide complementary information of the brain noninvasively. Combining both modalities has shown significant potential in applications like tumor classification and stroke characterization.1,2 However, both imaging techniques share some common technical limitations, including limited SNR, resolution, and long acquisition time.3,4 In particular, typical ASL methods that employ echo-planar trajectories are susceptible to image distortions at air/tissue interfaces, compromising image quality and complicating analysis with other imaging modalities.4Recently, a water-unsuppressed MRSI technique known as SPICE has demonstrated the capability of simultaneous high-resolution metabolic imaging and water imaging (such as susceptibility mapping and diffusion imaging).5-7 Building on the progress of SPICE, this work aims to synergistically integrate ASL with MRSI to enable fast, distortion-free ASL with good SNR. Integrating SPICE sequence for MRSI acquisition, the proposed method successfully achieved high-fidelity perfusion imaging at 2×2×2 mm3 and metabolic imaging at 2×3×3 mm3 within 9 minutes.
Methods
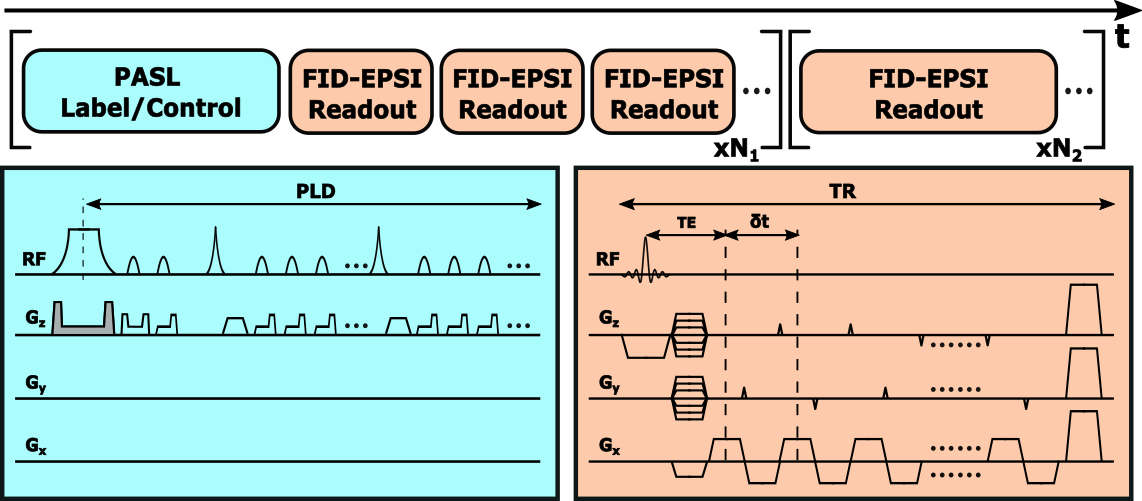
As illustrated in Figure 1, the proposed sequence includes two acquisition components. One is the FID-EPSI module, which follows the basic SPICE sequence for MRSI acquisition, including no water-suppression, short-TR FID-based acquisition (160 ms), EPSI trajectory for fast readout, and blipped gradients for sparse sampling.6-9 The other component is the PASL module for perfusion contrast. This PASL module follows the Q2TIPS design,10 including two pre-saturation pulses, one FOCI pulse for spin inversion,11 two hyperbolic-secant pulses for background suppression, and a train of saturation pulses to define bolus duration. The FID-EPSI module is also used for the ASL signal acquisition, but with a shorter TR (55 ms). Blipped gradients are utilized to cover ky phase encodings within each TR, while FID-EPSI readouts in different TRs are acquired to cover kz after each PASL module.Current implementation of this sequence has the following parameters: FOV: 240×240×72 mm3; flip angle: 27°; echo-spacing: 1.76 ms; TE: 1.6 ms; TI1/TI2: 700/1800 ms; TR: 160/55 ms (MRSI/ASL); resolution: 2×3×3/2×2×2 mm3 (MRSI/ASL); scan time: 6.5 min/4.2s per repetition (MRSI/ASL). For scans on CBF mapping, 36 ASL repetitions were acquired in 2.5 min. For resting-state functional scans, 120 repetitions were acquired in 8.5 min. The in vivo experiments were carried on healthy volunteers on a 3T MR system (MAGNETOM Prisma, Siemens Healthcare, Erlangen, Germany) under local IRB approval.
Since ASL and MRSI signals are acquired using the same FID-EPSI readouts except TR differences, it’s assumed they share similar spatiotemporal patterns and can be modelled using a generalized series (GS) model.12 Specifically, the ASL signals of one repetition ($$$\rho_a(\boldsymbol{x},t)$$$) and MRSI water signals ($$$\rho_r(\boldsymbol{x},t)$$$) are assumed to follow the GS model:
$$\rho_a(\boldsymbol{x},t)=\rho_r(\boldsymbol{x},t)\sum_{n=-N/2}^{N/2}c_n(\boldsymbol{x})e^{i2{\pi}nt/{\Delta}T}$$
where $$$N$$$ denotes the model order, $$$c_n(\boldsymbol{x})$$$ the GS coefficients capturing spatial variations caused by T1 weighting and spin labeling. The reconstruction from measured ASL data can be done by solving the optimization problem:
$$\hat{c}={\arg}{\min_c}\left\|{d-{\Omega}FS(G(\rho_r)c)}\right\|_2^2+R(c)$$
where $$$c$$$ and $$$\rho_r$$$ are the vector forms of {$$$c_n(\boldsymbol{x})$$$} and $$$\rho_r(\boldsymbol{x},t)$$$ , $$${\Omega},F,S,G,R$$$ are operators representing (k,t)-space sampling, Fourier transform, coil sensitivity, GS modeling, and regularization, respectively. After reconstruction repetition-by-repetition, the calculation of label/control difference signals (ΔM) and quantification of CBF follows the typical ASL processing pipeline.13 The processing of MRSI data follows the SPICE processing methods.6-9
Results
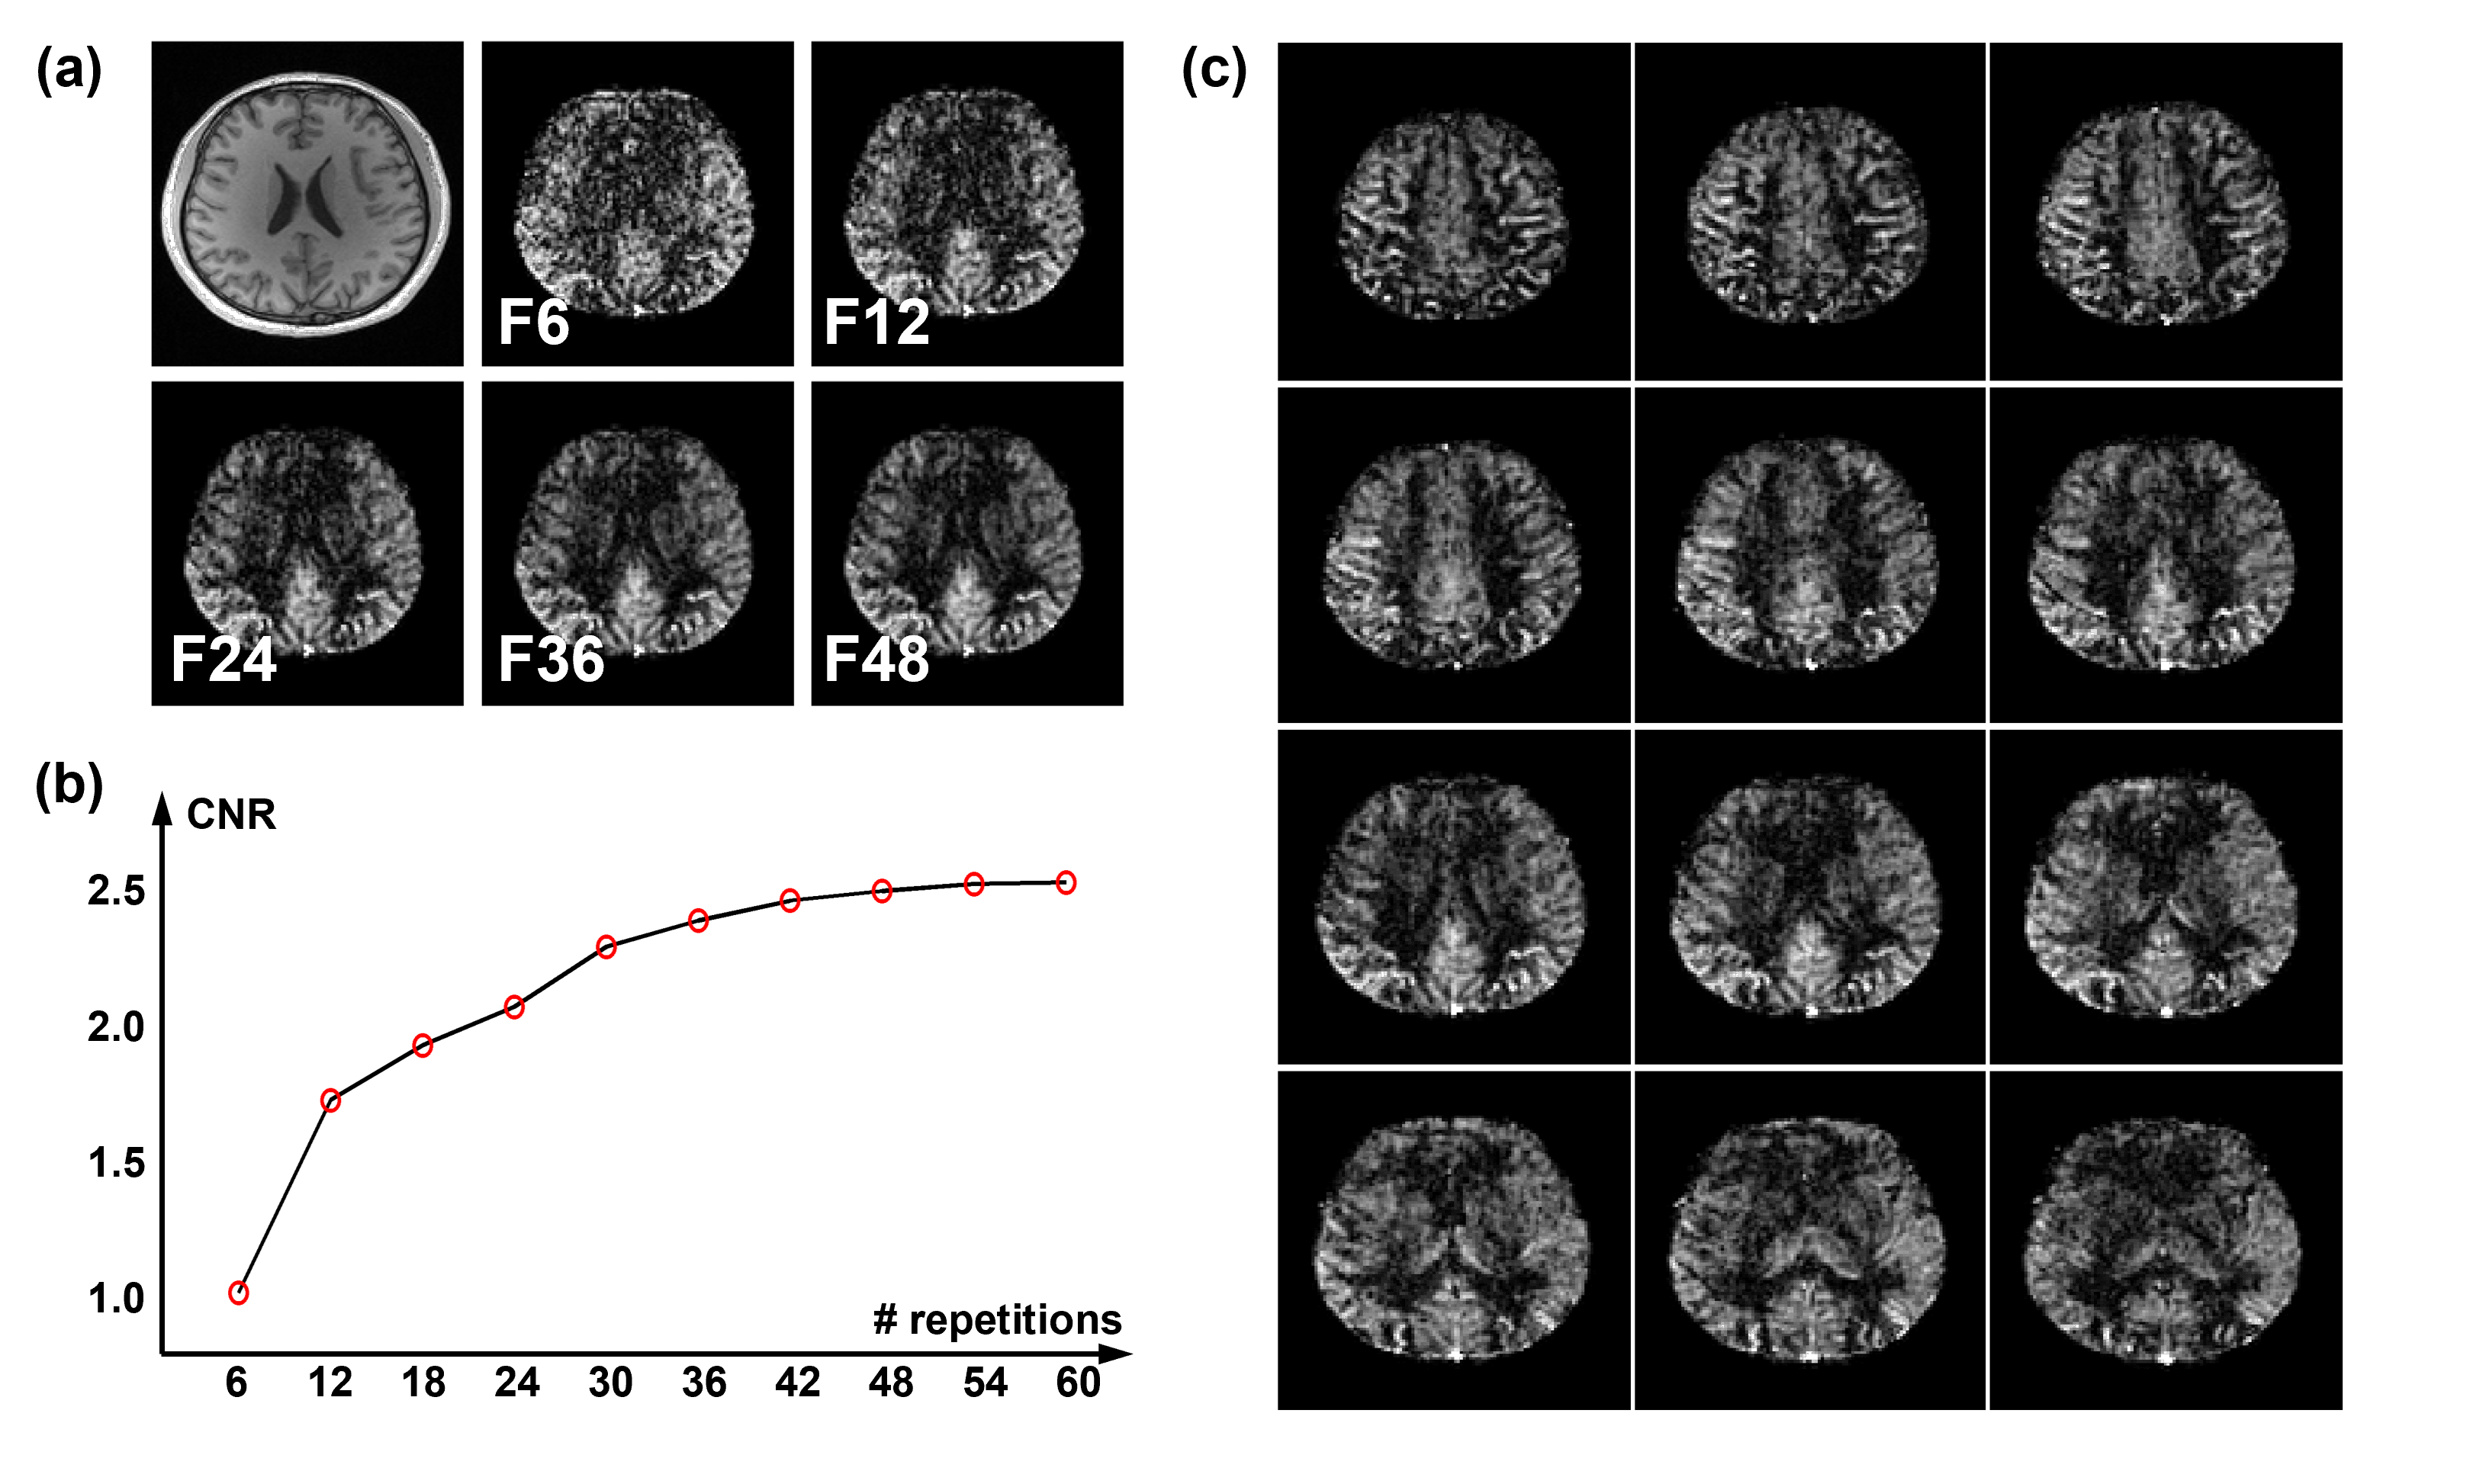
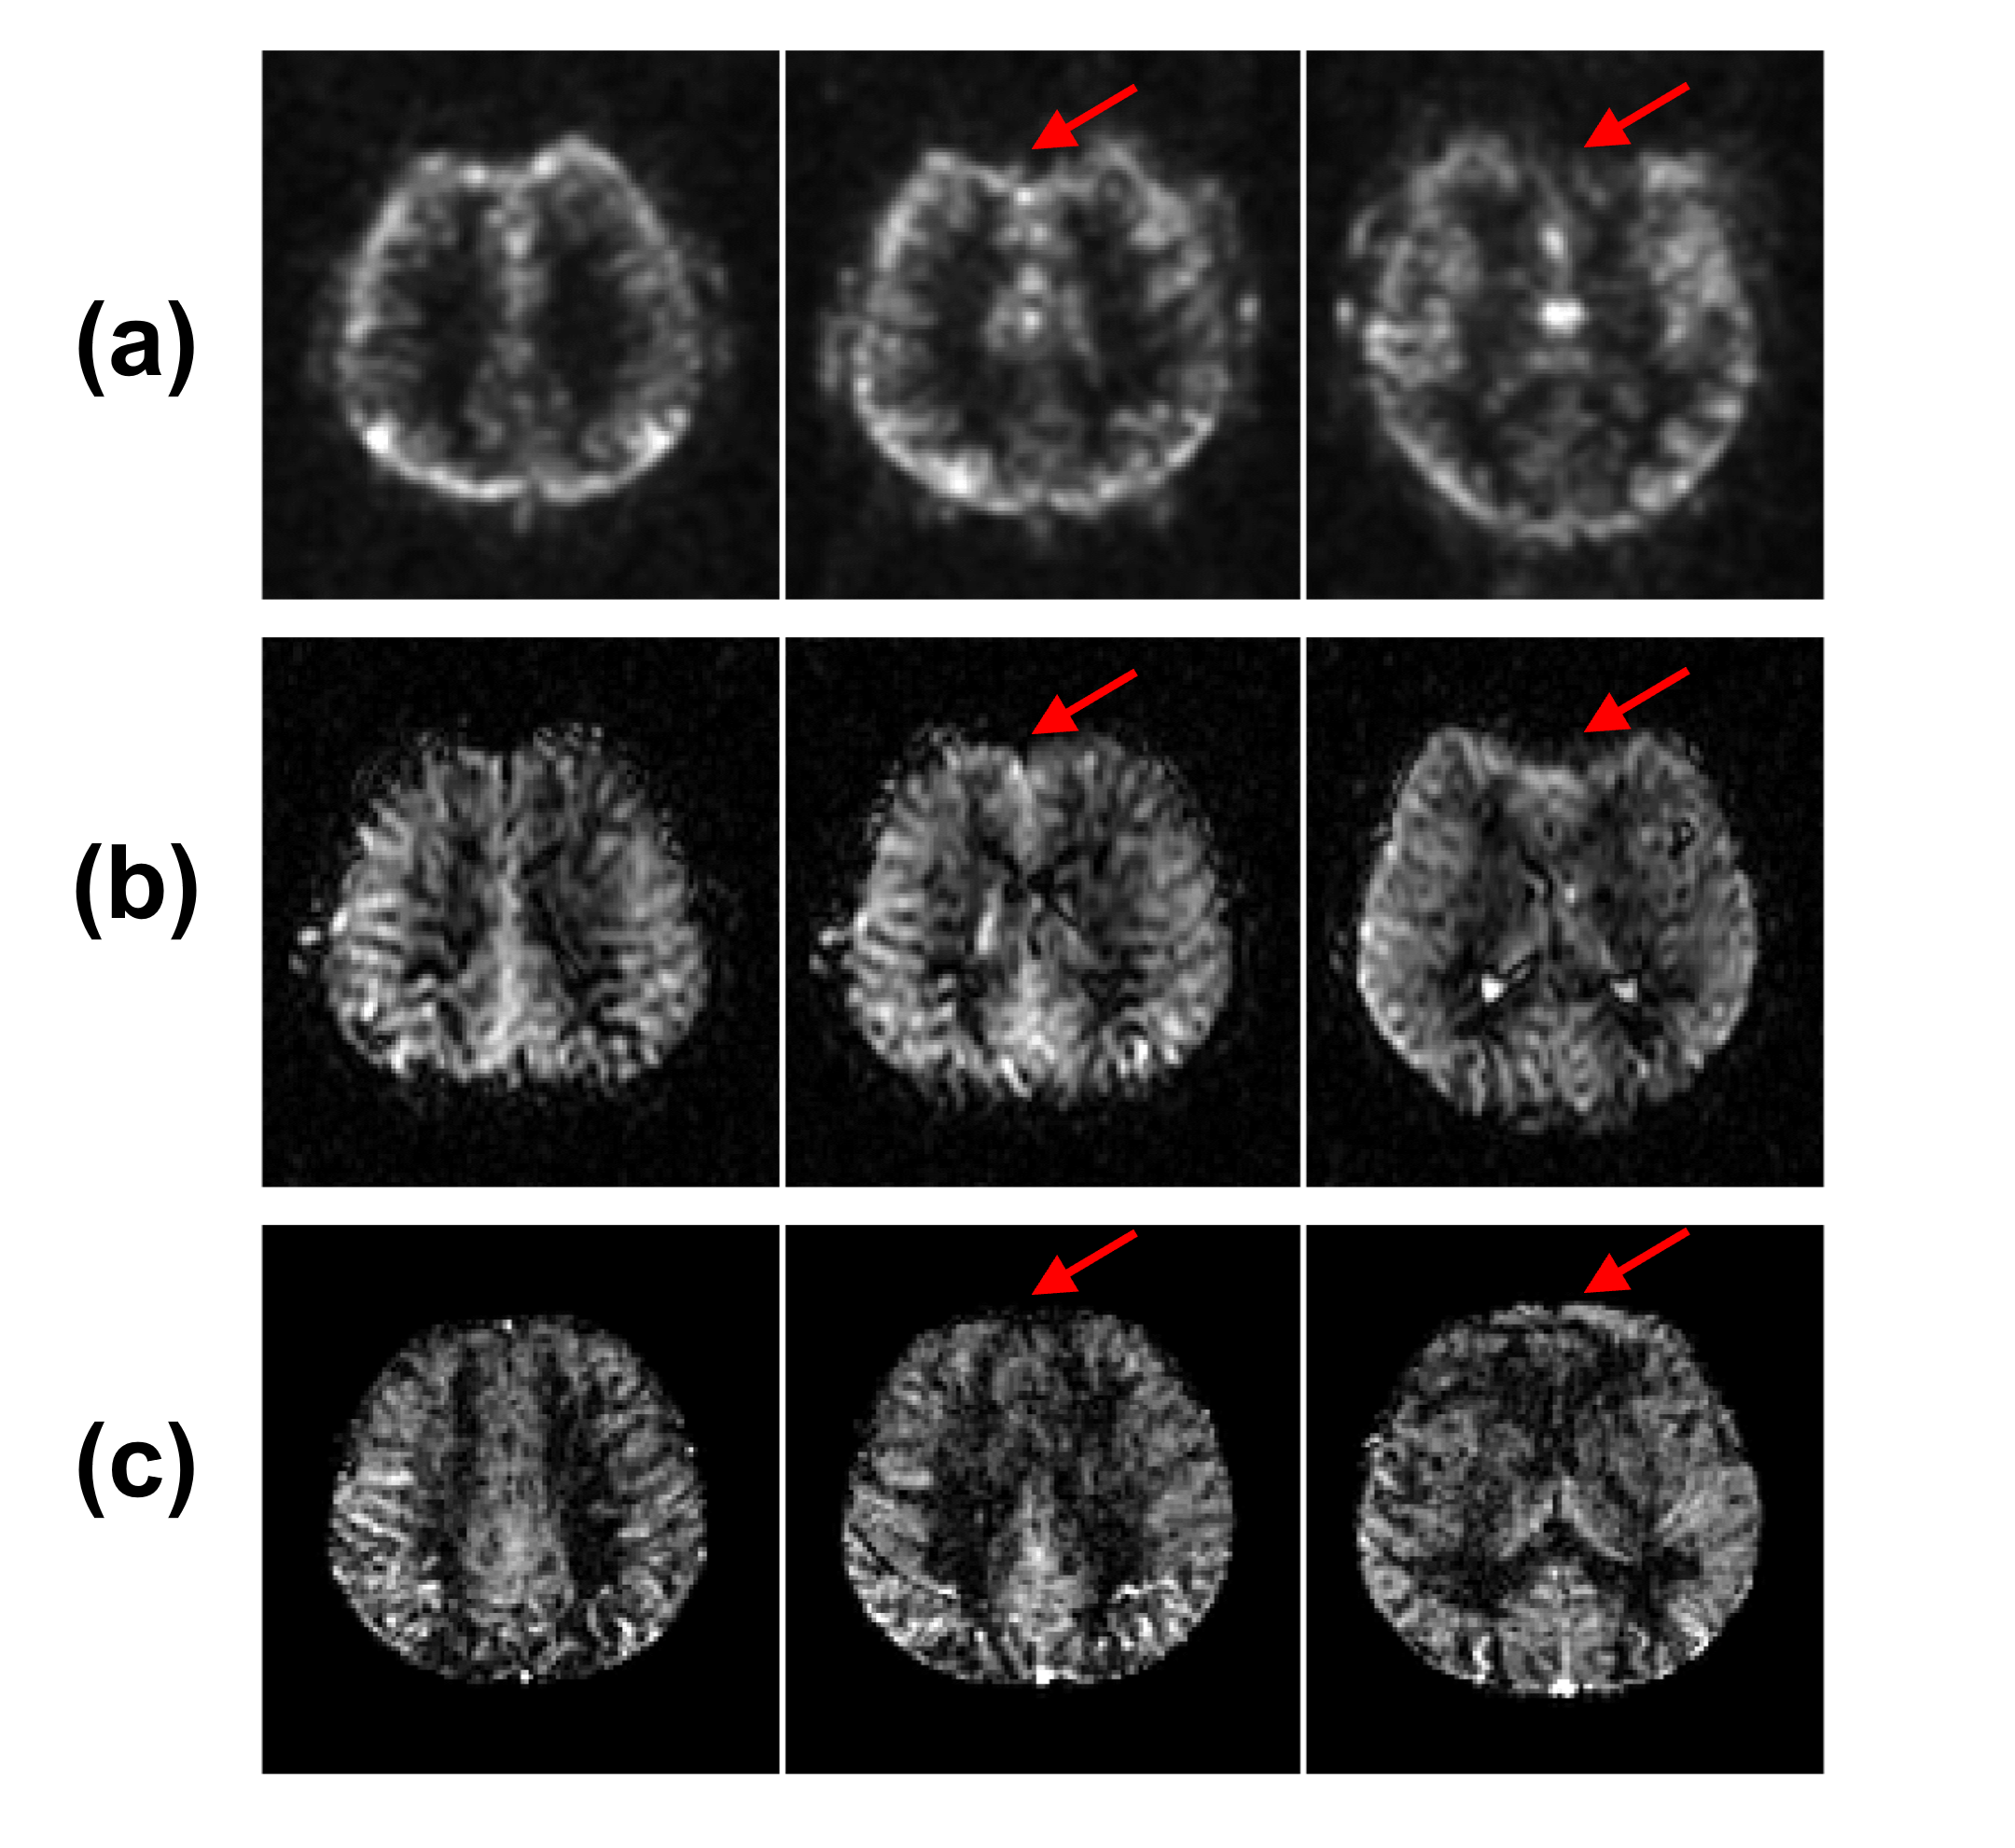
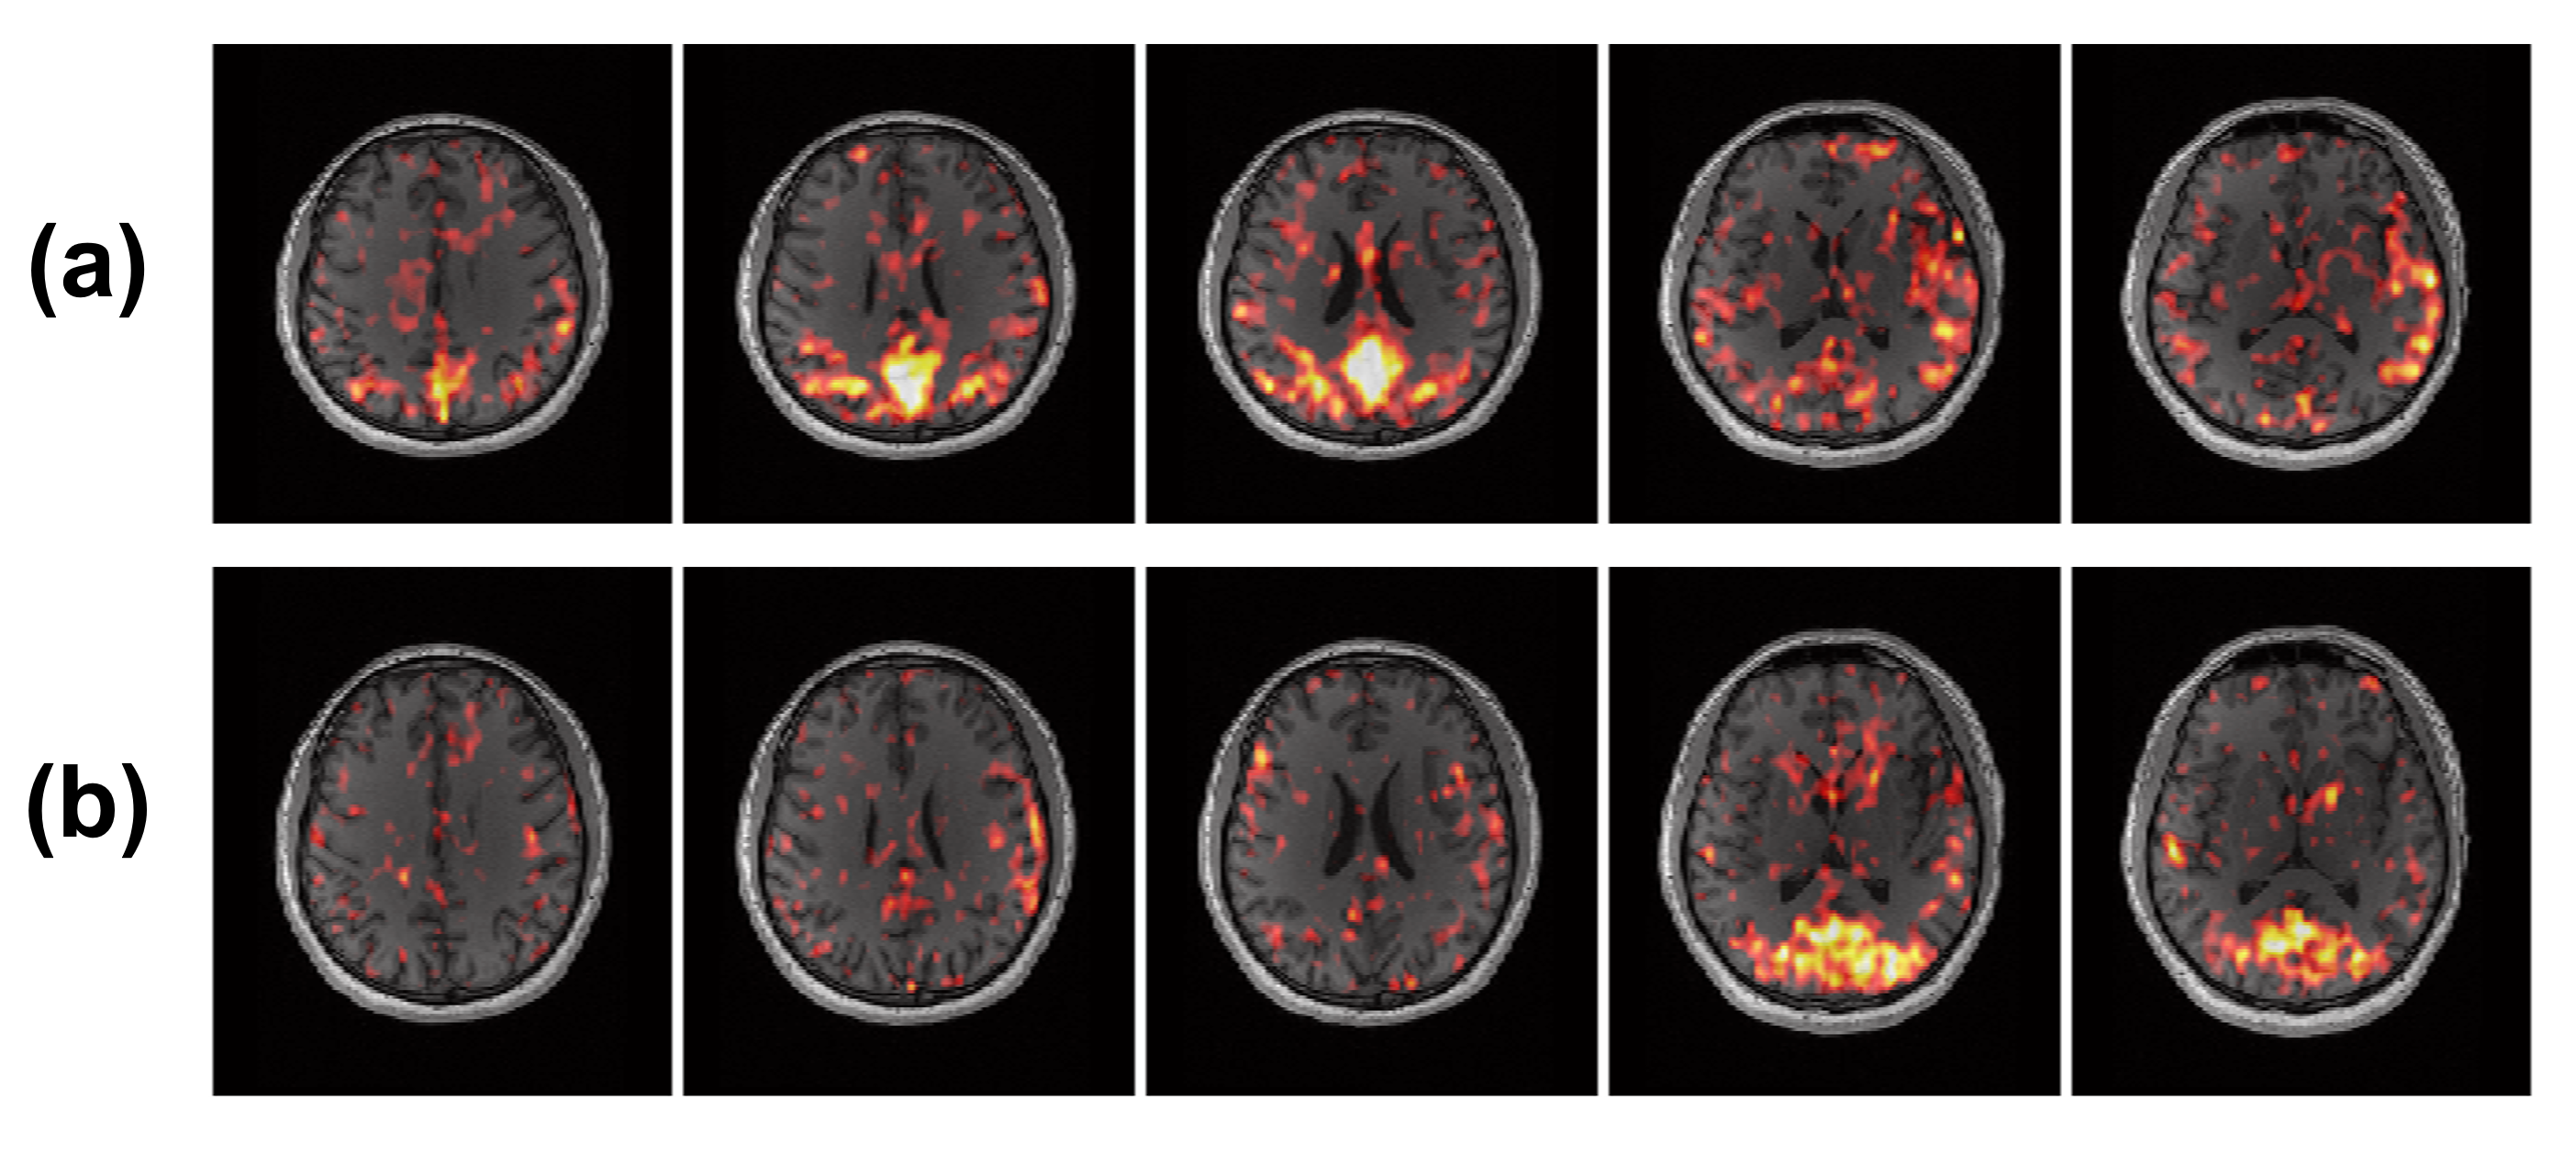
Figure 2(a) shows the ΔM images with different number of repetitions for the ASL acquisition. The corresponding CNRs are displayed in Figure 2(b), showing that CNR increased with more averages, but the increment saturated afterwards. Therefore, the number of 36 repetitions was chosen to produce reasonable ΔM images (as Figure 2(c)), corresponding to a 2.5-min scan time.Figure 3 compares the proposed method with two other methods, which used the same PASL labeling module but 2D-EPI and 3D-GRASE readouts. As we can see, both EPI and GRASE methods suffered from strong image distortion in the frontal regions, but the proposed method did not. With only about half of the scan times as the other two methods, the proposed method provided an even better combination of resolution and SNR.
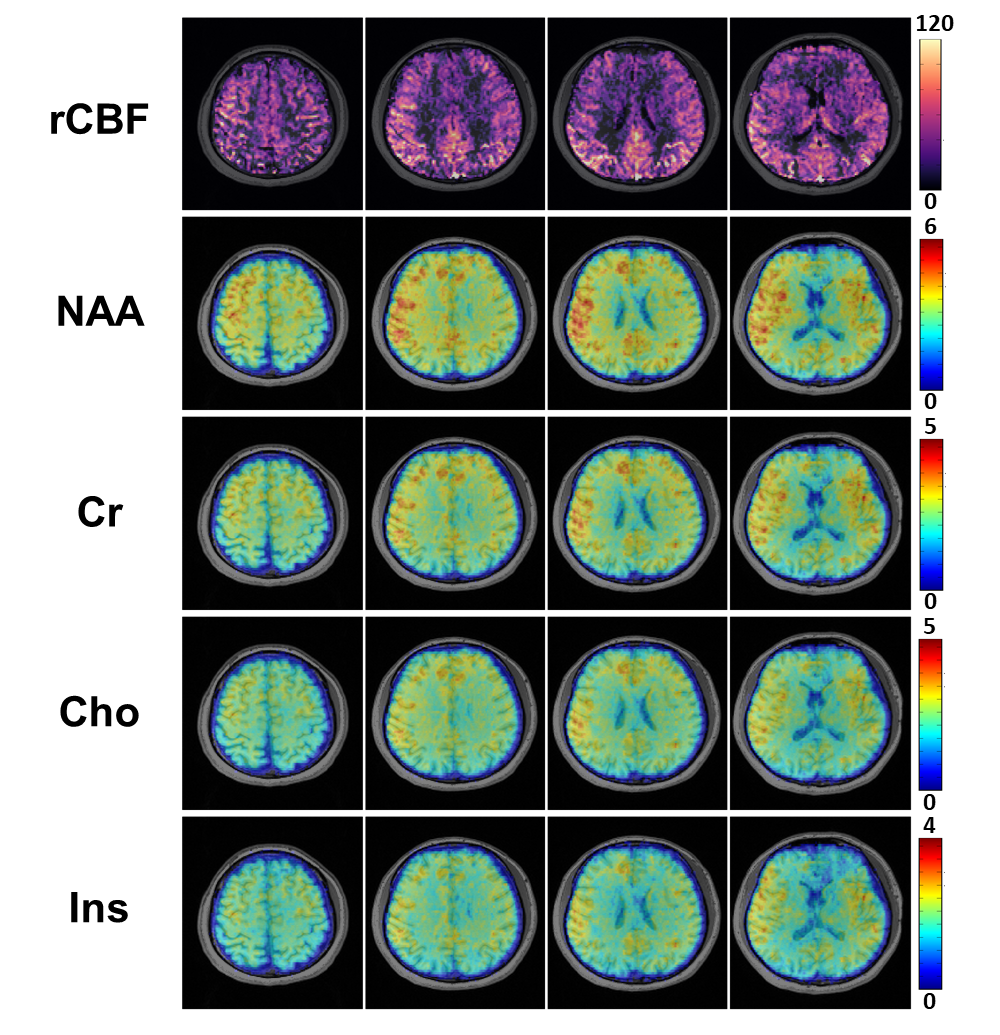
Figure 4 shows the complete set of results including both ASL and MRSI acquisitions in 9 minutes. High-quality CBF map and metabolite maps were successfully obtained. The results of a resting-state functional study are displayed in Figure 5. Through ICA analysis to estimate functional network components from the ΔM images, both default mode network and visual network were reasonably obtained from the single participant.
Conclusion
In this work, ASL-based perfusion imaging and MRSI-based metabolic imaging were synergistically integrated. Utilizing the unsuppressed water spectroscopic signals in MRSI, high-SNR and distortion-free ASL were obtained. With further development, it may provide a powerful imaging tool for many imaging studies and clinical applications.Acknowledgements
No acknowledgement found.References
1. Seeger A, Braun C, Skardelly M, et al. Comparison of three different MR perfusion techniques and MR spectroscopy for multiparametric assessment in distinguishing recurrent high-grade gliomas from stable disease. Acad. Radiol. 2013;20(12):1557-1565.
2. Li X, Wang Y, Wang Z, et al. Comparison of magnetic resonance spectroscopy (MRS) with arterial spin labeling (ASL) in the differentiation between mitochondrial encephalomyopathy, lactic Acidosis, plus stroke-like episodes (MELAS) and acute ischemic stroke (AIS). J. Clin. Neurosci. 2018;55:65-70.
3. Posse S, Otazo R, Dager S, et al. MR spectroscopic imaging: principles and recent advances. J Magn Reson Imaging. 2013;37(6):1301-1325.
4. Ferré JC, Bannier E, Raoult H, et al. Arterial spin labeling (ASL) perfusion: techniques and clinical use. Diagn. interv. imaging. 2013;94(12):1211-1223.
5. Peng X, Lam F, Li Y, et al. Simultaneous QSM and metabolic imaging of the brain using SPICE. Magn Reson Med. 2018;79(4):13-21.
6. Guo R, Zhao Y, Li Y, et al. Simultaneous QSM and metabolic imaging of the brain using SPICE: Further improvements in data acquisition and processing. Magn Reson Med. 2021;85(2):970-977.
7. Guo R, Li Y, Zhao Y, et al. Simultaneous Mapping of Water Diffusion Coefficients and Metabolite Distributions of the Brain Using MR Spectroscopic Imaging Without Water Suppression. IEEE Trans. Biomed. Eng. 2022;70(3): 962-969.
8. Lam F, Ma C, Clifford B, Johnson CL, Liang ZP. High-resolution 1H-MRSI of the brain using SPICE: Data acquisition and image reconstruction. Magn Reson Med. 2016;76(4):1059-1070.
9. Lam F, Li Y, Guo R, et al. Ultrafast magnetic resonance spectroscopic imaging using SPICE with learned subspaces. Magn Reson Med. 2020;83(2):377-390.
10. Luh WM, Wong EC, Bandettini PA, et al. QUIPSS II with thin‐slice TI1 periodic saturation: a method for improving accuracy of quantitative perfusion imaging using pulsed arterial spin labeling. Magn Reson Med. 1999;41(6):1246-1254.
11. Yongbi MN, Branch CA, Helpern JA. Perfusion imaging using FOCI RF pulses. Magn Reson Med. 1998;40(6):938-943.
12. Liang ZP, Lauterbur PC. A Generalized Series Approach to MR Spectroscopic Imaging. IEEE Trans Med Imaging. 1991;10(2):132-137.
13. Alsop DC, Detre JA, Golay X, et al. Recommended implementation of arterial spin‐labeled perfusion MRI for clinical applications: a consensus of the ISMRM perfusion study group and the European consortium for ASL in dementia. Magn Reson Med. 2015;73(1):102-116.
Figures