1253
Model-based frequency-and-phase correction of 1H-MRS data with 2D linear-combination modeling1Russell H. Morgan Department of Radiology and Radiological Science, The Johns Hopkins University School of Medicine, Baltimore, MD, United States, 2F. M. Kirby Research Center for Functional Brain Imaging, Kennedy Krieger Institute, Baltimore, MD, United States
Synopsis
Keywords: Signal Modeling, Spectroscopy, MRS; Frequency-and-phase correction; linear-combination modeling; 2D-modeling
Motivation: Retrospective frequency-and-phase correction (FPC) methods like spectral registration struggle at low SNR.
Goal(s): To develop model-based correction FPC with simultaneous 2D fitting of all transients. To compare its performance to conventional FPC.
Approach: Inclusion of all transients (without prior FPC) into a 2D linear-combination model with frequency and phase parameters for each transient. Comparison with conventional approach (spectral registration, averaging and 1D modeling). Outcome measures: frequency/phase/amplitude ground truth error & standard deviation, amplitude CRLB.
Results: Model-based FPC is feasible and retrieves frequency/phase variations with high fidelity. At low SNR, frequency and metabolite amplitude estimation is more accurate and precise.
Impact: Direct integration of frequency-and-phase correction into 2D linear-combination modeling is feasible and has great potential to improve metabolite level estimation for conventional and dynamic MRS data, especially for low-SNR conditions, e.g., long TEs, strong diffusion weighting, etc.
Introduction
Conventional proton magnetic resonance spectroscopy (1H-MRS) experiments acquire multiple transients to achieve sufficient signal-to-noise ratio (SNR) by coherent averaging. Experimental instabilities can cause frequency and phase variations between transients. If not corrected, they result in apparent linebroadening of the averaged spectrum, increasing modeling uncertainty due to poorer SNR and spectral resolution1–3.Retrospective frequency-and-phase correction (FPC) methods align transients prior to averaging and linear-combination modeling (LCM)1. FPC algorithms (spectral registration2,3) determine the necessary corrections by minimizing differences between FIDs, which is challenging for low-SNR transients3.
Here, we propose a method that directly integrates FPC into a 2D-LCM of individual transients. 2D models simultaneously fit multiple interrelated spectra and are gaining popularity due to increasing interest in dynamic 1H-MRS techniques4,5,6,8. We compared model-based FPC and the standard approach (spectral registration followed by 1D-LCM) by evaluating accuracy and precision of frequency and phase variations and amplitude estimation in synthetic MRS data.
Methods
We generated two scenarios of synthetic sLASER spectra (TE = 30 ms, 64 transients per dataset)9.Scenario 1: 2,500 datasets of scyllo-inositol (sI) per SNR level (256, 128, 64, 32) with constant amplitude (0.15), Gaussian (5.7 Hz) and Lorentzian (2.42 Hz) linebroadening7.
Scenario 2: 100 in-vivo-like datasets per SNR level (256, 128, 64, 32, 16) from 18 metabolite basis functions (Asc, Asp, Cr, CrCH2, GABA, GPC, Gln, Glu, mI, Lac, NAA, NAAG, PCho, PCr, PE, sI, Tau) and a measured macromolecule signal10,11 with constant amplitudes, Gaussian (9.7 Hz) and Lorentzian (2.42 Hz) linebroadening.
Each transient received frequency and zero-order phase shifts from normal distributions ([-10, 10 Hz]; [-45°, 45°]). SNR levels were defined on the averaged spectrum, i.e., single-transient SNR was $$$ \text{SNR} / \sqrt{64}$$$.
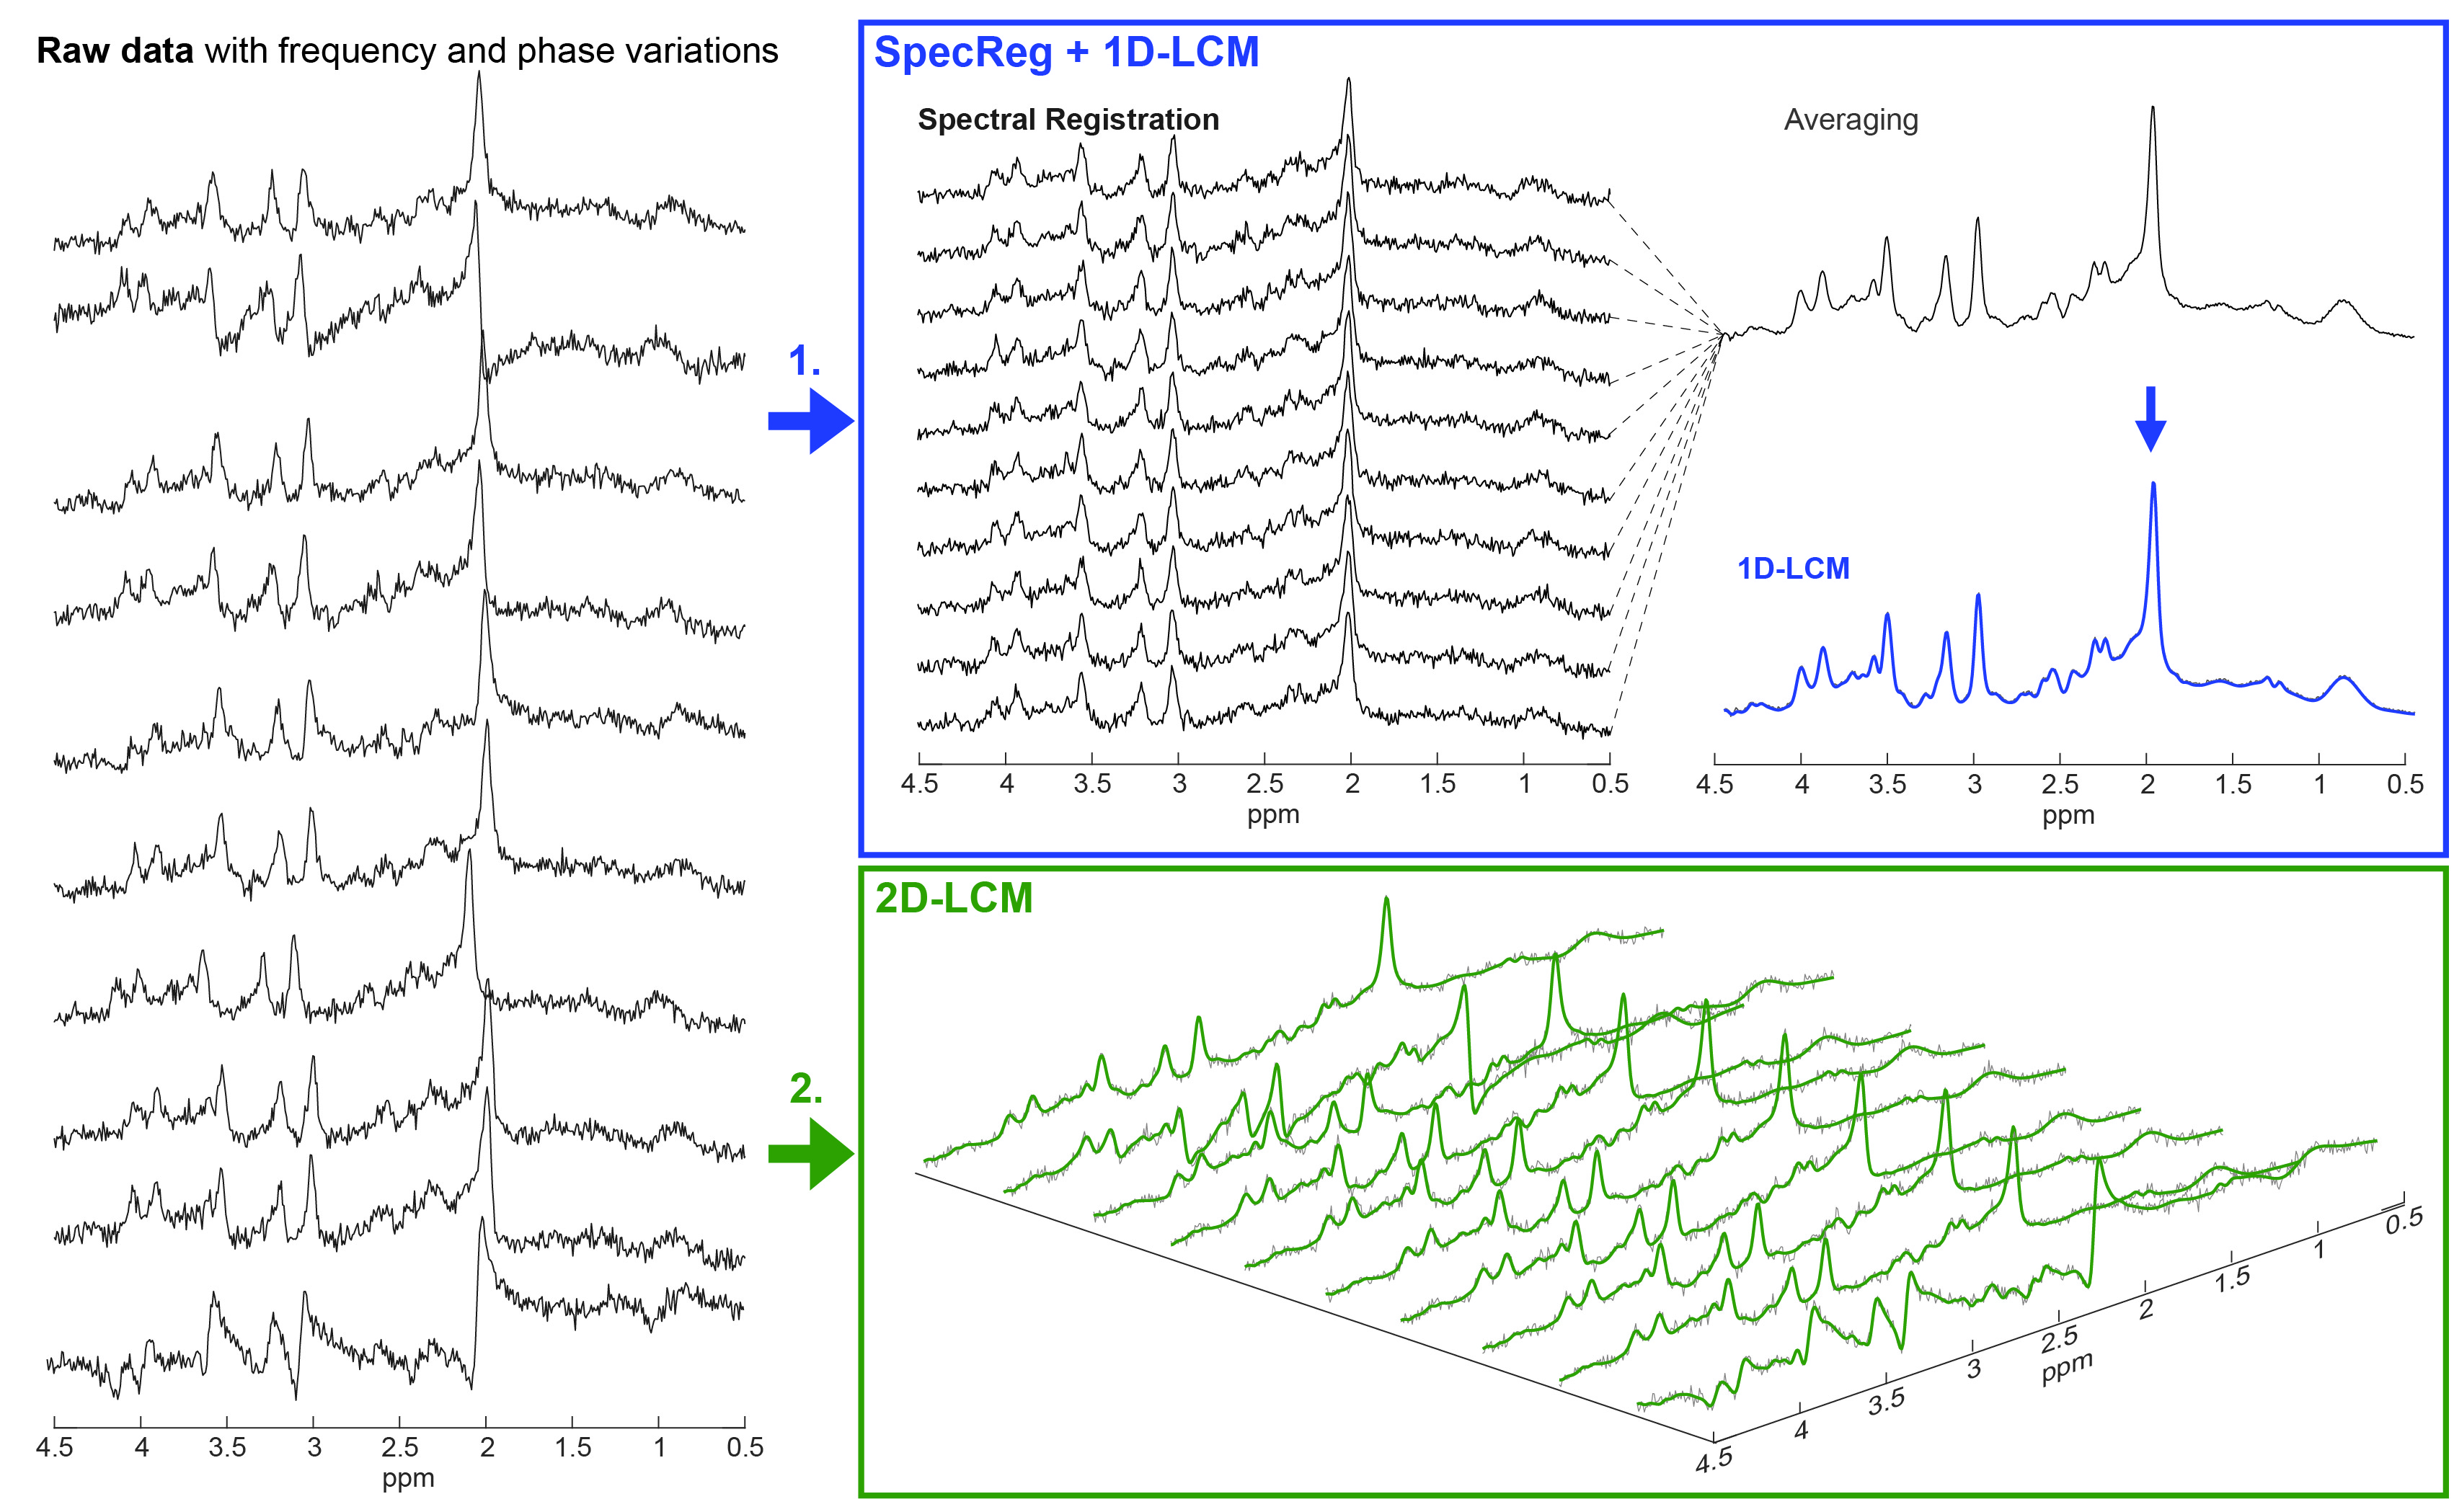
We analyzed each dataset with two approaches (Figure 1):
- ”SpecReg + 1D-LCM": FPC with spectral registration2, averaging and subsequent 1D-LCM9.
- “2D-LCM”: Direct 2D-modeling of all transients (no prior FPC or averaging) with individual frequency and phase parameters for each transient. All other parameters were fixed in the transient dimension.
Within each dataset (64 transients), we calculated R2 of a linear regression between the estimated frequency/phase variations and their ground truth (accuracy). We also calculated the SD of the absolute error against the ground truth (GTE) across the 64 transients for each dataset (a measure of precision). Finally, we compared metabolite amplitude estimation by assessing accuracy (GTE), precision (SD of amplitude estimates) and modeling uncertainty (Cramér-Rao Lower Bounds, CRLB).
Results
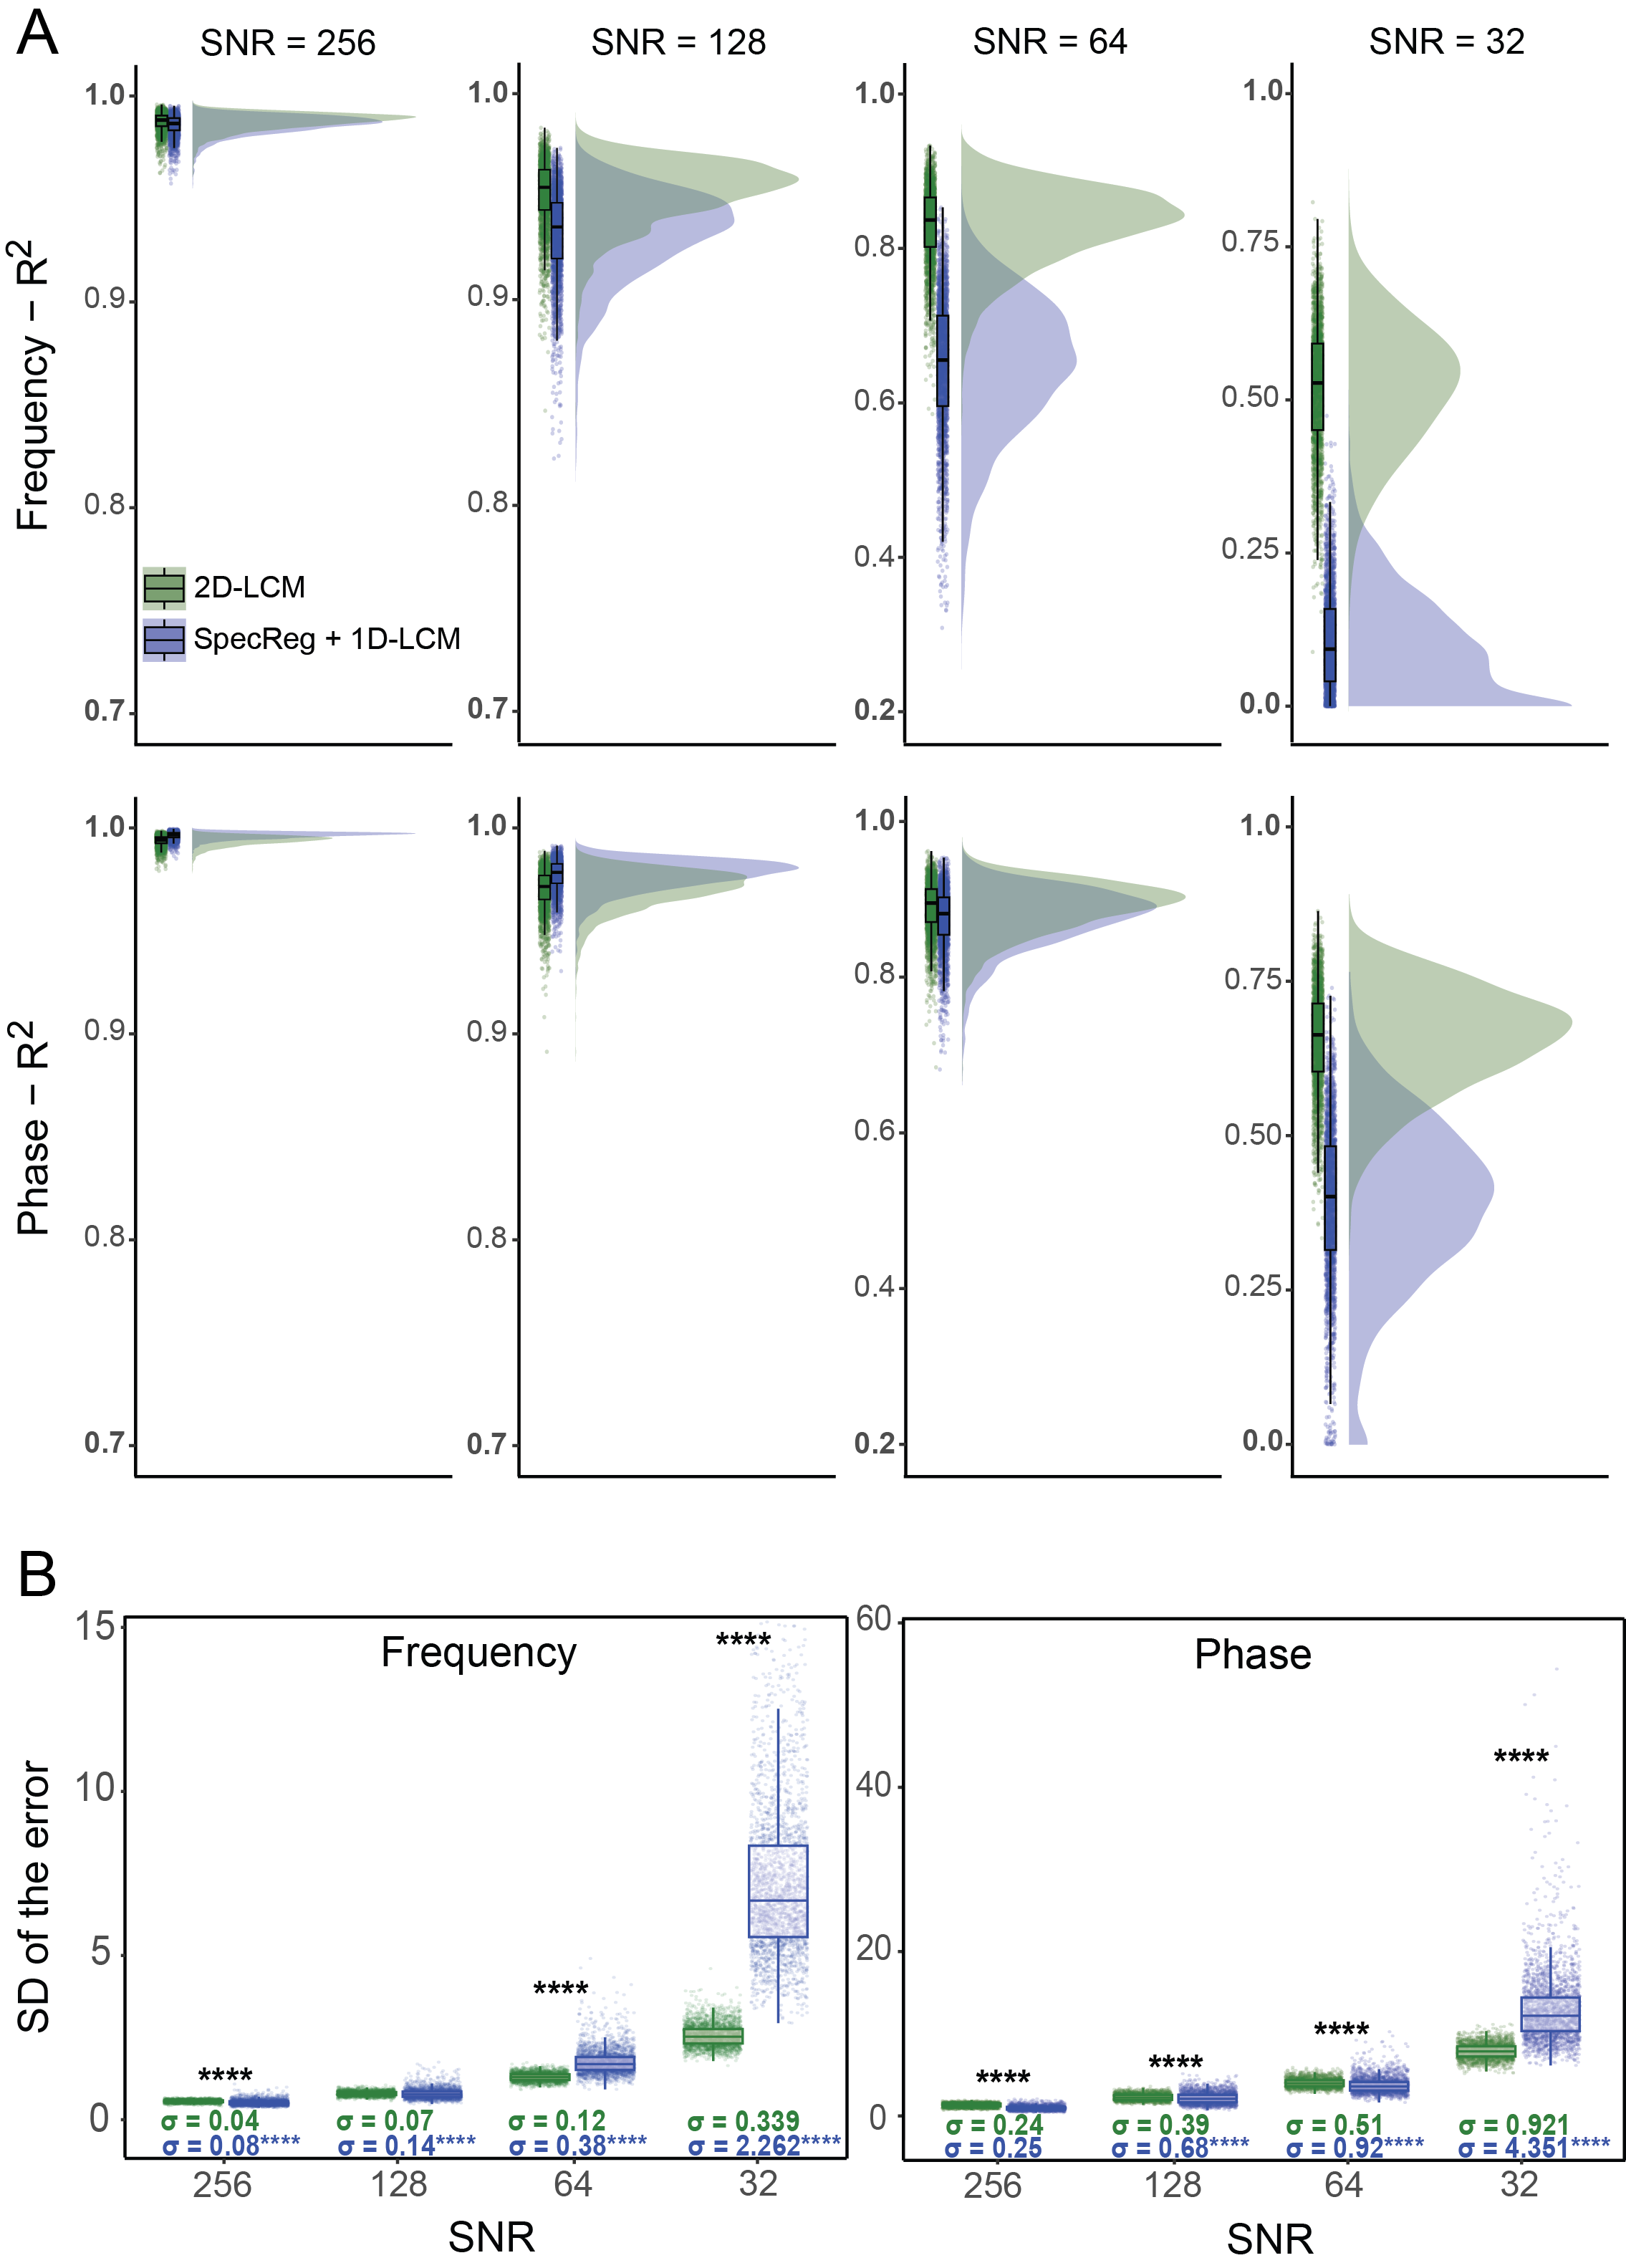
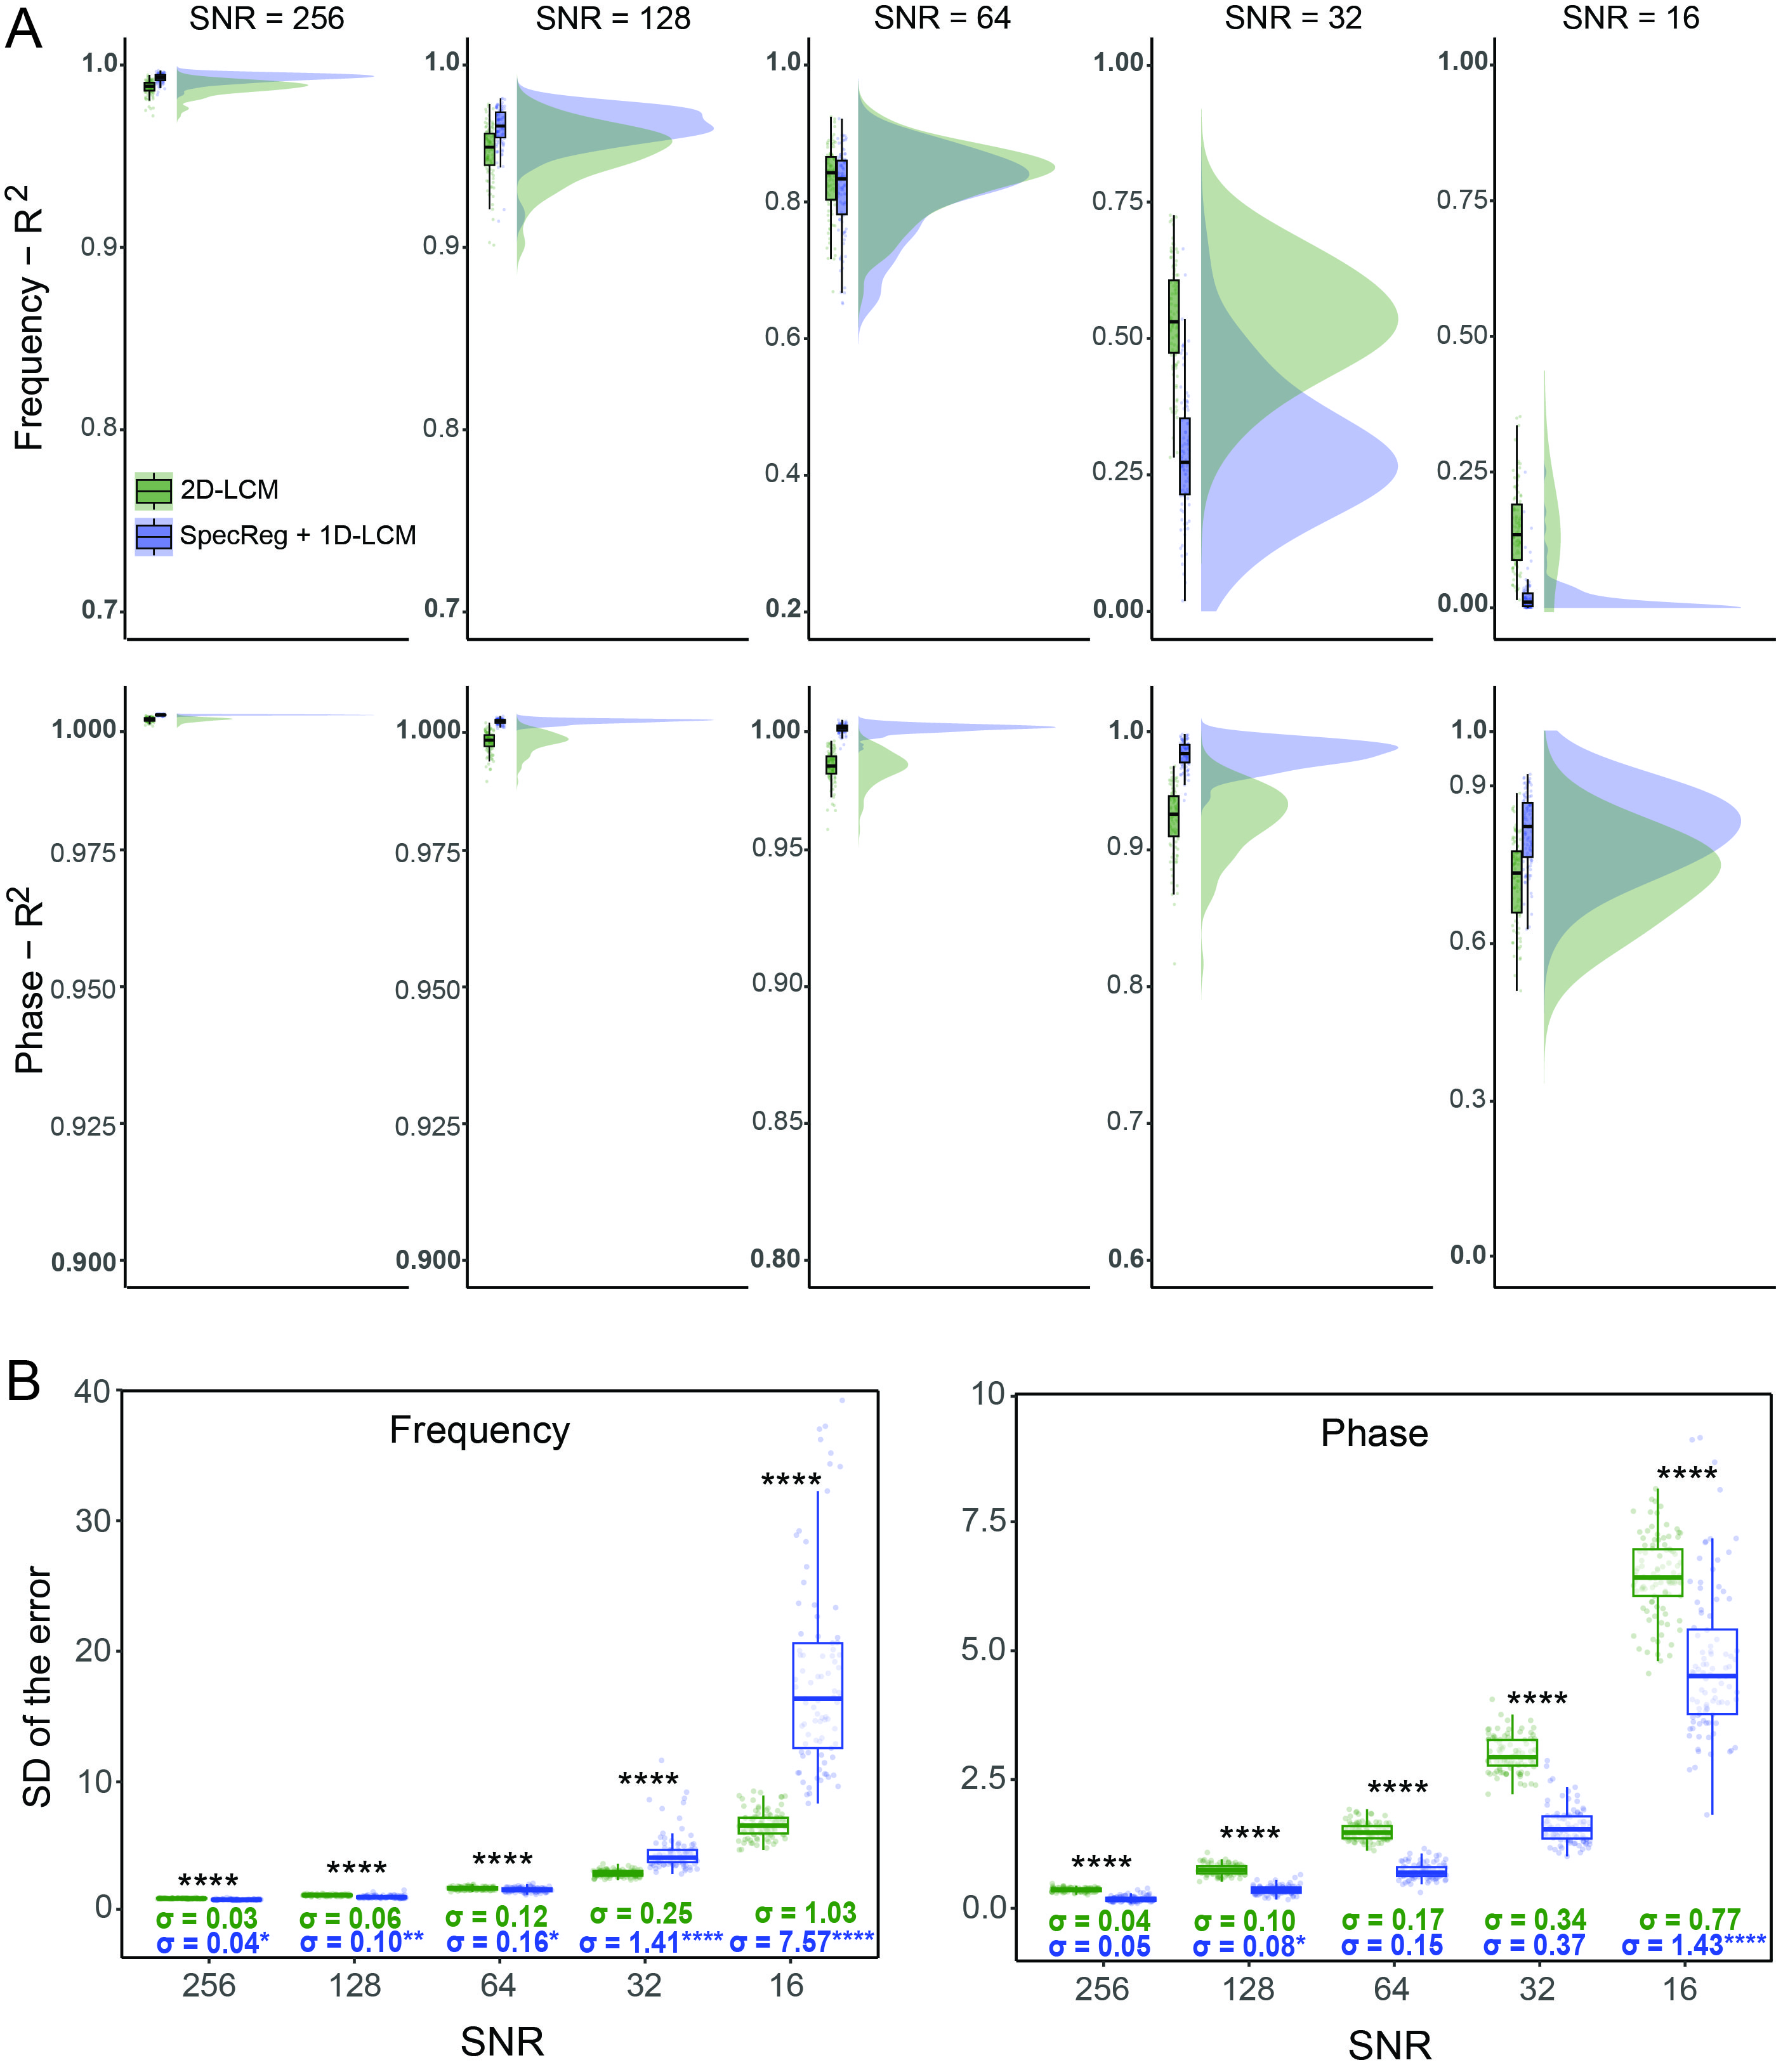
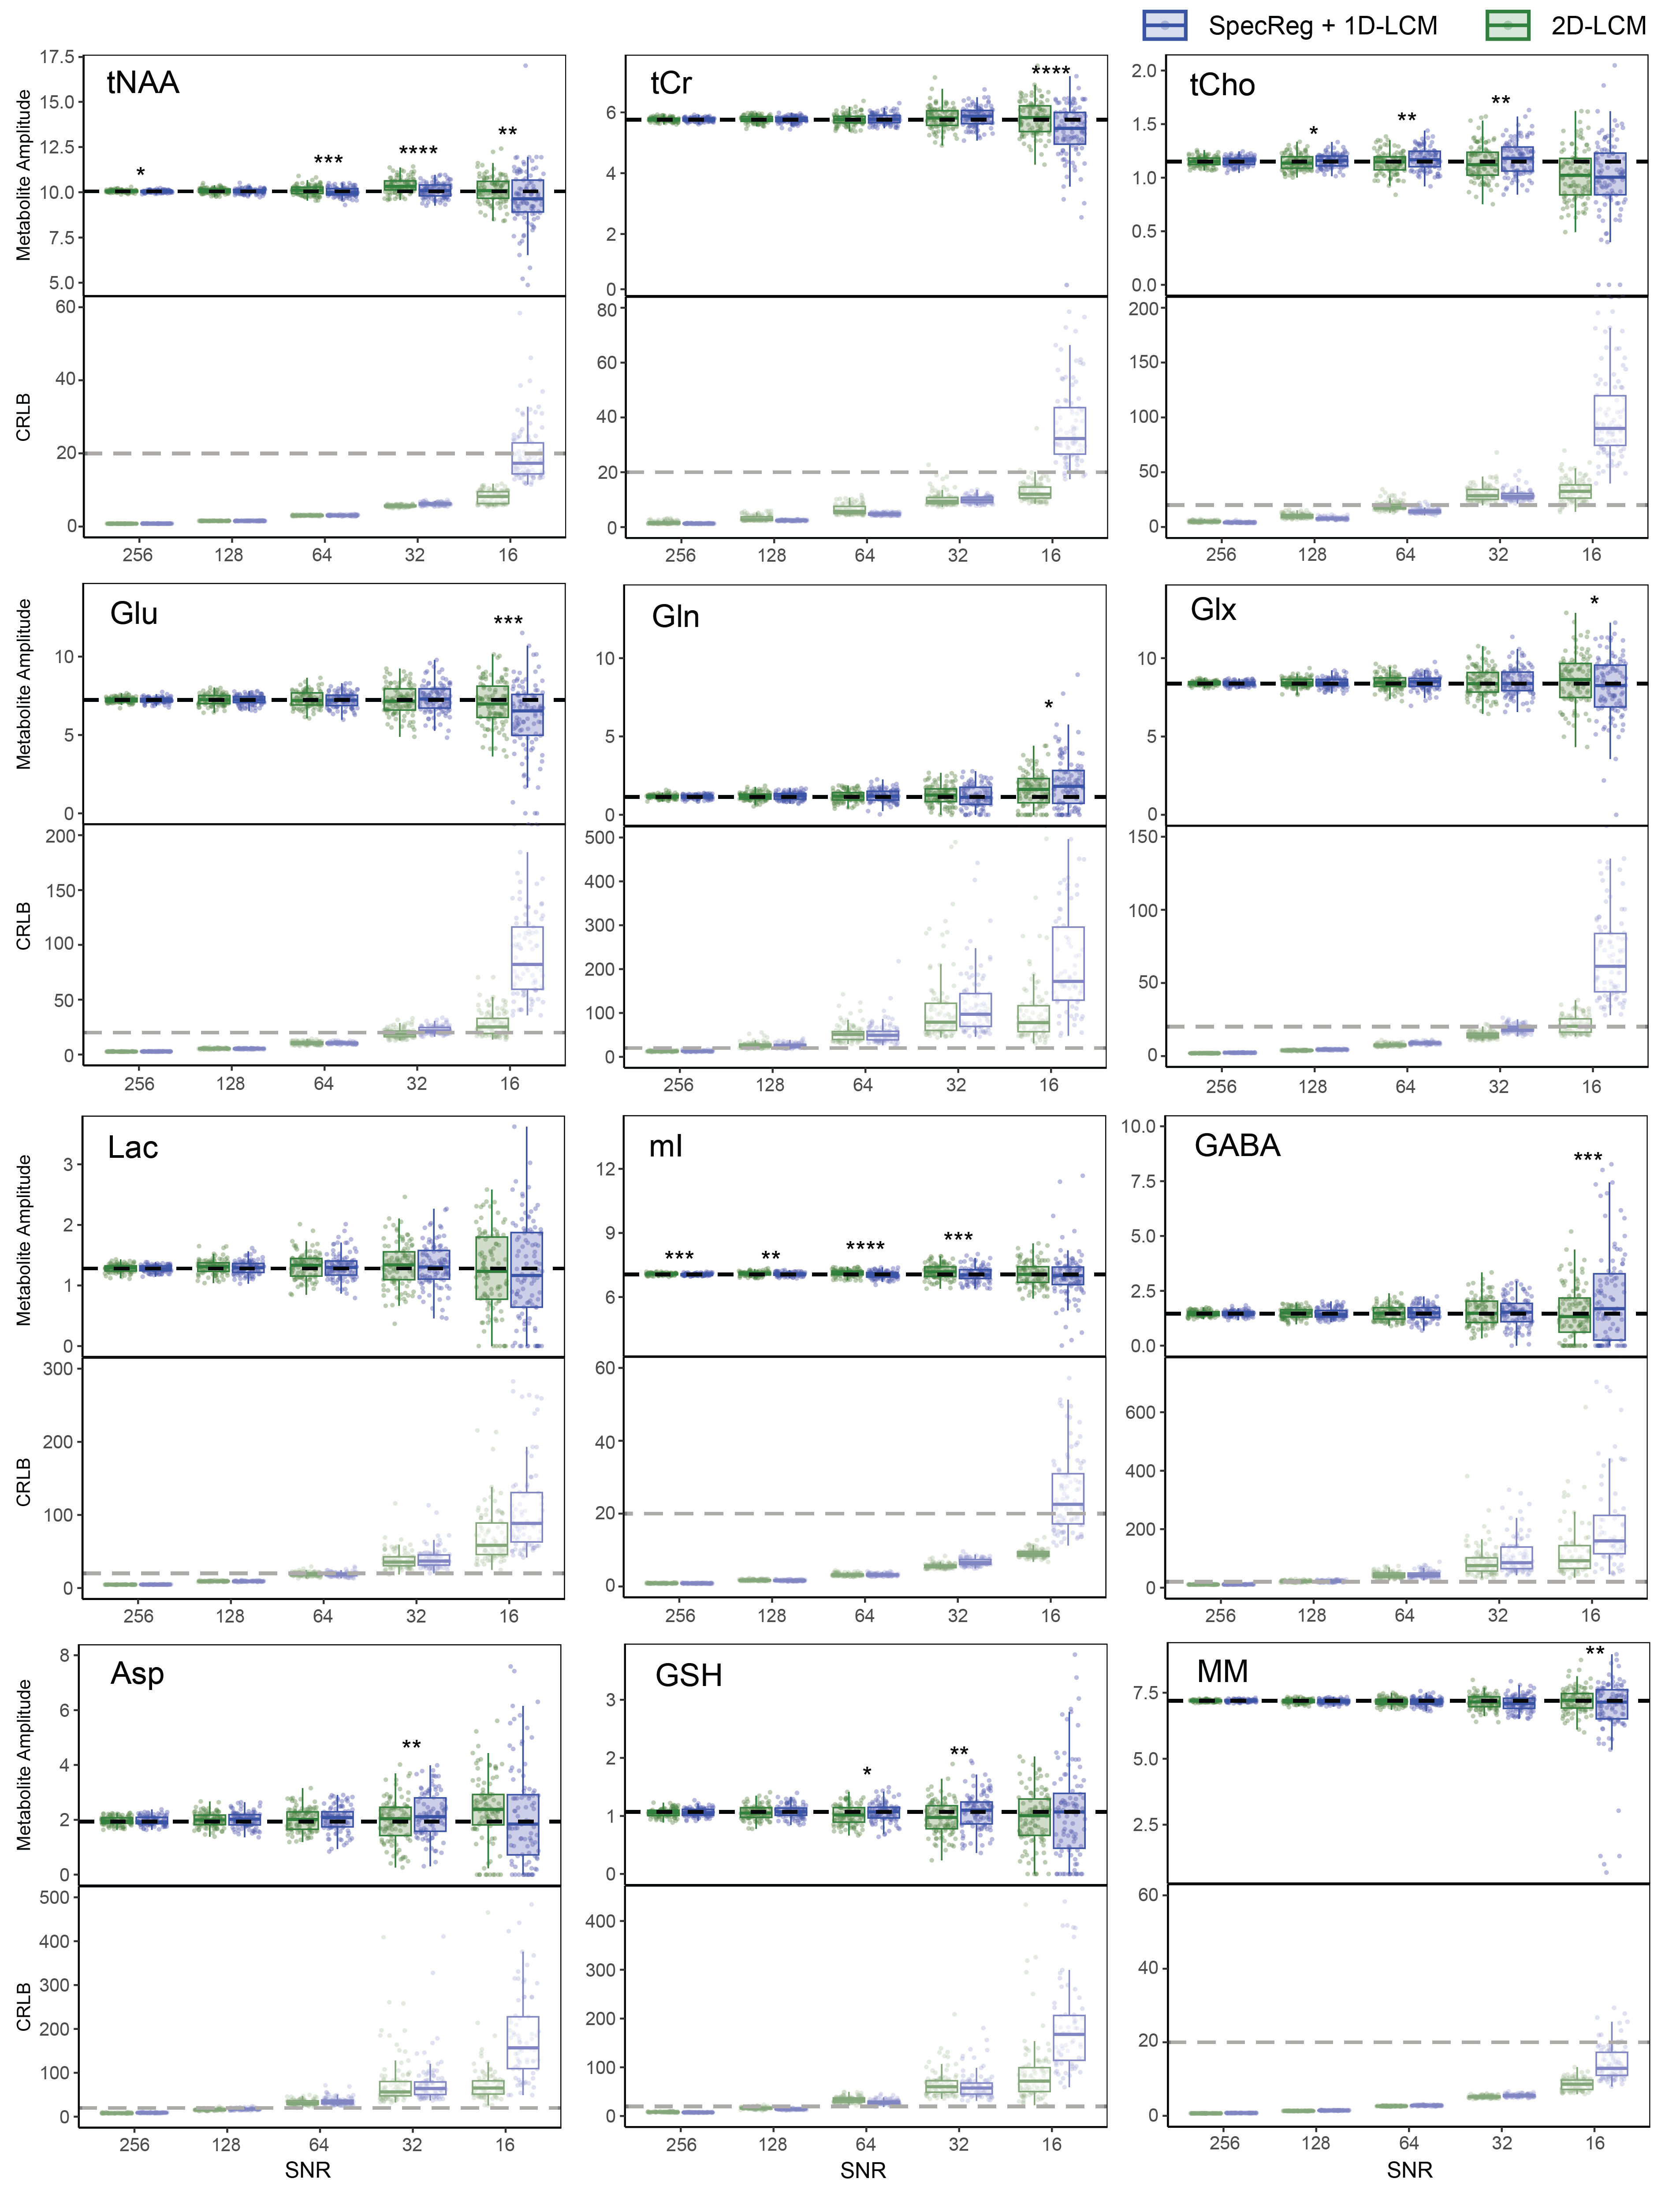
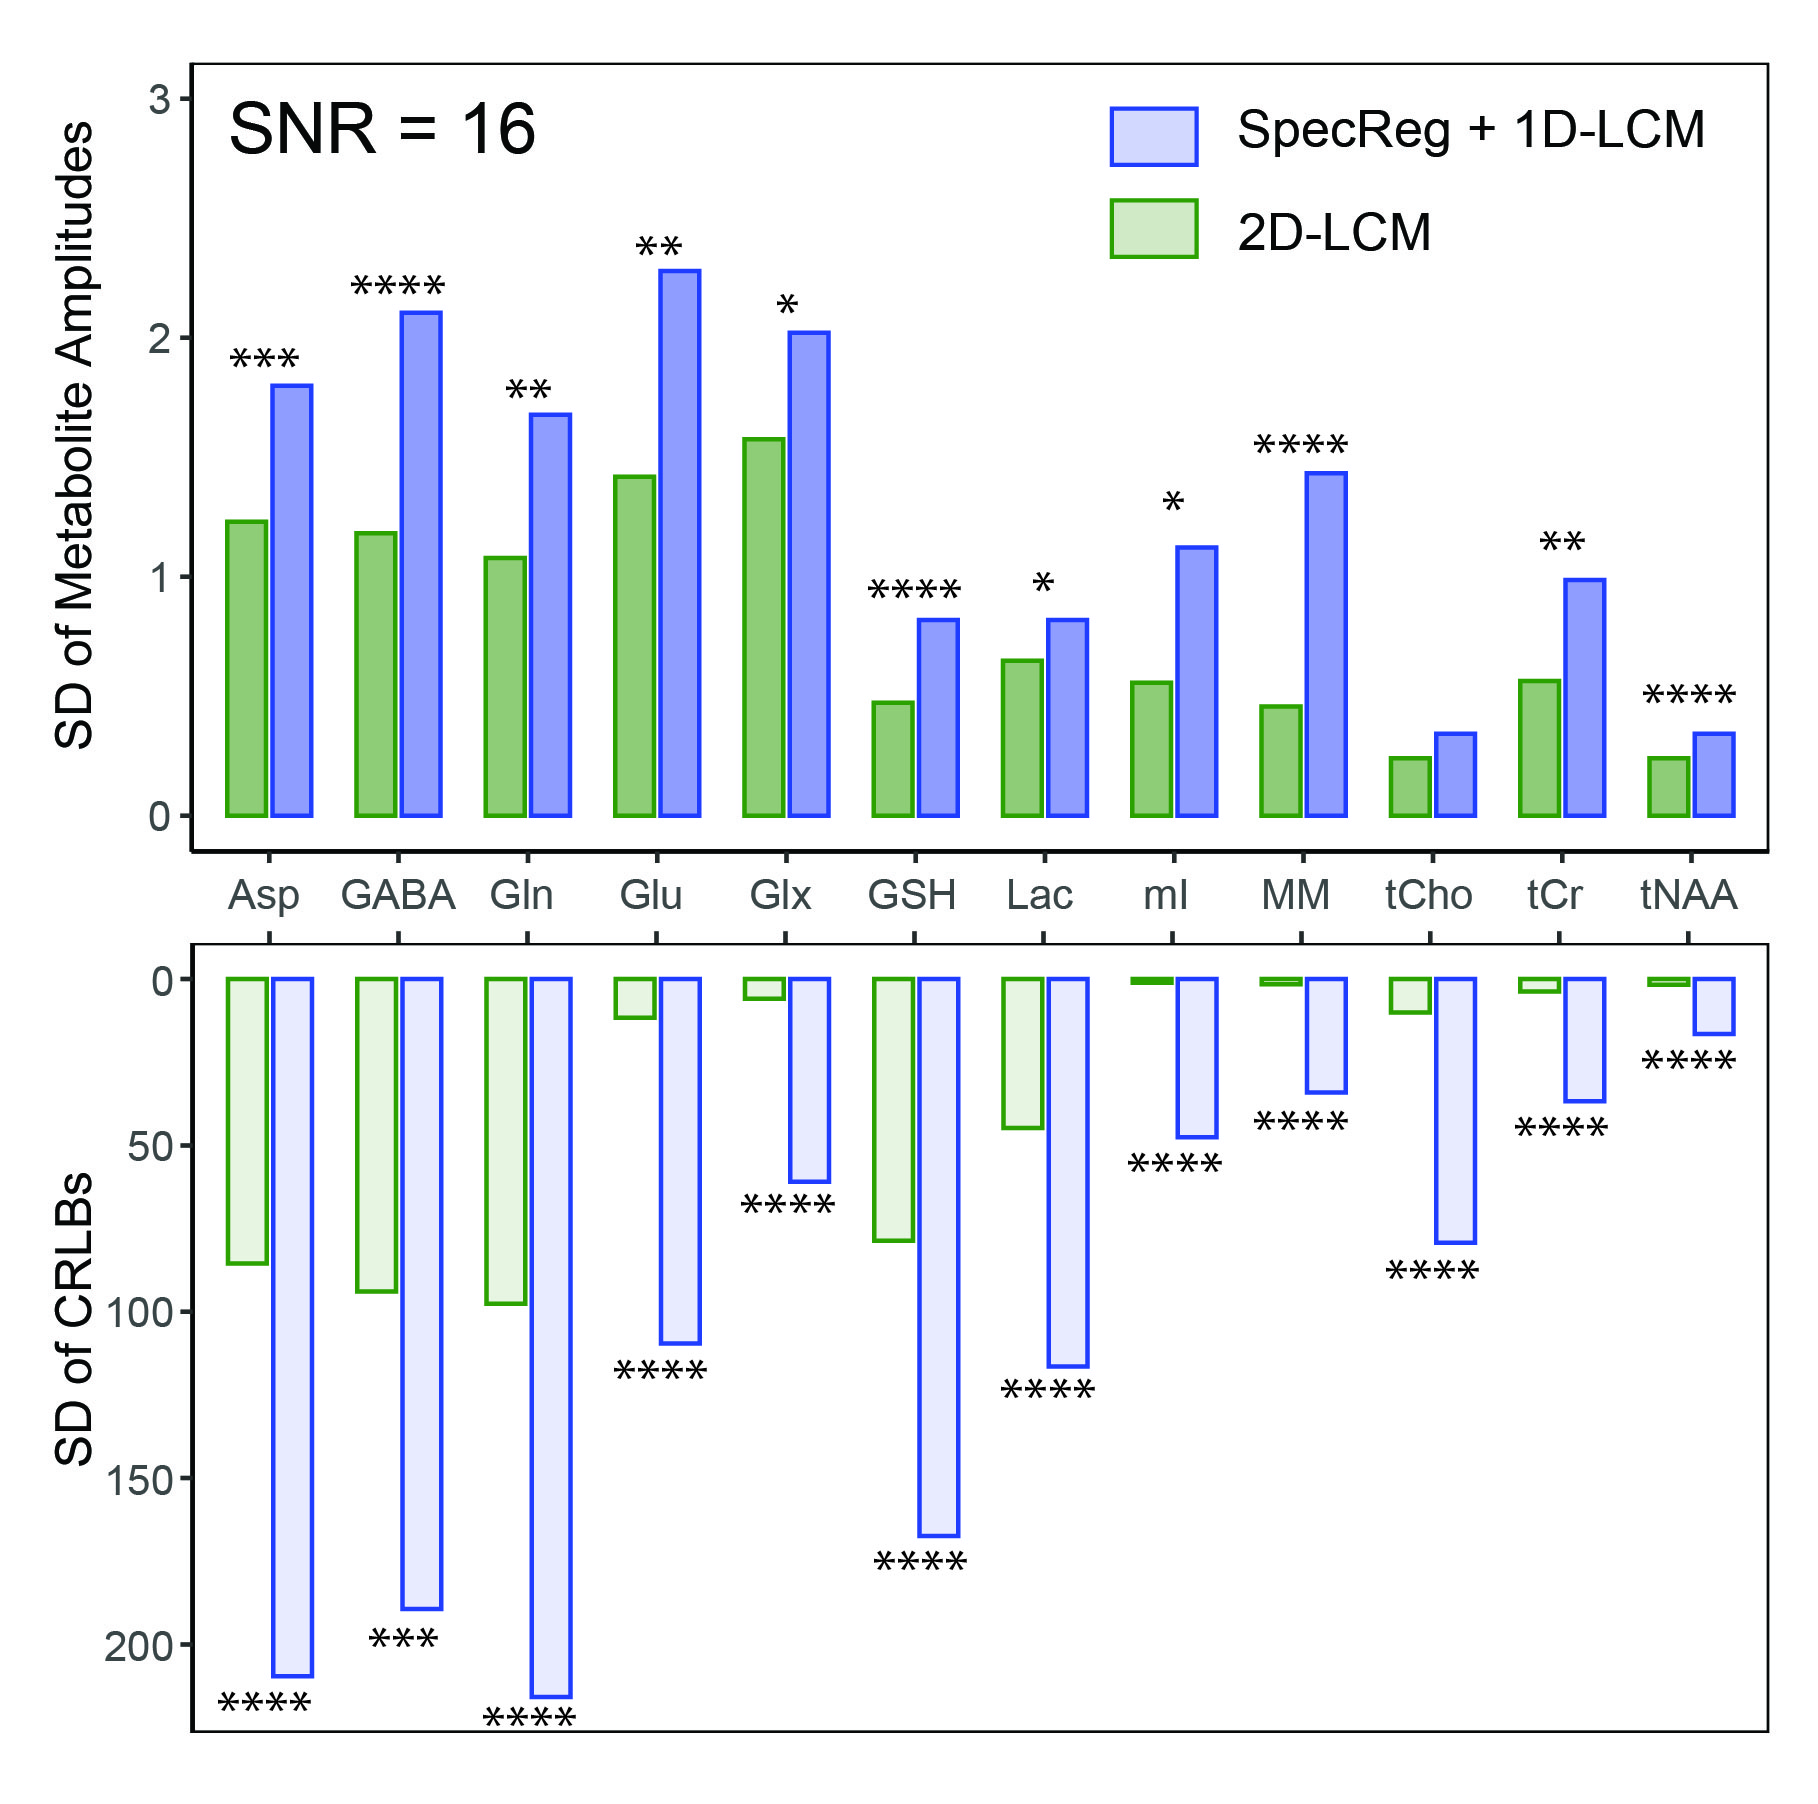
At high SNR (256, 128), both approaches retrieved frequency and phase variations with high accuracy (R2 ≥ 0.9) and precision (with the SD of the GTE <1 Hz and <5°,) (Figures 2&3). At lower SNR (32, 16), 2D-LCM estimated frequency variations with better accuracy and precision than SpecReg + 1D-LCM (higher R2, smaller SD of the GTE). Both approaches estimated phase variations very accurately (high R2); while SpecReg + 1D-LCM was slightly more precise for in-vivo-like data, the advantage over 2D-LCM was small (SD of the GTE <7.5°) (Figures 2&3).Mean metabolite amplitude estimates for in-vivo-like data agreed well with the ground truth for both approaches at high SNR (Figure 4). At low SNR, 2D-LCM improved modeling uncertainty (lower CRLBs) compared to SpecReg + 1D-LCM for all metabolites. Importantly, 2D-LCM reduced average CRLBs to 20% for tCr, tNAA, Glx and mI at the lowest SNR level, for which SpecReg + 1D-LCM CRLBs were 2-3 times greater. Moreover, the SD of metabolite amplitude and corresponding CRLB estimates were significantly smaller in case of 2D-LCM confirming the improved modeling precision this method offers at low SNR (Figure 5).
Discussion
Frequency-and-phase correction enhances linewidth and SNR of multi-transient MRS datasets, but shot-to-shot alignment is challenging in very-low-SNR scenarios.2D-LCM tools are becoming popular for multi-spectrum methods (functional5, diffusion-weighted MRS4), but may also offer benefits for conventional (non-dynamic) data. We found that 2D-LCM can estimate (and account for) frequency-and-phase variations directly from uncorrected data with equivalent or better fidelity than spectral registration followed by conventional 1D-LCM. Accuracy, precision and uncertainty estimation gains were apparent for very-low-SNR data, suggesting 2D-LCM may benefit experimental conditions with long TEs, high diffusion weighting4 or small voxels.
Spectral registration only works when transients are similar. In contrast, model-based FPC should be feasible even across experimental conditions that prohibit shot-to-shot or spectrum-to-spectrum alignment, e.g., multiple diffusion weightings4, edit-ON/OFF12, etc.
For generalization to in-vivo data, 2D modeling may need to consider different phase cycling steps separately. Gross outliers (e.g., motion corruption) may require pre-identification and downweighting.
Conclusion
Model-based FPC with 2D linear-combination modeling is feasible and outperforms transient-to-transient alignment methods for lower SNRs.Acknowledgements
This work was supported by National Institutes of Health grants R00 AG062230, R21 EB033516, K99 AG080084, R01 EB016089, R01 EB023963, and P41 EB031771.References
- Near J, Harris AD, Juchem C, et al. Preprocessing, analysis and quantification in single-voxel magnetic resonance spectroscopy: experts’ consensus recommendations. NMR Biomed. 2021;34(5):e4257. doi:10.1002/nbm.4257
- Near J, Edden R, Evans CJ, Paquin R, Harris A, Jezzard P. Frequency and phase drift correction of magnetic resonance spectroscopy data by spectral registration in the time domain. Magn Reson Med. 2015;73(1):44-50. doi:10.1002/mrm.25094
- Wilson M. Robust retrospective frequency and phase correction for single-voxel MR spectroscopy. Magn Reson Med. 2019;81(5):2878-2886. doi:10.1002/mrm.27605
- Ligneul C, Najac C, Döring A, et al. Diffusion-weighted MR spectroscopy: consensus, recommendations and resources from acquisition to modelling. May 2023. doi:10.48550/arXiv.2305.10829
- Koolschijn RS, Clarke WT, Ip IB, Emir UE, Barron HC. Event-related functional magnetic resonance spectroscopy. NeuroImage. 2023;276:120194. doi:10.1016/j.neuroimage.2023.120194
- Chong DGQ, Kreis R, Bolliger CS, Boesch C, Slotboom J. Two-dimensional linear-combination model fitting of magnetic resonance spectra to define the macromolecule baseline using FiTAID, a Fitting Tool for Arrays of Interrelated Datasets. Magn Reson Mater Phys Biol Med. 2011;24(3):147-164. doi:10.1007/s10334-011-0246-y
- Zöllner HJ, Považan M, Hui SCN, Tapper S, Edden RAE, Oeltzschner G. Comparison of different linear-combination modeling algorithms for short-TE proton spectra. NMR Biomed. 2021;34(4):e4482. doi:10.1002/nbm.4482
- Clarke WT, Ligneul C, Cottaar M, Ip IB, Jbabdi S. Universal Dynamic Fitting of Magnetic Resonance Spectroscopy. June 2023:2023.06.15.544935. doi:10.1101/2023.06.15.544935
- Oeltzschner G, Zöllner HJ, Hui SCN, et al. Osprey: Open-source processing, reconstruction & estimation of magnetic resonance spectroscopy data. J Neurosci Methods. 2020;343:108827. doi:10.1016/j.jneumeth.2020.108827
- Gong T, Hui SCN, Zöllner HJ, et al. Neurometabolic timecourse of healthy aging. NeuroImage. 2022;264:119740. doi:10.1016/j.neuroimage.2022.119740
- Hui SCN, Gong T, Zöllner HJ, et al. The Macromolecular MR Spectrum Does Not Change with Healthy Aging. Magn Reson Med. 2022;87(4):1711-1719. doi:10.1002/mrm.29093
- Choi IY, Andronesi OC, Barker P, et al. Spectral editing in 1H magnetic resonance spectroscopy: Experts’ consensus recommendations. NMR Biomed. 2021;34(5):e4411. doi:10.1002/nbm.4411
Figures