1252
RF Power Amplifier Drift Compensation for Reliable B1 Mapping Using Bloch-Siegert Technique1Max Planck Institute for Biological Cybernetics, Tübingen, Germany, 2Department of Biomedical Magnetic Resonance, University of Tübingen, Tübingen, Germany
Synopsis
Keywords: Artifacts, Reproductive, RFPA, Drift, Bloch-Siegert, B1
Motivation: RFPA drift affects reproducibility of B1+ mapping
Goal(s): The goal of study is to investigate factors influencing RFPA output drift and introducing a real-time feedback mechanism to compensate for drift
Approach: B1+ with Bloch-Siegert shift technique is measured in a repetitive manner and reproducibility of maps is assessed. The RFPA output is continuously monitored through the use of DICOs, and adjustments to the transmit voltage are made to compensate for drift
Results: The findings indicate that RFPA output drift is more noticeable with extended RF pulses and shorter TR. Implementing real-time drift correction effectively minimizes drift, leading to enhanced stability in B1+ maps
Impact: Our demonstration of real-time feedback to mitigate RFPA drift enhances measurement accuracy and reproducibility. This approach can be advantageous to achieve the consistency and reliability of research, particularly in the context of multi-center studies.
Introduction
Hardware drift in MR, characterized by a gradual shift from its initial state, is a source of degradation of image quality and the consistency of results. Drift of static field, B0, and the consequence are widely recognized and understood for MR imaging and spectroscopy applications1,2. Another aspect which is known but has garnered less attention is the drift of RF power amplifier (RFPA). This component's output drift has the capacity to influence the RF waveform, leading to alterations in excitation profile (intra-pulse drift) and resulting in variable flip-angles (inter-pulse drift) and deposited power.Bloch–Siegert shift (BSS) B1 mapping technique is a phase-based method, expected to be insensitive to T13. BSS employs off-resonance RF pulses are utilized to encode the power of the B1+ field as a phase shift in the spins. Typically, two measurements are taken with off-resonance frequencies of opposite signs. By subtracting these measurements, any phase components unrelated to the B1+ field are eliminated. BSS provides a direct measurement of the B1+ magnitude, therefore, a drift in RFPA output introduces undesired phase shifts. To enhance sensitively, high power off-resonance RFs are applied necessitating an extension of RF duration to reduce SAR. However, elongating the RF pulse duration exposes it to more RFPA drift, potentially diminishing the precision of B1 maps.
In this work, we explore potential factors contributing in RFPA output drift while using BSS technique. We introduce a a real-time feedback and compensation technique aimed at stabilizing all RFs in inter-pulse level.
Methods
All measurements were conducted using a MAGNETOM 9.4T MRI scanner. A 16-channel pTx system was utilized to enable RF transmission. The transmission coils were individually powered by 16 separate RFPAs. Each RF transmission line was equipped with directional couplers (DICOs) responsible for tracking both forward and reflected waveforms. This work utilized the forward values recorded by DICOs to assess RFPA drifts.A FLASH sequence was modified to include a Fermi shape off-resonance pulse which played out at ±5Khz. Data collection involved alternating between opposite off-resonance frequencies. To investigate impact of TR and off-resonance RF length and flip-angle, the sequence was played out with TR values of 25ms and 40ms, RF durations of 5ms and 8ms, and flip-angles of 250o, 400o, and 600o. A single 4 mm isotropic slice was repetitively scanned 10 times, and the variation in B1+ across these scans was evaluated.
The reconstruction pipeline was modified to include concurrent reading and sorting of DICOs output alongside data acquisition. This modification enabled the pipeline to provide immediate feedback during the sequence execution. The first off-resonance RF pulse served as a reference and the transmit voltage of each subsequent pulse was adjusted to achieve a comparable flip-angle to that of the reference. This adjustment can be expressed as follows:
$$SF_{n,c}=\frac{\sum_{m=1}^L\mid RF_{n,c}[m]\mid}{\sum_{m=1}^L\mid RF_{1,c}[m]\mid} \quad n\in\left[2,N\right],c\in\left[1,16\right]$$
Where SFn,c is scale factor calculated for nth RF pulse with L samples and cth Tx channel. Correction factor calculated for nth Fermi pulse was used to correct for n+1th Fermi pulse.
Results and Discussions
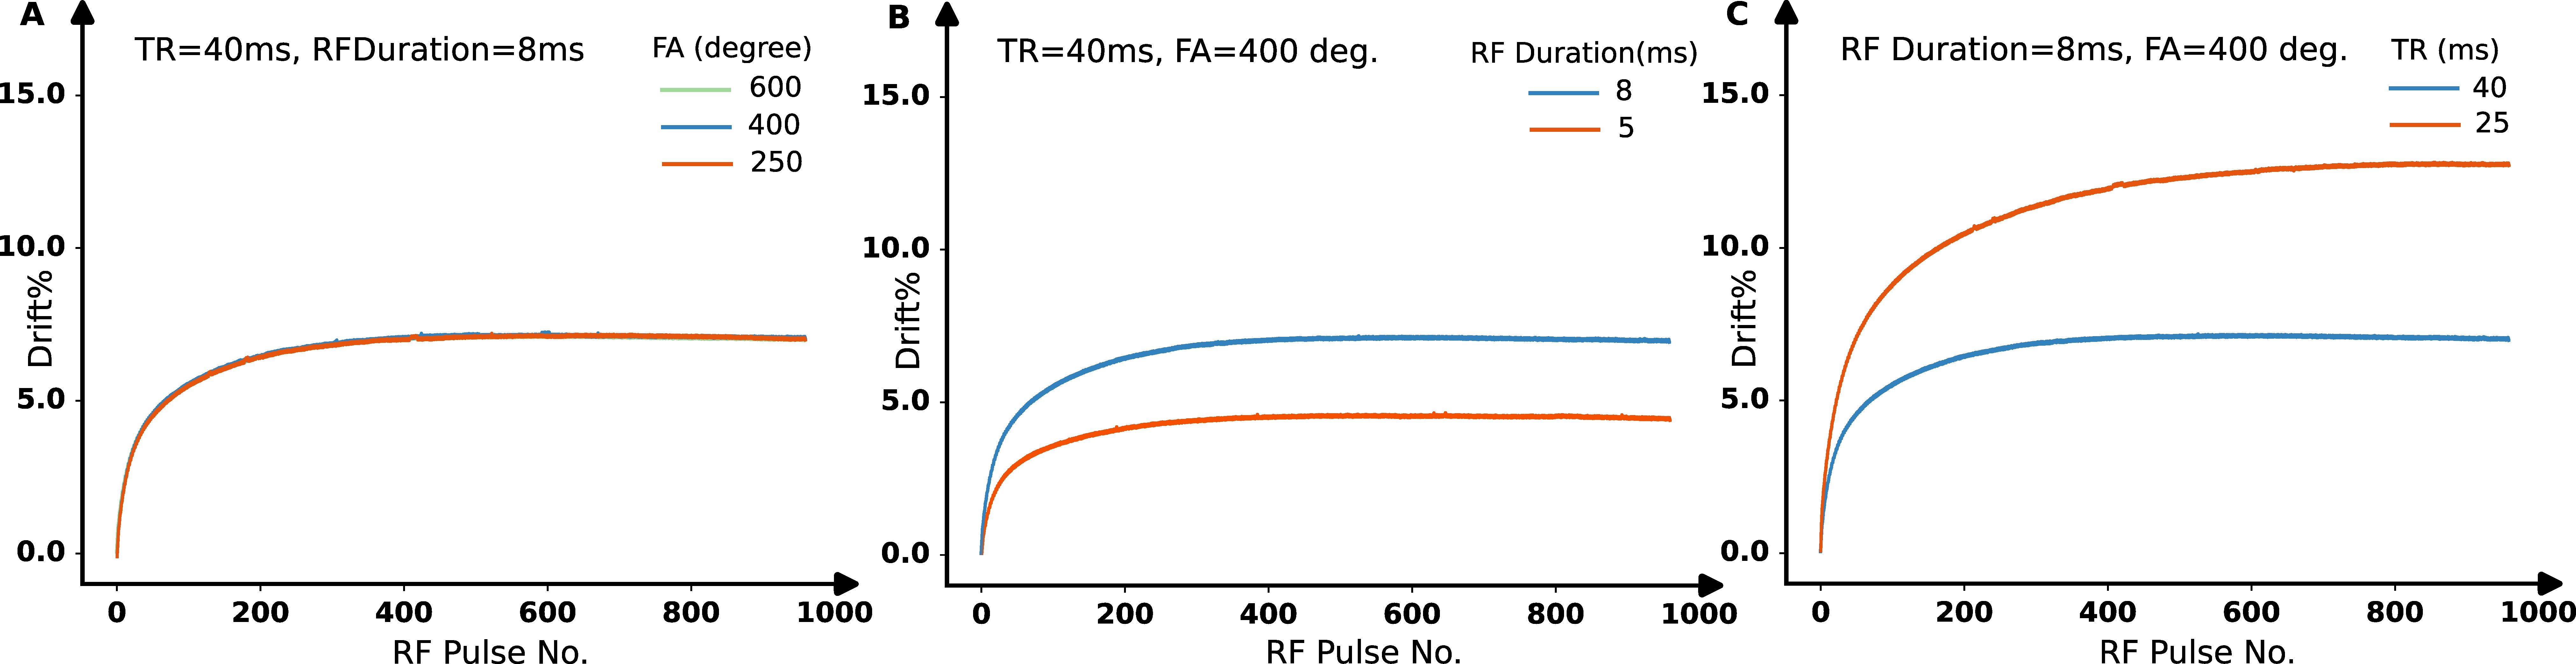
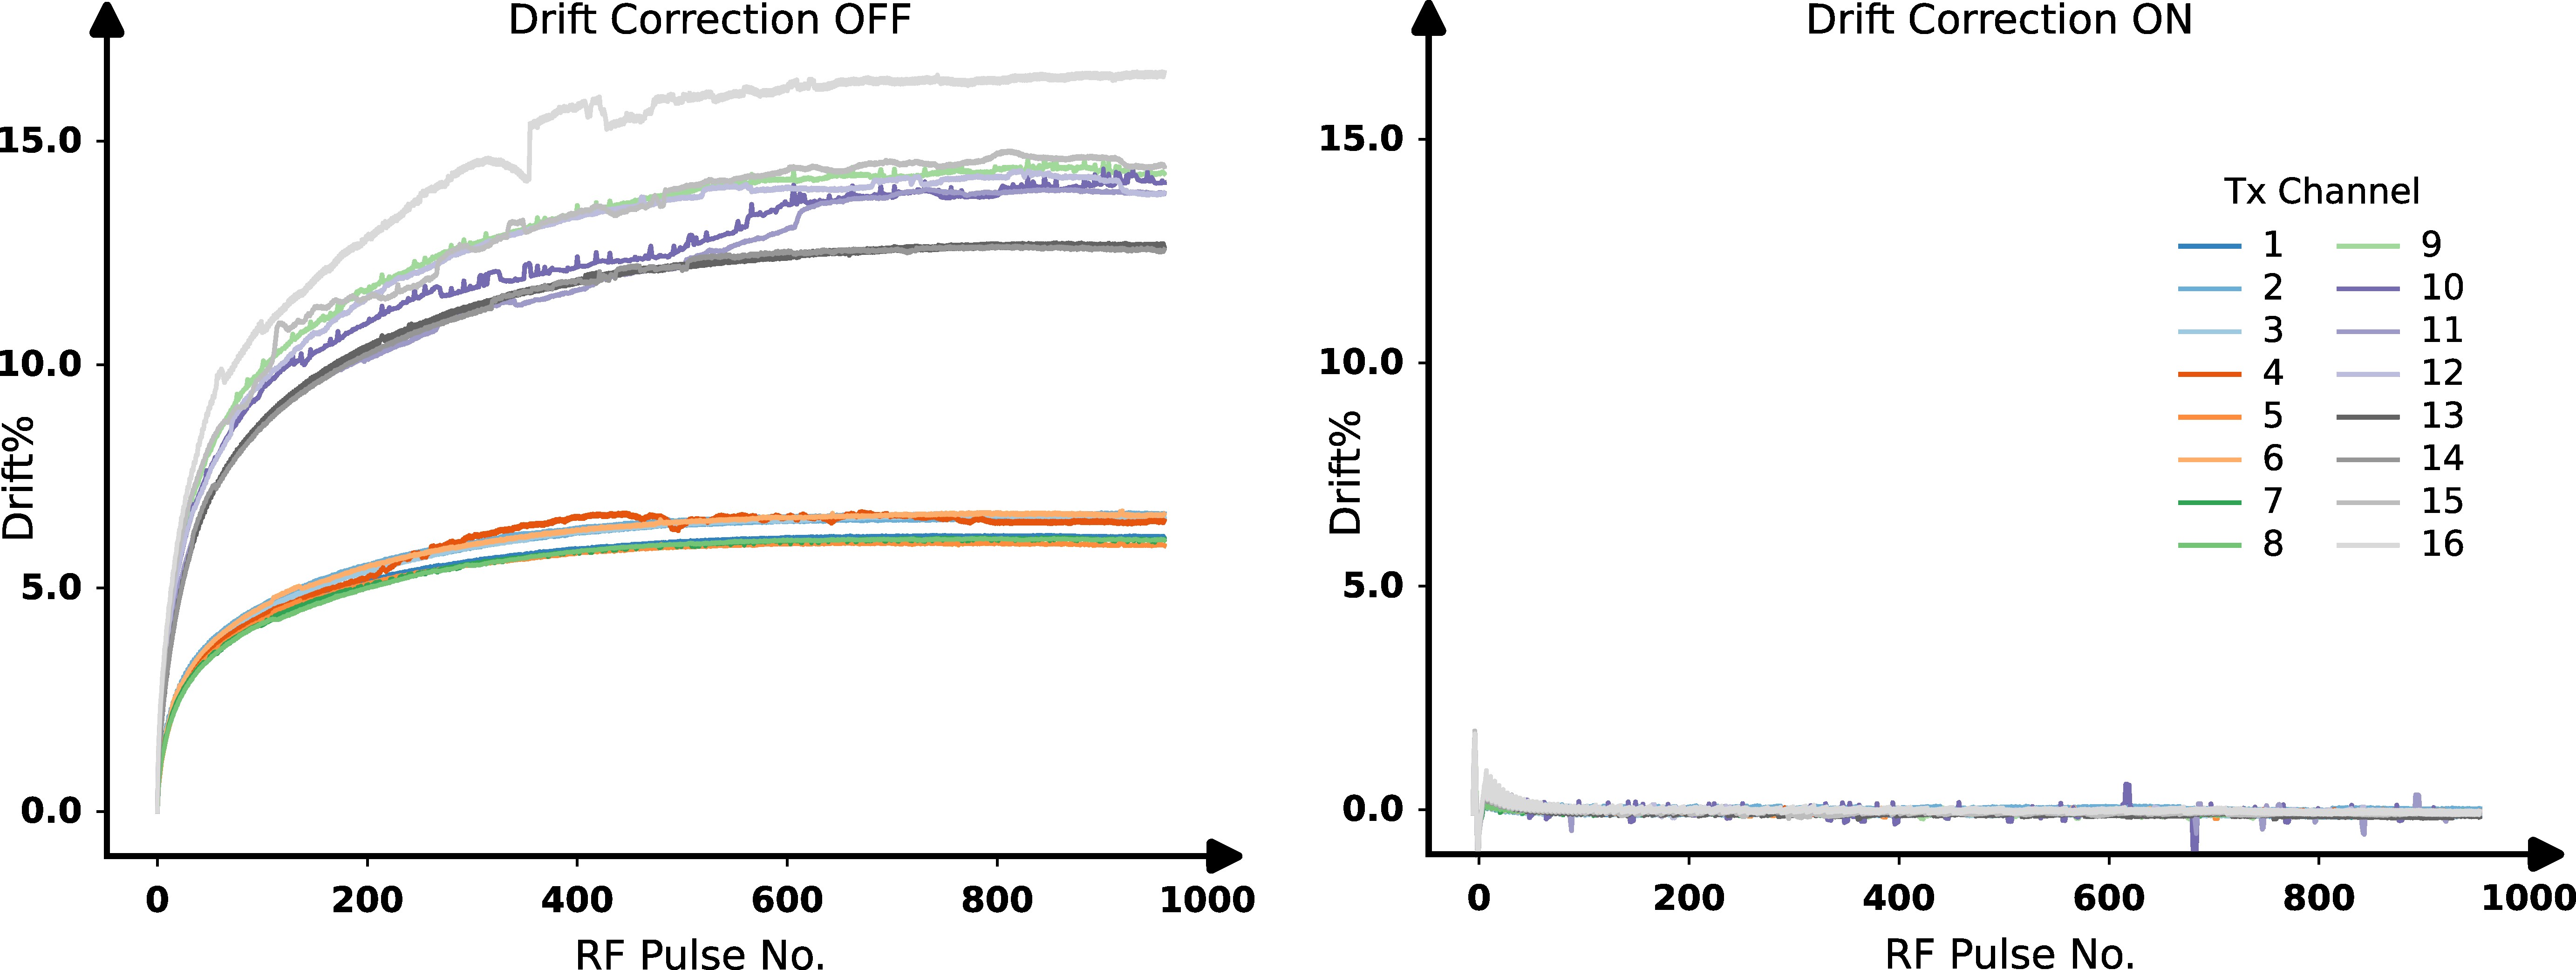
Figure 1 compares impact of TR, RF length and flip-angle on RFPA output drift. For simplicity, the plot represents just one Tx channel, but the behavior of all other Tx channels follows a similar trend. Figure 1 reveals that RFPA output drift is not influenced by the flip-angle. Instead, it becomes more pronounced when the RF pulse is extended or when the TR is shortened.Figure 2 illustrates RFPA output drift across all Tx channels both before and after the implementation of real-time drift correction. The plot is obtained from the experiment with TR=25ms, RF length=8ms, and flip-angle=400o. it can be seen that some RFPAs drift differently. The application of real-time drift correction effectively reduces the average drift of all 16 channels from 11.6% to 1%.
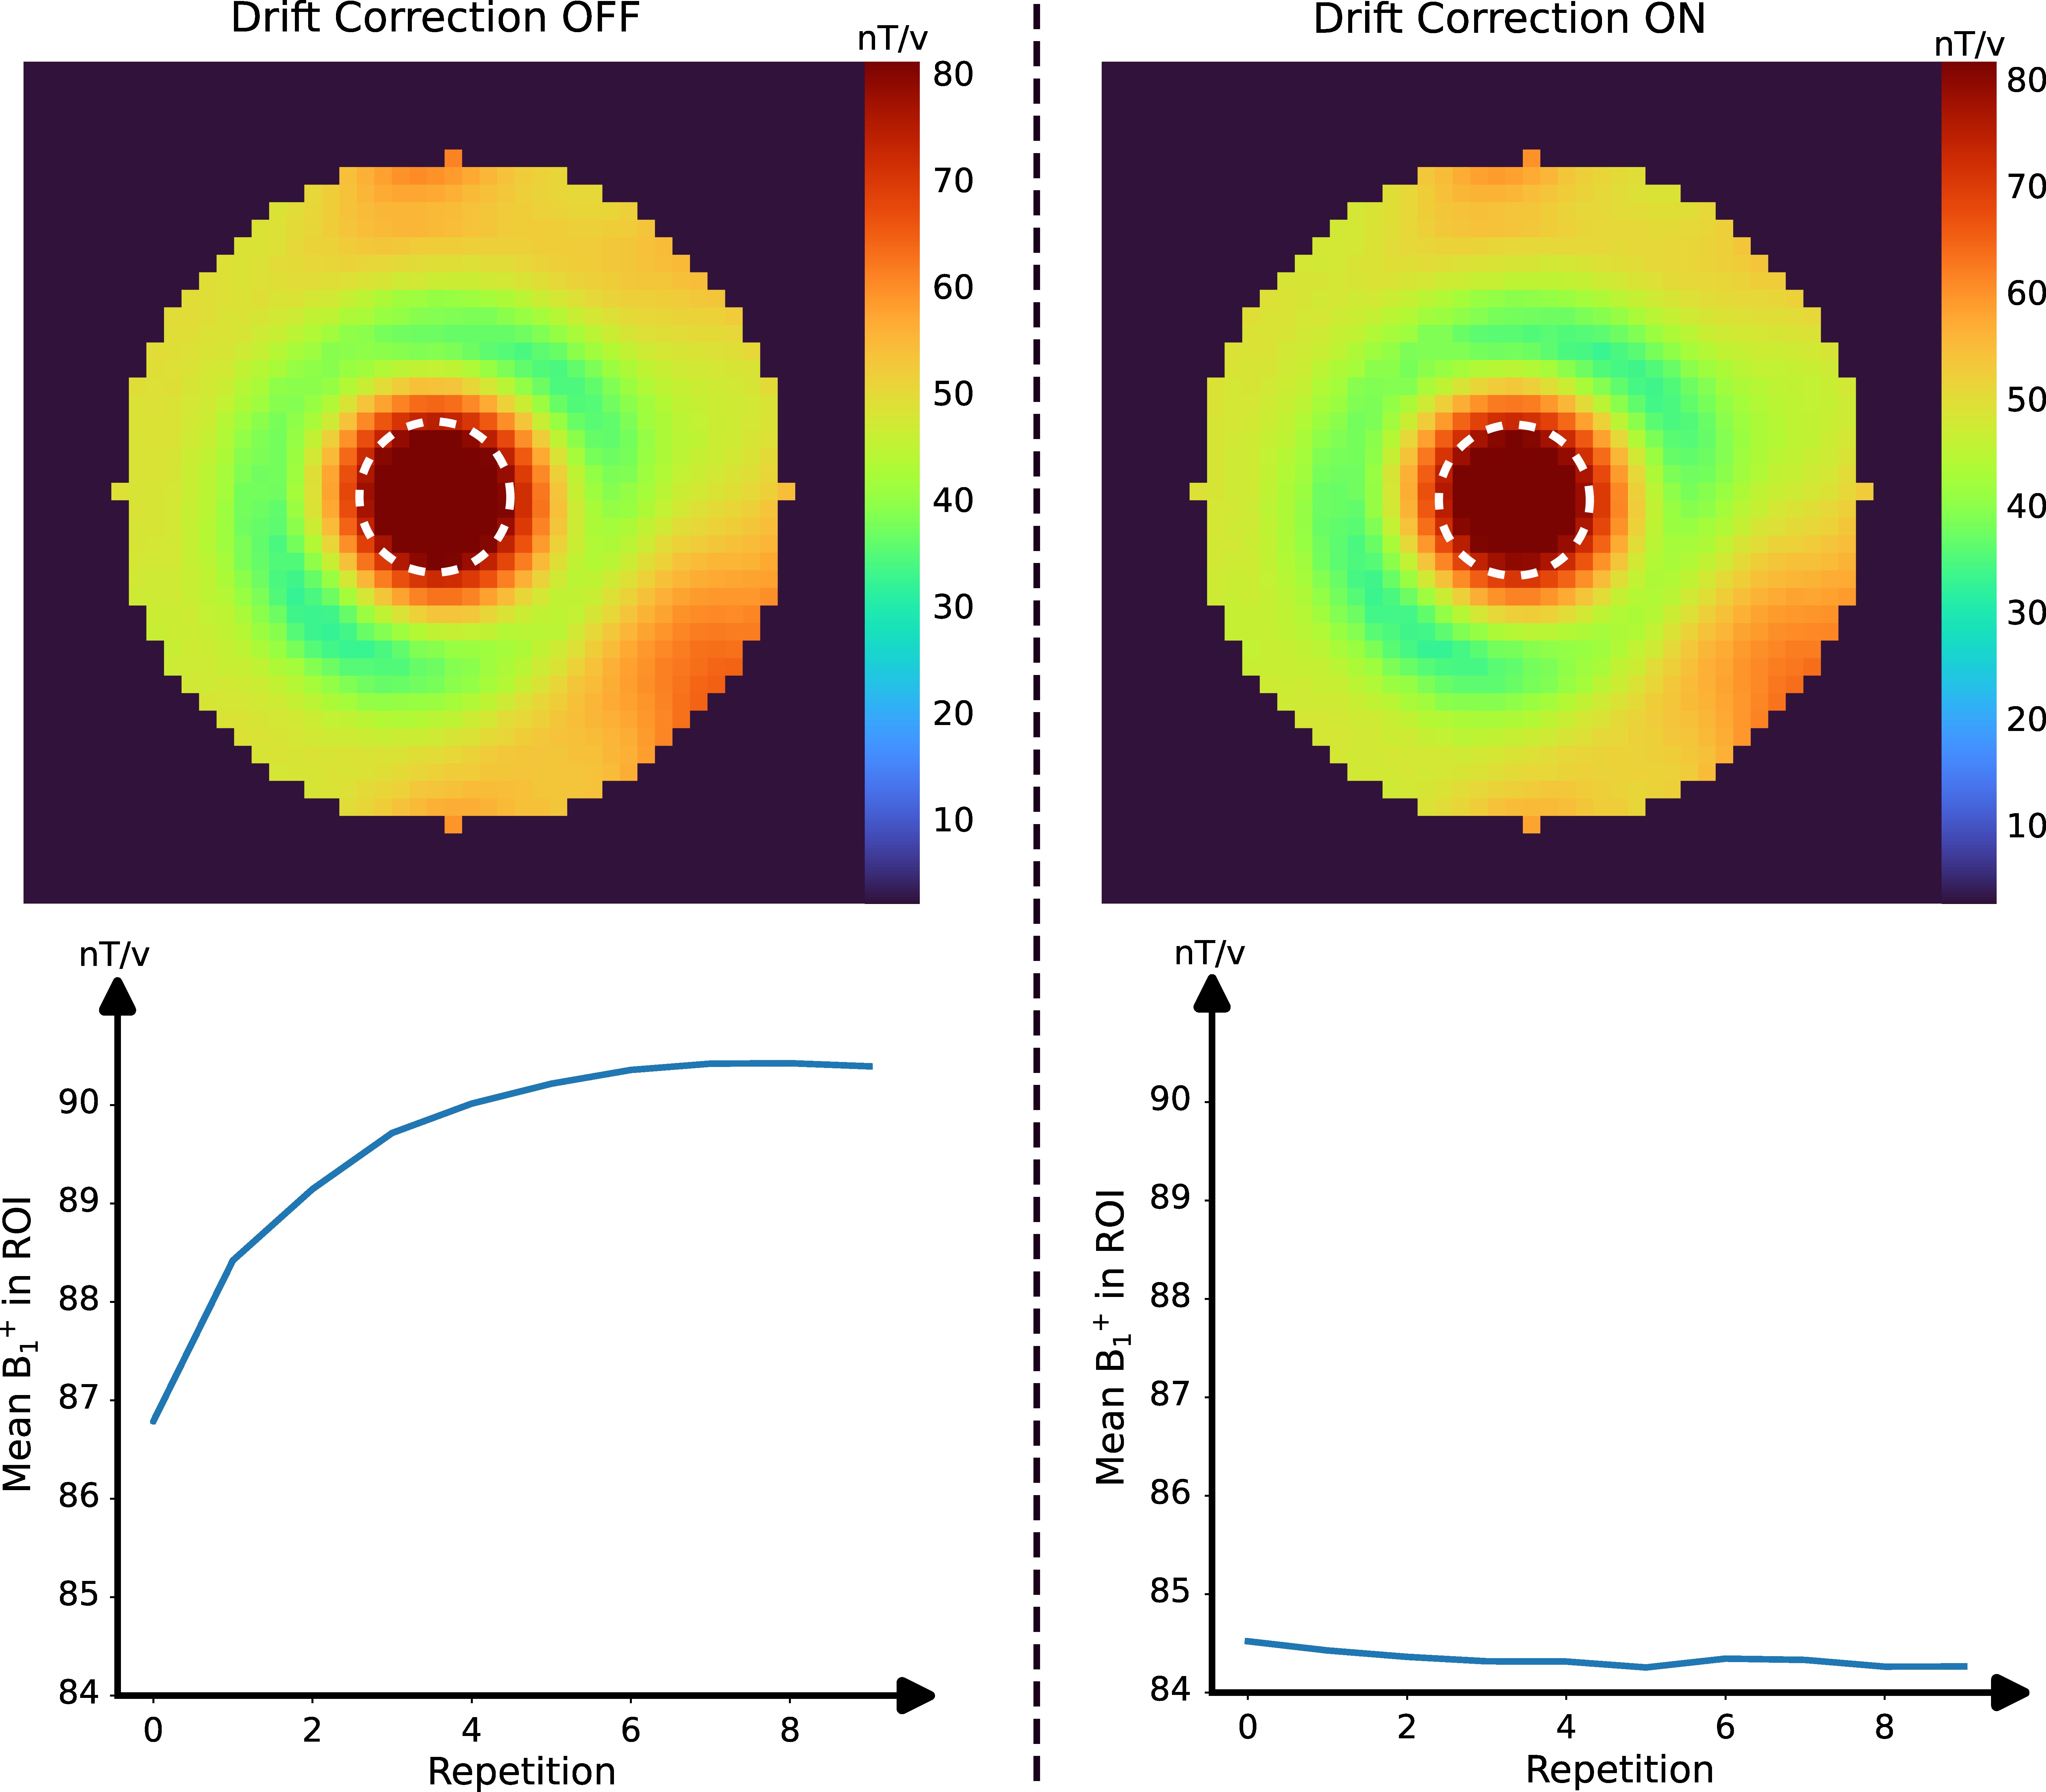
Figure 3 compares B1+ maps obtained using the BSS technique before and after drift correction. These results are from an experiment with a TR of 25ms, RF pulse duration of 8ms, and a flip-angle of 400o, where drift was most pronounced. The top row shows the first repetition, and the bottom row displays the mean B1+ map in the central ROI across 10 repetitions. Without drift correction, B1+ values gradually increase, but they stabilize when drift correction is applied.
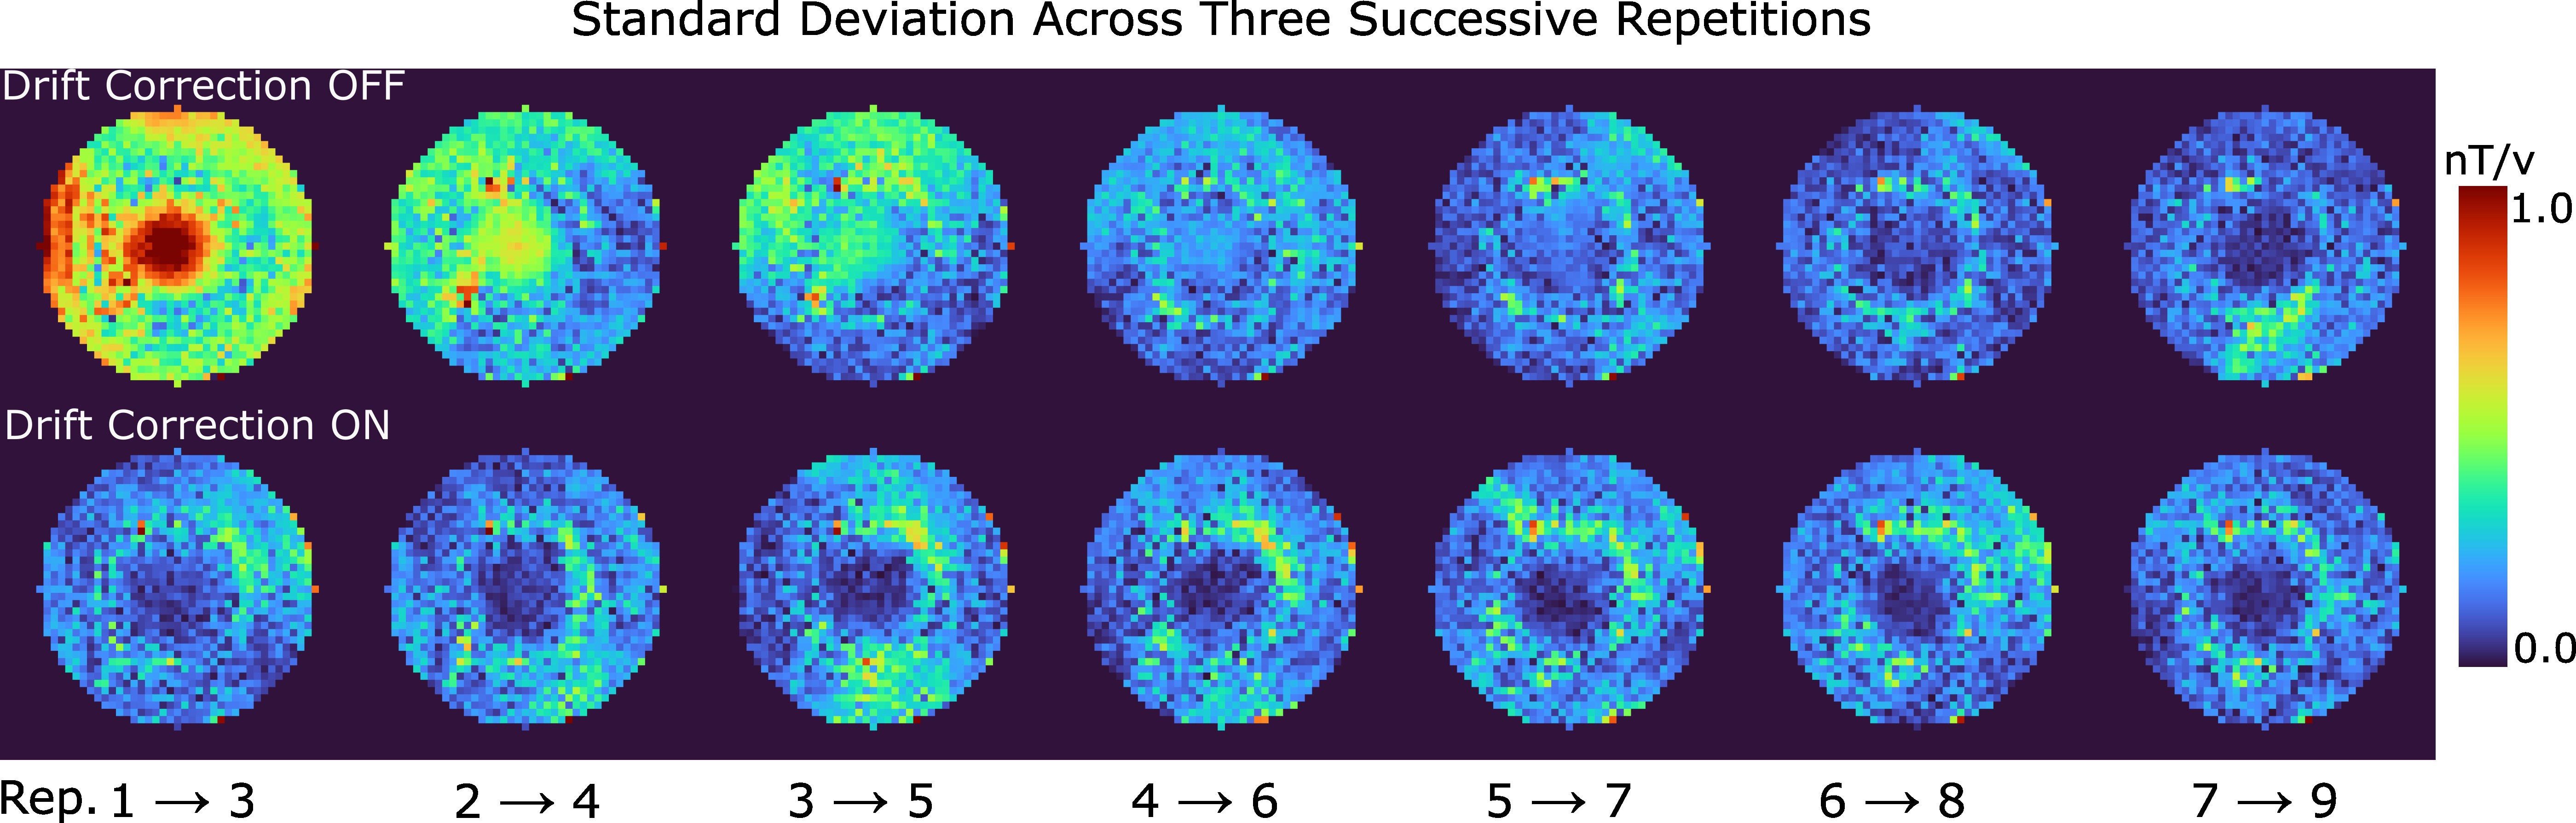
In Figure 4, the voxel-wise standard deviation across three consecutive repetitions of B1+ measurements is presented, both prior to and after the introduction of real-time drift correction. the figure illustrates the initial instability in B1+ values during the first repetitions, which gradually stabilizes in subsequent repetitions when no drift correction is applied.
Acknowledgements
No acknowledgement found.References
1. Vos, S. B., Tax, C. M., Luijten, P. R., Ourselin, S., Leemans, A., & Froeling, M. (2017). The importance of correcting for signal drift in diffusion MRI. Magnetic resonance in medicine, 77(1), 285–299. https://doi.org/10.1002/mrm.26124
2. Near, J., Edden, R., Evans, C. J., Paquin, R., Harris, A., & Jezzard, P. (2015). Frequency and phase drift correction of magnetic resonance spectroscopy data by spectral registration in the time domain. Magnetic resonance in medicine, 73(1), 44–50. https://doi.org/10.1002/mrm.25094
3. Sacolick, L. I., Wiesinger, F., Hancu, I., & Vogel, M. W. (2010). B1 mapping by Bloch-Siegert shift. Magnetic resonance in medicine, 63(5), 1315–1322. https://doi.org/10.1002/mrm.22357
Figures