1245
Associations between blood markers of redox regulation and brain white matter microstructure display distinct signatures in psychosis1Lausanne University Hospital (CHUV), Lausanne, Switzerland, 2University of Lausanne, Lausanne, Switzerland, 3University of Lausanne (UNIL), Lausanne, Switzerland
Synopsis
Keywords: Psychiatric Disorders, White Matter, biomarker, diffusion, DKI, kurtosis, DTI, DWI, psychosis
Motivation: It is unclear whether Glutathione peroxidase (GPx) and reductase (GRed) activity, peripheral proxy of redox homeostasis, could be linked to white matter alterations in psychosis.
Goal(s): We seek to link white matter alterations to processes connected to neuroinflammation, namely raising from dysregulation of the glutathione redox homeostasis.
Approach: We applied diffusion kurtosis imaging and White Matter Tract Integrity – Watson to patients data and analyzed the maps via Tract-Based Spatial Statistics(TBSS) and regression contrast analysis.
Results: We found selective and widespread association of kurtosis metrics with glutathione redox enzymes that significantly dissociate between patients and controls.
Impact: Our findings reveal that Redox GSH dysregulation in patients may impact WM microstructure, indicating therapeutic possibilities and reinforcing the connection between microstructure and neuroinflammation. Furthermore, the neat selectivity of the kurtosis metrics highlights potential for widespread clinical research applications.
Introduction
Recent developments in schizophrenia (SZ) research implicated both dysregulation of redox homeostasis1 and white matter (WM) alterations2,3. The balance between oxidative and reductive reactions of the glutathione (GSH) redox system is key for the protection and detoxification of the brain from the harmful action of the oxidative stress caused by reactive oxygen species (ROS)1,4. One way to measure such homeostasis is via peripheral blood GSH system levels. It remains unclear however whether these blood biomarkers could be linked to white matter alterations. Here, we aim to link peripheral blood Glutathione peroxidase (GPx) and reductase (GRed) activity with WM microstructure estimated using diffusion MRI (dMRI), in patients suffering from early psychosis (EP) and SZ.Methods
Data from 185 subjects (Table 1) were collected on two scanners (Siemens 3T Prisma and Trio), divided as N=86 healthy individuals (HC) and N=99 patients (PT) either with EP or SZ. MRI: Diffusion-weighted images were acquired using a PGSE-EPI sequence (TE/TR = 0.144/6.1 s, 2-mm isotropic resolution, 15 b-values, range 0-8 ms/μm2, Cartesian q-space coverage totaling 129 (Trio, Prisma) or 257 (Trio) images were acquired. After standard preprocessing6, diffusion and kurtosis tensors as well as derived scalar maps (axial, mean, radial diffusivity and kurtosis, and fractional anisotropy) were estimated from data with b≤2.5 ms/μm2. The White Matter Tract Integrity – Watson7 (WMTI-W) model parameters were computed using an in-house Python script. Individual maps were spatially aligned to build a study-specific template. A WM skeleton was obtained from the FA template and the voxel-wise values along the skeleton, for each scalar map, were harmonized to reduce the scanner effect using ComBat8. Blood biomarkers: Blood GPx and GRed activities in red blood cells were measured with two different readers and expressed as nmole NADPH used min/g hemoglobin9,10. Batch effects between plate readers were also corrected via ComBat for biological data11. Statistical analysis: GPx and GRed measures were further investigated by stratifying the cohort following: {ratio < Q(p)} where ratio indicates the GPx/GRed-ratio (Fig.1) of the HC and p a p-quantile of {0.25, 0.50, 0.75, 1}. The four quantile-defined subgroups were then investigated per dMRI metric and biomarker via FSL’s Tract-Based Spatial Statistics (TBSS) and regression analysis, correcting for age, sex and blood sample-scan interval.Results
Differences between dMRI metrics can be found in our previous work12. TBSS analysis showed the most widespread significant clusters of correlation between dMRI metrics and blood biomarkers when considering the GPx/GRed-ratio<Q(0.5) subgroup (light and dark blue in Fig.1, Table 2). The most pronounced relationship between dMRI metrics and blood redox markers was driven by mean kurtosis (MK). When contrasting the slope estimates of MK to GPx between PT and HC, up to 12% of the skeleton voxels were found to be significant with a positive contrast (Fig.2A), reinforced by a positive association of MK to GPx in PT and a negative association in HC (Fig. 3A). In PT, GPx showed small clusters of positive association with MK and negative association with De,// (Table 2).GRed also showed a preference of association with kurtosis metrics. The slope contrast between PT and HC was also positive and significant in 31% of voxels of MK (Figs. 2B and 3B) and to a lesser extent AK (~1.5%). Interestingly, in HC, higher values of GRed were associated with significantly lower mean kurtosis (~10% voxels). In the ratio<Q(0.75) subgroup and in the whole cohort, the significant and positive contrast found in MK was less widespread, covering respectively 10.6% and 16.2% of voxels (not shown). No major associations or clusters were found in ratio<Q(0.25), between the GPx/GRed-ratio and any of the subgroups or metrics (not shown).
Discussion and conclusion
Overall, among the diffusion metrics, MK was the most associated with changes in the blood redox biomarker levels. MK is considered a proxy measure for tissue complexity7,13 that has been shown to be sensitive to neuroinflammatory states13 which can be caused by uncontrolled oxidative or reductive distress1,2. Our results show a dissociation in the slopes between HC and PT when relating MK with GPx and GRed, particularly strong in the individuals with lower-than-median GPx/Gred-ratio. Namely, while for HC the associations were negative, PT’s MK showed weak but positive relations with GPx and GRed, thus having an opposite trend and the strong contrasts. These results, together with previous findings in male prefrontal cortex14 and post-mortem15 suggest Redox GSH dysregulation in patients that affects the WM microstructure.Acknowledgements
T. Pavan and I. Jelescu are supported by SNSF Eccellenza PCEFP2_194260. Dr Alameda is supported by Carigest fellowship and by Frutiger Adrian et Simone fellowship.References
[1] Dwir et al., Int. J. Neuropsychopharmacology 2023. [2] Kelly et al., Mol Psychiatry 2018. [3] Kubicki et al., Curr. Opin. Psychiatry 2014. [4] Cuenod et al., Mol Psychiatry 2021. [5] Tamnes & Agartz, J. Am. Acad. Child Adolesc. Psychiatry 2016. [6] Ades-Aron et al., Neuroimage 2018 [7] Jespersen et al., Neuroimage 2018. [8] Fortin et al., Neuroimage 2017. [9] Long et al., Biochem Bioph Res Co. 1961. [10] Günzler et al., Blood. Clin. Chem. Lab. Med. 1974 [11] Johnson et al., Biostatistics 2007. [12] Pavan et al. abstract 2788, ISMRM 2023 [13] Jelescu et al. Ch. 2, Imaging neuroinflammation 2023. [14] Xin et al. 2016. [15] Yao et al. Disease Markers 2006.Figures
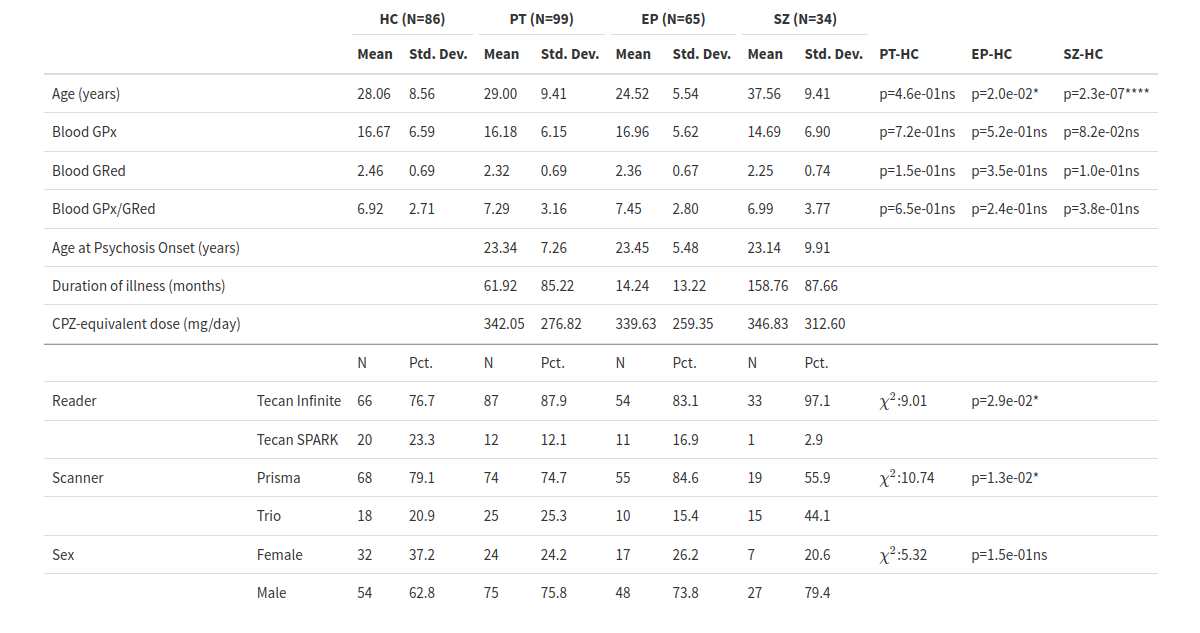
Table1: Study demographics. Age differences are tested via Wilcoxon test while factor proportions via Chi-squared test. HC, healthy controls; PT, psychosis patients (EP + SZ); EP, early psychosis; SZ, schizophrenic; GPx, glutathione peroxidase; GRed, glutathione reductase; CPZ, chlorpromazine; Reader, blood biomarker plate reader; Scanner, MRI. p-value; *:p≤5e-2, **:p≤1e-2, ***:p≤1e-3, ****:p≤1e-4.
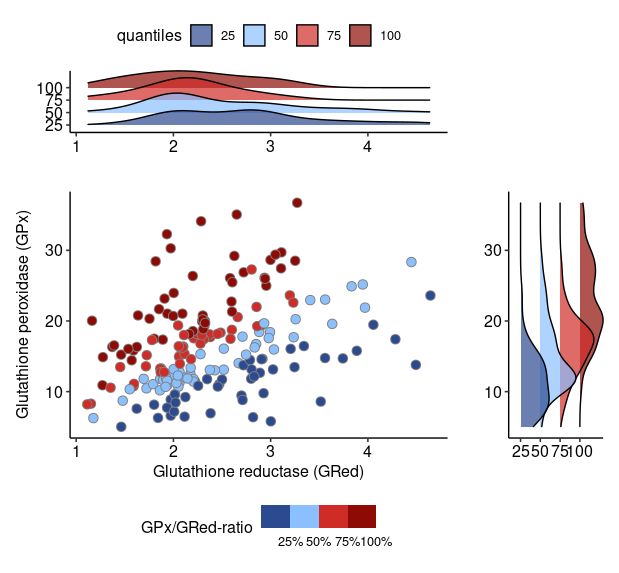
Figure 1: Relationship between glutathione peroxidase (GPx) and glutathione reductase (GRed), colored by the GPx/GRed-ratio quantiles analyzed in this study. To protect the brain from ROS, GSH is oxidized by the catalyzing enzyme GPx to glutathione disulfide (GSSG). After the detoxification, GSSG is then recycled by GRed to its original state (GSH), completing the GSH redox cycle1. Thus, the balance between GPx and GRed, expressed as the GPx/GRed-ratio acts as a proxy of the GSH redox cycle. The marginal plots indicate the biomarker distributions, divided by quantiles.

Tabe 2: TBSS analysis results for GPx/Gred-ratio<Q(0.5) subgroup. Values indicate the percentage of significant skeleton voxels for a given dMRI metric and contrast. Signs indicate the type of slope contrast; plus: βPT - βHC > 0, βHC > 0, βPT > 0; minus: βPT - βHC < 0, βHC < 0, βPT < 0. MK was the most associated metric with changes in the blood redox biomarker levels: while GRed differences were driven by the HC, GPx clusters seem to be led by the same positive association found in PT.
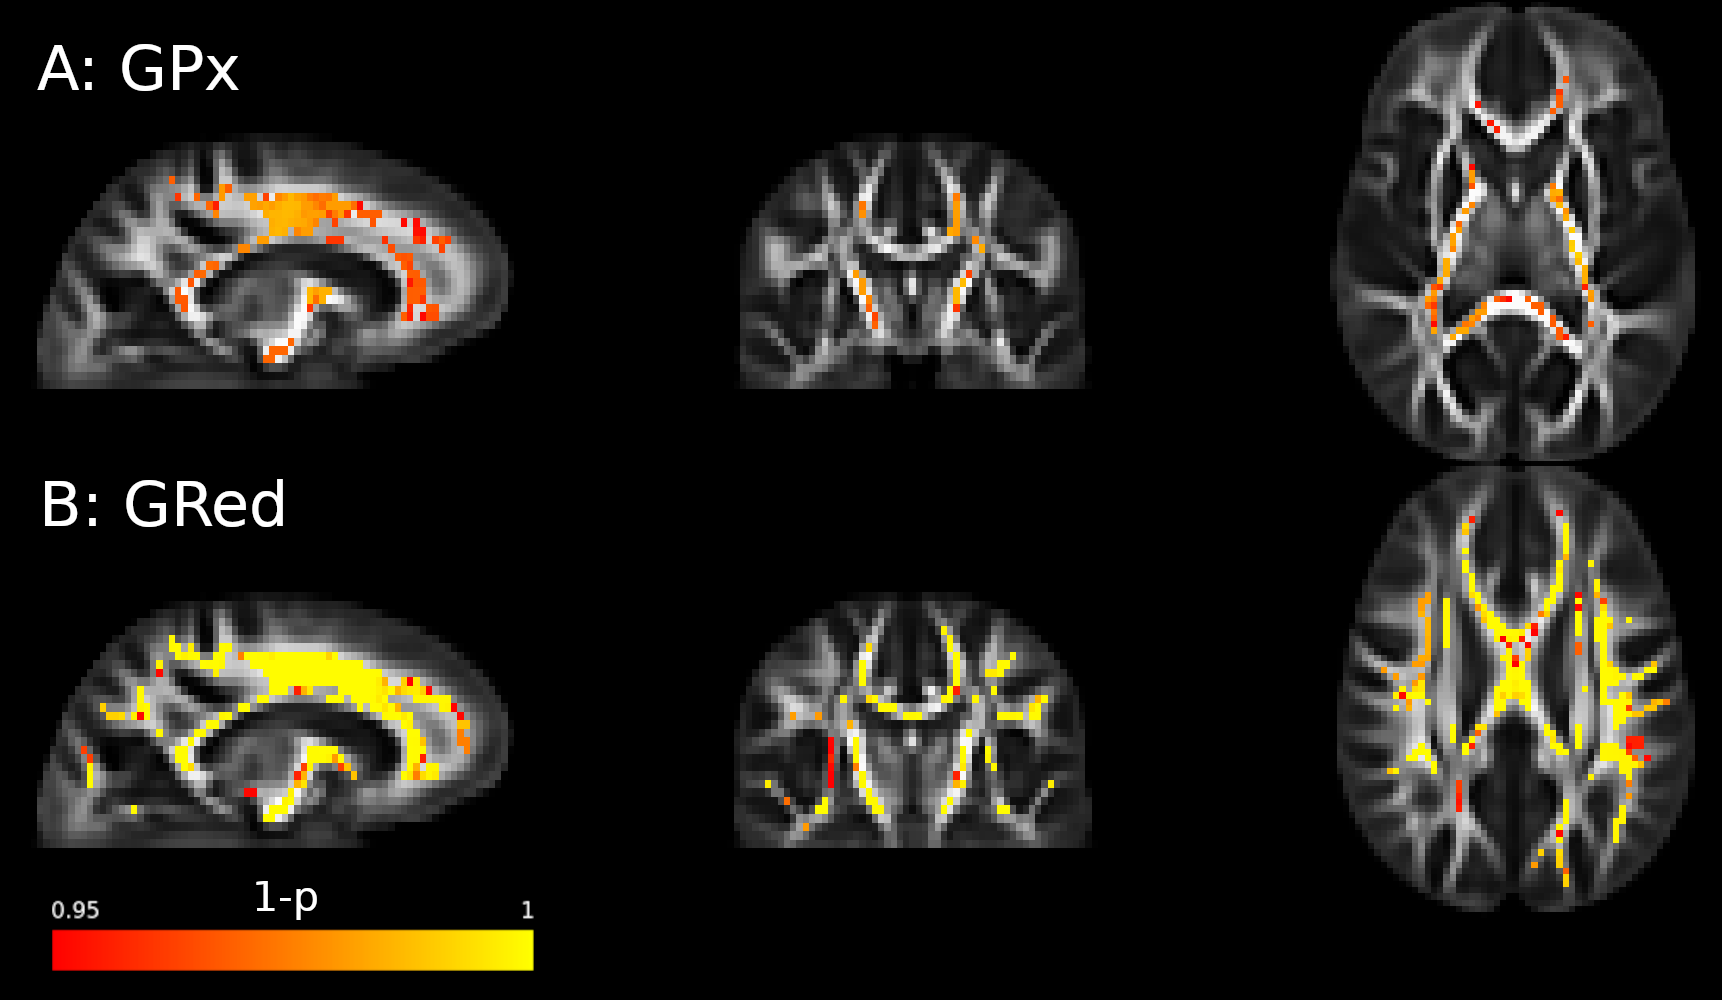
Figure 2: GPx/GRed-ratio < Q(0.5) subgroup: TBSS results of the contrasts, βPT - βHC > 0, of MK to GPx (A), and GRed (B) (see Table 2, columns 1 and 4). Red-to-yellow voxels indicate clusters of significant contrast between the slopes when associating MK with GPx and GRed. Clusters for MK association with GRed are more widespread (~31% voxels, B) than with GPx (~12%, A).
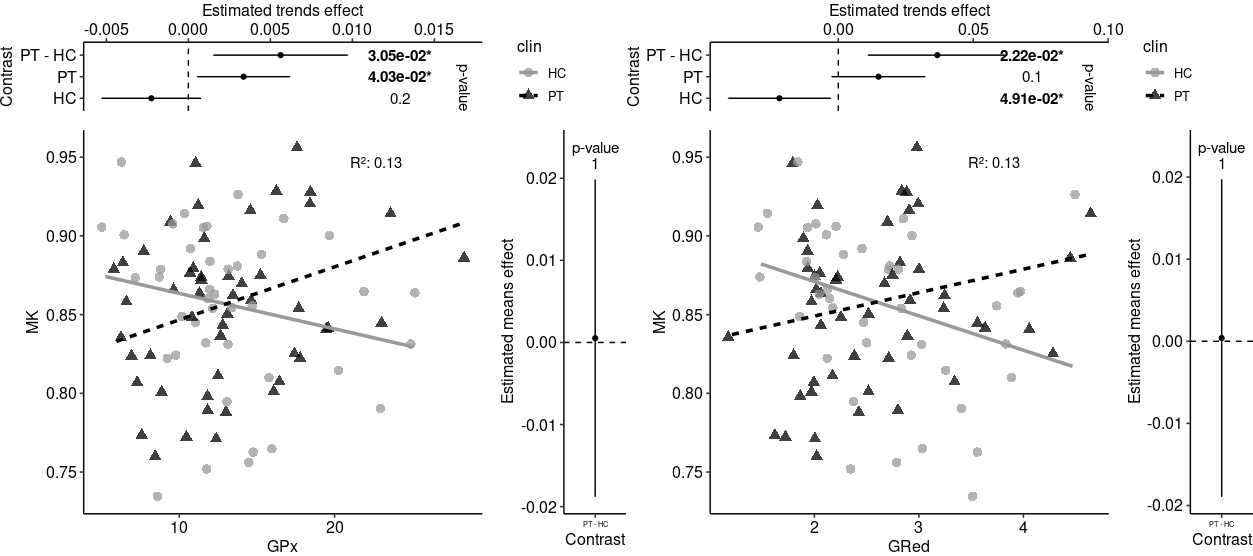
Figure 3: GPx/GRed-ratio < Q(0.5) regression plots and contrasts of the average MK across the whole WM skeleton as a function of GPx (A) and GRed (B) in PT and HC. The marginal plots indicate the contrasts between the estimated intercepts (right, PT-HC: αPT - αHC ≠ 0) and slopes (top, PT-HC: βPT - βHC ≠ 0, PT: βPT ≠ 0, HC: βHC ≠ 0) of the regression models (FDR-corrected). Interestingly, although in each plot one of the PT or HC slopes is significantly associated with the biomarker, the other group shows opposite trends. PT: dotted black line, HC: solid gray line.