1244
Current mood status is associated with future brain MRI readouts, but not the other way around: insights from healthy adults in the UK Biobank1Department of Medical Biophysics, University of Toronto, Toronto, ON, Canada, 2Hurvitz Brain Science Research Program, Sunnybrook Research Institute, Toronto, ON, Canada, 3Department of pharmacology and toxicology, University of Toronto, Toronto, ON, Canada, 4Department of Education, ICT and Learning, Østfold University College, Halden, Norway, 5Department of Medicine, University of Toronto, Toronto, ON, Canada, 6Centre for Youth Bipolar Disorder, The Centre for Addiction and Mental Health, Toronto, ON, Canada
Synopsis
Keywords: Psychiatric Disorders, Psychiatric Disorders, Mood
Motivation: The mood status of an individual can influence the brain anatomy and function.
Goal(s): We studied whether the mood state is associated with brain structural and functional alteration at 2.25 years follow-up and vice versa.
Approach: We focus on the regional brain volumes and task-induced function of the amygdala and primary visual cortex using T1w and task fMRI. Linear models tested for associations between mood and MRI readouts.
Results: Baseline mood score is significantly associated with functional activation in the primary visual cortex. However, baseline volume and functional activation in the amygdala and primary visual cortex are not associated with future mood status.
Impact: We showed that mood status is associated with future functional activation in the primary visual cortex. However, MRI estimates of anatomy and function in the amygdala and primary visual cortex demonstrated a lack of predictive power for future mood status.
Introduction
Brain T1w MRI and task functional MRI (tfMRI) have been used to study brain anatomical and functional alterations. Past literature has reported the association between brain alterations and mood disorders.1 The translation of this imaging research to clinical scenarios has coined the term psychoradiology; however, there is a need to examine the stability and reliability of mood-to-brain associations over time.2 Our study investigates the longitudinal associations between mood status and brain anatomical/functional estimates in the amygdala and primary visual cortex (V1). We hypothesized that 1). The mood status at baseline predicts future amygdala volume, amygdala function, and V1 function; and 2). The amygdala volume/function and V1 function estimates at baseline MRI can predict future mood status.Method
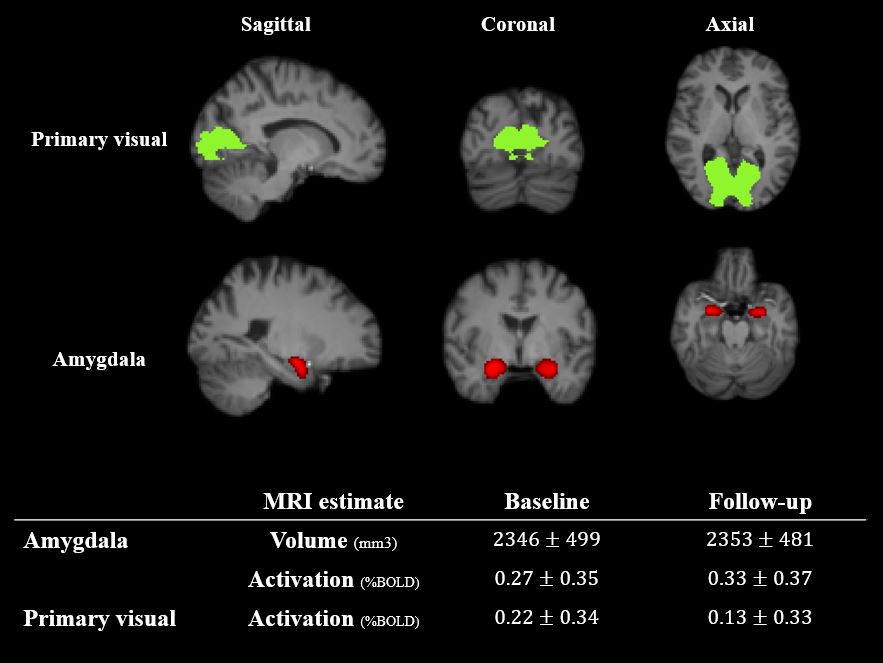
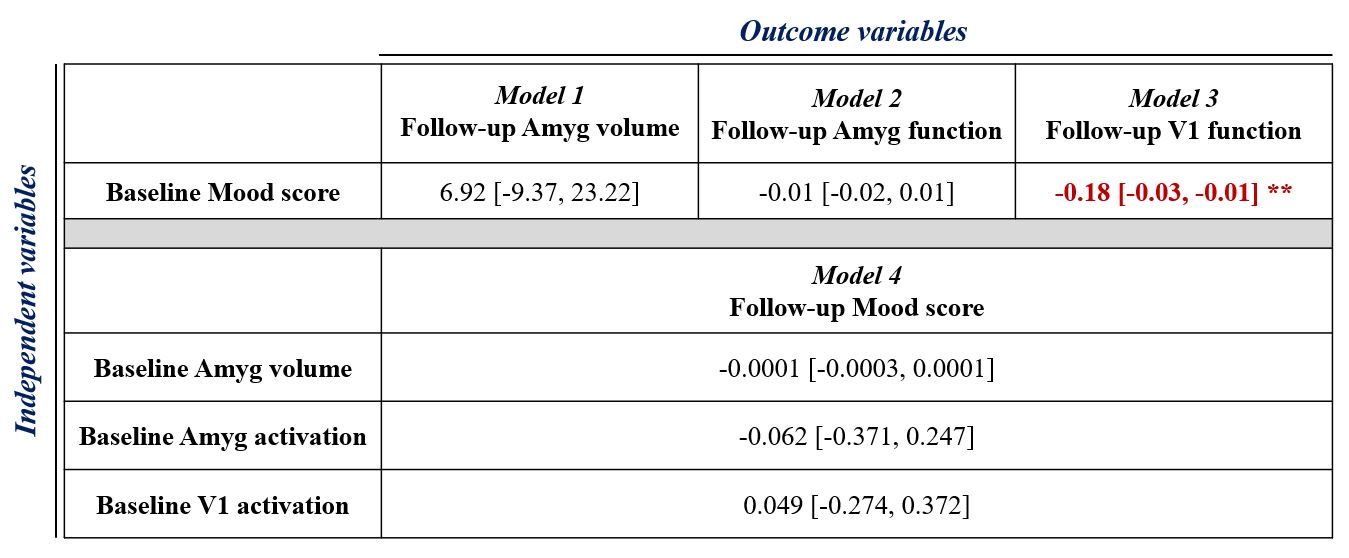
We accessed N=573 adult participants from the UK Biobank. Participants were included if they attended two UK Biobank imaging visits and completed the mood assessment questionnaire, T1w MRI scan, and tfMRI scan. The bilateral amygdala was segmented using the T1w image and FSL-FIRST toolbox. The bilateral V1 was segmented through an MNI-152 template atlas. The Hariri face task paradigm was used during the tfMRI acquisition, and the mean percent BOLD activation in the amygdala and V1 were estimated. The mood assessment included self-report questions about the frequency of depression, tenseness, tiredness, and unenthusiasm in the two weeks prior to the MRI scan using a 4-point scale (0 = Not at all, 1 = Several days, 2 = More than half the days, 3 = Nearly every day). We used principal component analysis (PCA) to create a single mood score for each participant based on the responses. Linear models were used to study the association between mood scores and MRI estimates. Model 1-3 tested whether mood score at baseline significantly affects the prediction of future amygdala volume estimates, future amygdala functional estimates, and future V1 functional estimates, respectively. Model 4 tests whether brain volume and functional activation at baseline can predict future mood status. Age, sex, and brain volume were covariates (Cov.) in all regression models.[1] Follow-up amygdala volume = Baseline ( mood score + amygdala volume ) + Cov.
[2] Follow-up amygdala function = Baseline ( mood score + amygdala function ) + Cov.
[3] Follow-up V1 function = Baseline ( mood score + V1 function ) + Cov.
[4] Follow-up mood score = Baseline ( amygdala volume + amygdala function + V1 function + mood score ) + Cov.
Results
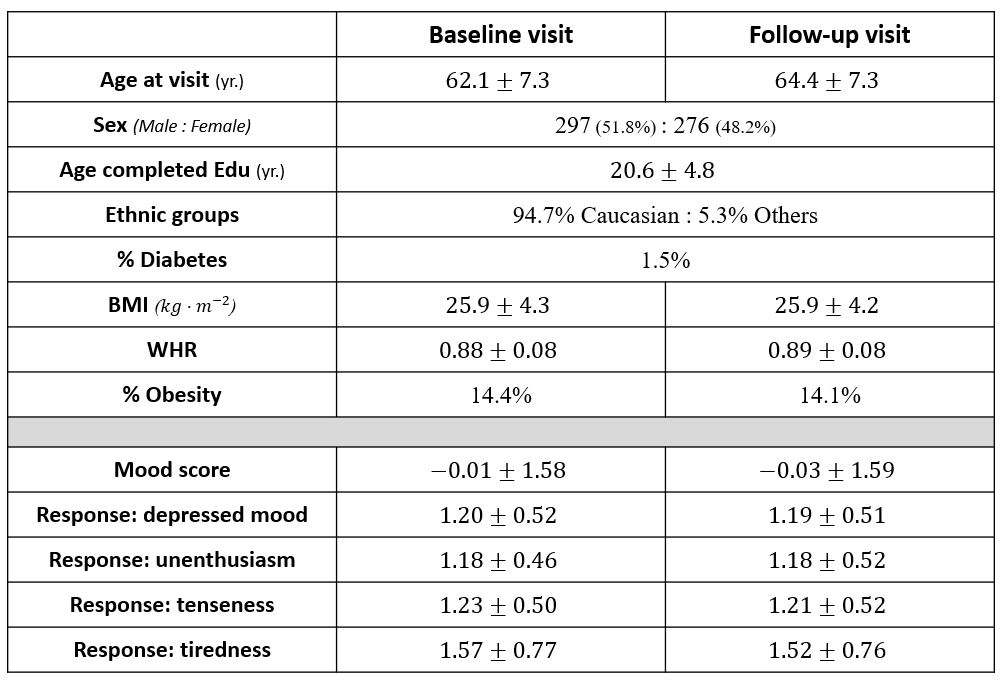
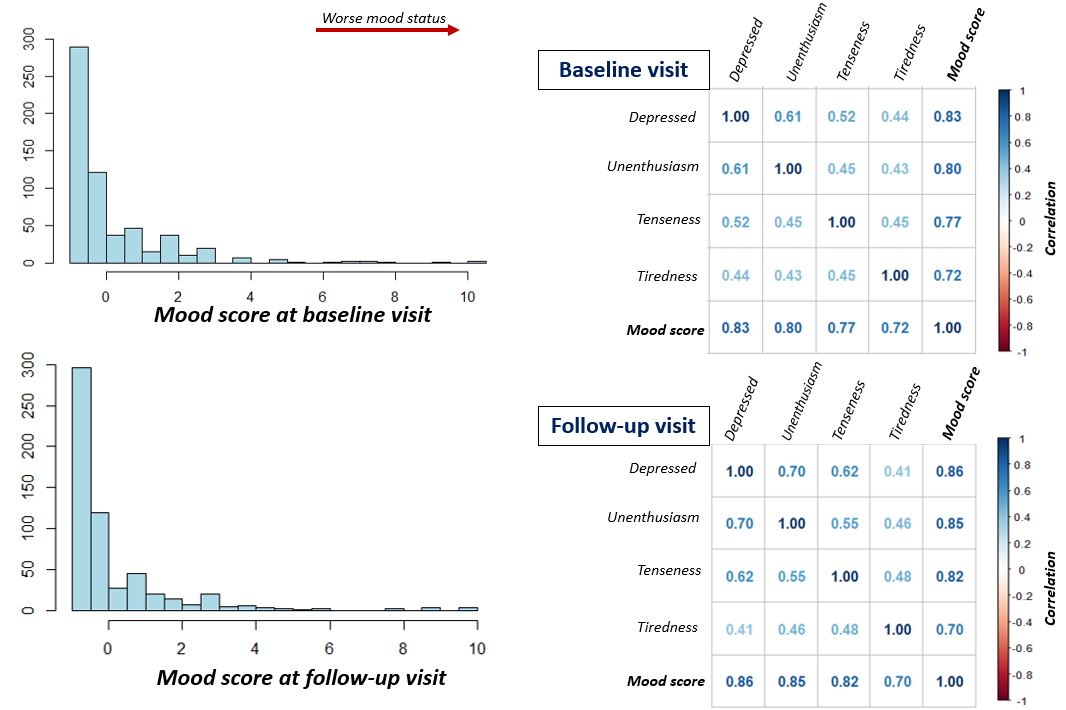
Table 1 summarizes the participant demographics. Follow-up MRI and mood questionnaires were performed years after the baseline visit. Figure 1 shows the raw mood scores in relation to the aggregate mood score. A higher mood score was correlated with more frequent depressed mood, tenseness, tiredness, and unenthusiasm. Figure 2 shows the segmentation of the amygdala and V1 from representative participants and a summary of volume/function estimates in the amygdala and V1. Table 2 summarizes the results from linear models. Regarding Models 1-3, we found that baseline mood score was negatively associated with the follow-up functional activation in V1 (P=0.03, R2 = 0.20) but not follow-up amygdala volume or activation (P=0.40) after accounting for the respective baseline imaging estimate. In model 4, baseline MRI anatomical (P=0.35) and functional estimates (P=0.69 and 0.77 for bilateral amygdala and V1) were not associated with the follow-up mood score.Discussions
Our current study demonstrated that the mood status at baseline assessment was independently associated with the amplitude of visual activation at follow-up, providing partial support for our first hypothesis. However, we did not observe such associations between mood and amygdala MRI estimates. Past studies also showed no association between stress and amygdala volume in healthy participants, suggesting that amygdala atrophy and functional decline are more often observed in patients with mood disorders than in healthy adults.3-4 For our second hypothesis, we found the baseline volume and tfMRI activation was not associated with a future mood state. One possible reason is that the current mood status may have a stronger association with the same-session MRI estimates but not distal data. In summary, we found that mood status was associated with functional activation but not anatomical estimates. In contrast, the selection of MRI-based brain estimates could not predict the future mood status. Future work will include cross-lagged panel models to examine potential causal relationships in the longitudinal mood and MRI data. Additional MRI sequences, notably T2* maps, will also be considered.Acknowledgements
We acknowledge the funding from Canadian Institutes of Health Research.References
[1] Zhuo C, Li G, Lin X, et al. The rise and fall of MRI studies in major depressive disorder. Transl Psychiatry. 2019;9(1):335. Published 2019 Dec 9. doi:10.1038/s41398-019-0680-6
[2] Elliott ML, Knodt AR, Ireland D, et al. What Is the Test-Retest Reliability of Common Task-Functional MRI Measures? New Empirical Evidence and a Meta-Analysis. Psychol Sci. 2020;31(7):792-806. doi:10.1177/0956797620916786
[3] Sublette ME, Galfalvy HC, Oquendo MA, et al. Relationship of recent stress to amygdala volume in depressed and healthy adults. J Affect Disord. 2016;203:136-142. doi:10.1016/j.jad.2016.05.036
[4] Nolan M, Roman E, Nasa A, et al. Hippocampal and Amygdalar Volume Changes in Major Depressive Disorder: A Targeted Review and Focus on Stress. Chronic Stress (Thousand Oaks). 2020;4:2470547020944553. doi:10.1177/2470547020944553
Figures