1242
Brain connectomic and transcriptional signatures of suicidal thoughts and behaviors in major depressive disorder1Department of Radiology, Taihe Hospital, Hubei University of Medicine, Shiyan, China, 2West China Hospital of Sichuan University, Chengdu, China, 3The First Affiliated Hospital of Kunming Medical University, Kunming, China
Synopsis
Keywords: Psychiatric Disorders, Brain
Motivation: Suicide-related connectomic signatures in depression and underlying transcriptional patterns have been poorly understood, most previous findings were limited by small-sample and single-site design.
Goal(s): To identify robust brain structural network deficits associated with suicidal thoughts and behaviors (STB) in major depressive disorder (MDD) and to determine related transcriptional profiles.
Approach: Based on mutlicenter MRI data of over 700 individuals, group-level connectomic comparisons and connectome-transcriptome association were analyzed.
Results: Robust structural connectomic alterations associated with STB in MDD were distributed in the prefrontal, limbic and temporal areas. STB-related connectomic alterations were spatially correlated with genes enriched for cellular metabolism and synaptic signaling.
Impact: These findings reveal a robust pattern of brain structural deficits at network level and demonstrate its linkage to gene expression patterns, which provides novel insights into the neurobiological underpinnings and potential markers for prediction and prevention of STB.
Introduction
Major depressive disorder (MDD) is highly associated with suicidal thoughts and behaviors (STB). Nearly 800,000 people die by suicide every year and more than half of these suicidal deaths are related to depression1. Although numerous MRI studies have investigated brain structural signatures related to STB, most findings were challenged by three major issues. First, previous small-sample and single-site studies largely limited the robustness and generalizability of findings. Second, human brain is typically organized into a complex network which allows for effective information communication and processing2. Network-level disruption regarding STB in depressed individuals is unclear. Third, STB are heritable and genetic causes of STB differ in part from those conferring MDD risk3,4. Nevertheless, how genetic factors shape the brain network alterations related to STB remain poorly understood. Based on above issues, using MRI data from over 700 individuals, this study aimed to identify robust patterns of brain structural network signatures associated with STB in MDD patients and to explore underlying transcriptional profiles.Methods
A total of 711 participants were included from three centers, including 218 MDD patients with STB (MDD-STB), 230 patients without STB (MDD-nSTB) and 263 healthy controls (HC). All the participants received high resolution 3D T1-weighted brain MRI scan at their local sites. Surface area (SA), cortical thickness (CT) and local gyrification index (LGI) were estimated via Freesurfer toolbox, followed by ComBat harmonization for site effects correction5. Individualized structural covariance network was established based on the Destrieux atlas6. Topological metrics of each cortical region, including degree, efficiency and betweenness, were calculated using the GRETNA toolbox7. One-way ANOVA and post-hoc pairwise comparisons were applied to test group differences. We used the partial least square (PLS) regression to explore connectome-transcriptome association. The first component of PLS model (PLS1) were kept and genes with significantly positive or negative contributive weights were extracted. Enrichment analysis was performed to understand the biological pathways related to significant PLS1 genes. To further elucidate the cell-type transcriptional features, we overlapped significant PLS1 genes with the gene set of each canonical cell type.Results
Significant group differences were identified in the right anterior cingulate cortex (ACC), right lateral orbital sulcus (LOS), right transverse temporal gyrus (TTG), right transverse temporal sulcus (TTS), and left middle frontal gyrus (MFG). Compared with HC, MDD-nSTB patients exhibited lower efficiency of the right TTG, and MDD-STB patients exhibited decreased degree of the right ACC and lower efficiency of the right TTG, LOS, and TTS. When directly comparing two MDD groups, MDD-STB exhibited decreased degree in the right ACC and reduced betweenness in the left MFG relative to MDD-nSTB.In the connectome-transcriptome association analysis, we identified two significant gene lists related to SCN topological differences between MDD-STB and MDD-nSTB. Specifically, PLS1+ gene list contained 1432 positively weighted genes that were overexpressed in regions where topological metrics decreased, while PLS1- gene list included 2813 negatively genes that were overexpressed in regions where topological metrics increased. Enrichment analysis further revealed that the PLS1- gene list was significantly enriched in several biological processes related to metabolism of cellular macromolecules and regulation of synaptic signaling (FDR-corrected P < 0.05). For the cell types, PLS1- genes were significantly overlapped with genes distributed in excitatory neurons (n = 226, P < 0.001), astrocytes (n = 219, P < 0.001) and microglia (n = 144, P < 0.001).
Discussion
Based on multicenter MRI data of over 700 participants, this study, for the first time, revealed a robust pattern of structural network disruption related to STB in MDD. We found that network disruption was mainly distributed in ventral and dorsal prefrontal systems8. These two systems contribute to internal emotional states modulation and top-down cognitive/behavior control, respectively8. Of note, the difference between MDD-STB and MDD-nSTB were mainly located in the dorsal prefrontal system, suggesting the generation of STB in depressed individuals may be related to the impaired control of behaviors and inflexible planning. In addition, we identified that STB-related gene expression was enriched in metabolisms of cellular macromolecules and synaptic signaling, as well as astrocytes, excitatory neurons and microglia. Cellular metabolism and synaptic signaling are both related to synaptic plasticity9. Lower neuroplasticity leads to maladaptive coping with stressful events10, and may play an important role in the generation of STB. Astrocytes, excitatory neurons and microglia were invovled in synaptic activity, neurotransmission and neuroinflammation11-13, which have been related to the core pathophysiology of suicide.Conclusions
These findings advance the understanding of the neurobiological mechanisms underlying STB and provide novel insights into potential prevention and intervention targets for depressed patients at risk for future suicide.Acknowledgements
No acknowledgement found.References
1. Cai H, Jin Y, Liu S, Zhang Q, Zhang L, Cheung T, et al. (2021): Prevalence of suicidal ideation and planning in patients with major depressive disorder: A meta-analysis of observation studies. J Affect Disord. 293:148-158.
2. Liao X, Vasilakos AV, He Y (2017): Small-world human brain networks: Perspectives and challenges. Neurosci Biobehav Rev. 77:286-300.
3. Brent DA, Mann JJ (2005): Family genetic studies, suicide, and suicidal behavior. Am J Med Genet C Semin Med Genet. 133c:13-24.
4. Voracek M, Loibl LM (2007): Genetics of suicide: a systematic review of twin studies. Wien Klin Wochenschr. 119:463-475.
5. Fortin JP, Cullen N, Sheline YI, Taylor WD, Aselcioglu I, Cook PA, et al. (2018): Harmonization of cortical thickness measurements across scanners and sites. Neuroimage. 167:104-120.
6. Destrieux C, Fischl B, Dale A, Halgren E (2010): Automatic parcellation of human cortical gyri and sulci using standard anatomical nomenclature. Neuroimage. 53:1-15.
7. Wang J, Wang X, Xia M, Liao X, Evans A, He Y (2015): GRETNA: a graph theoretical network analysis toolbox for imaging connectomics. Front Hum Neurosci. 9:386.
8. Schmaal L, van Harmelen AL, Chatzi V, Lippard ETC, Toenders YJ, Averill LA, et al. (2020): Imaging suicidal thoughts and behaviors: a comprehensive review of 2 decades of neuroimaging studies. Mol Psychiatry. 25:408-427.
9. Marsden WN (2013): Synaptic plasticity in depression: molecular, cellular and functional correlates. Prog Neuropsychopharmacol Biol Psychiatry. 43:168-184.
10. McEwen BS, Gianaros PJ (2011): Stress- and allostasis-induced brain plasticity. Annu Rev Med. 62:431-445.
11. Zhou X, Xiao Q, Xie L, Yang F, Wang L, Tu J (2019): Astrocyte, a Promising Target for Mood Disorder Interventions. Front Mol Neurosci. 12:136.
12. Fullana N, Gasull-Camós J, Tarrés-Gatius M, Castañé A, Bortolozzi A, Artigas F (2020): Astrocyte control of glutamatergic activity: Downstream effects on serotonergic function and emotional behavior. Neuropharmacology. 166:107914.
13. Gonçalves de Andrade E, González Ibáñez F, Tremblay M (2022): Microglia as a Hub for Suicide Neuropathology: Future Investigation and Prevention Targets. Front Cell Neurosci. 16:839396.
Figures
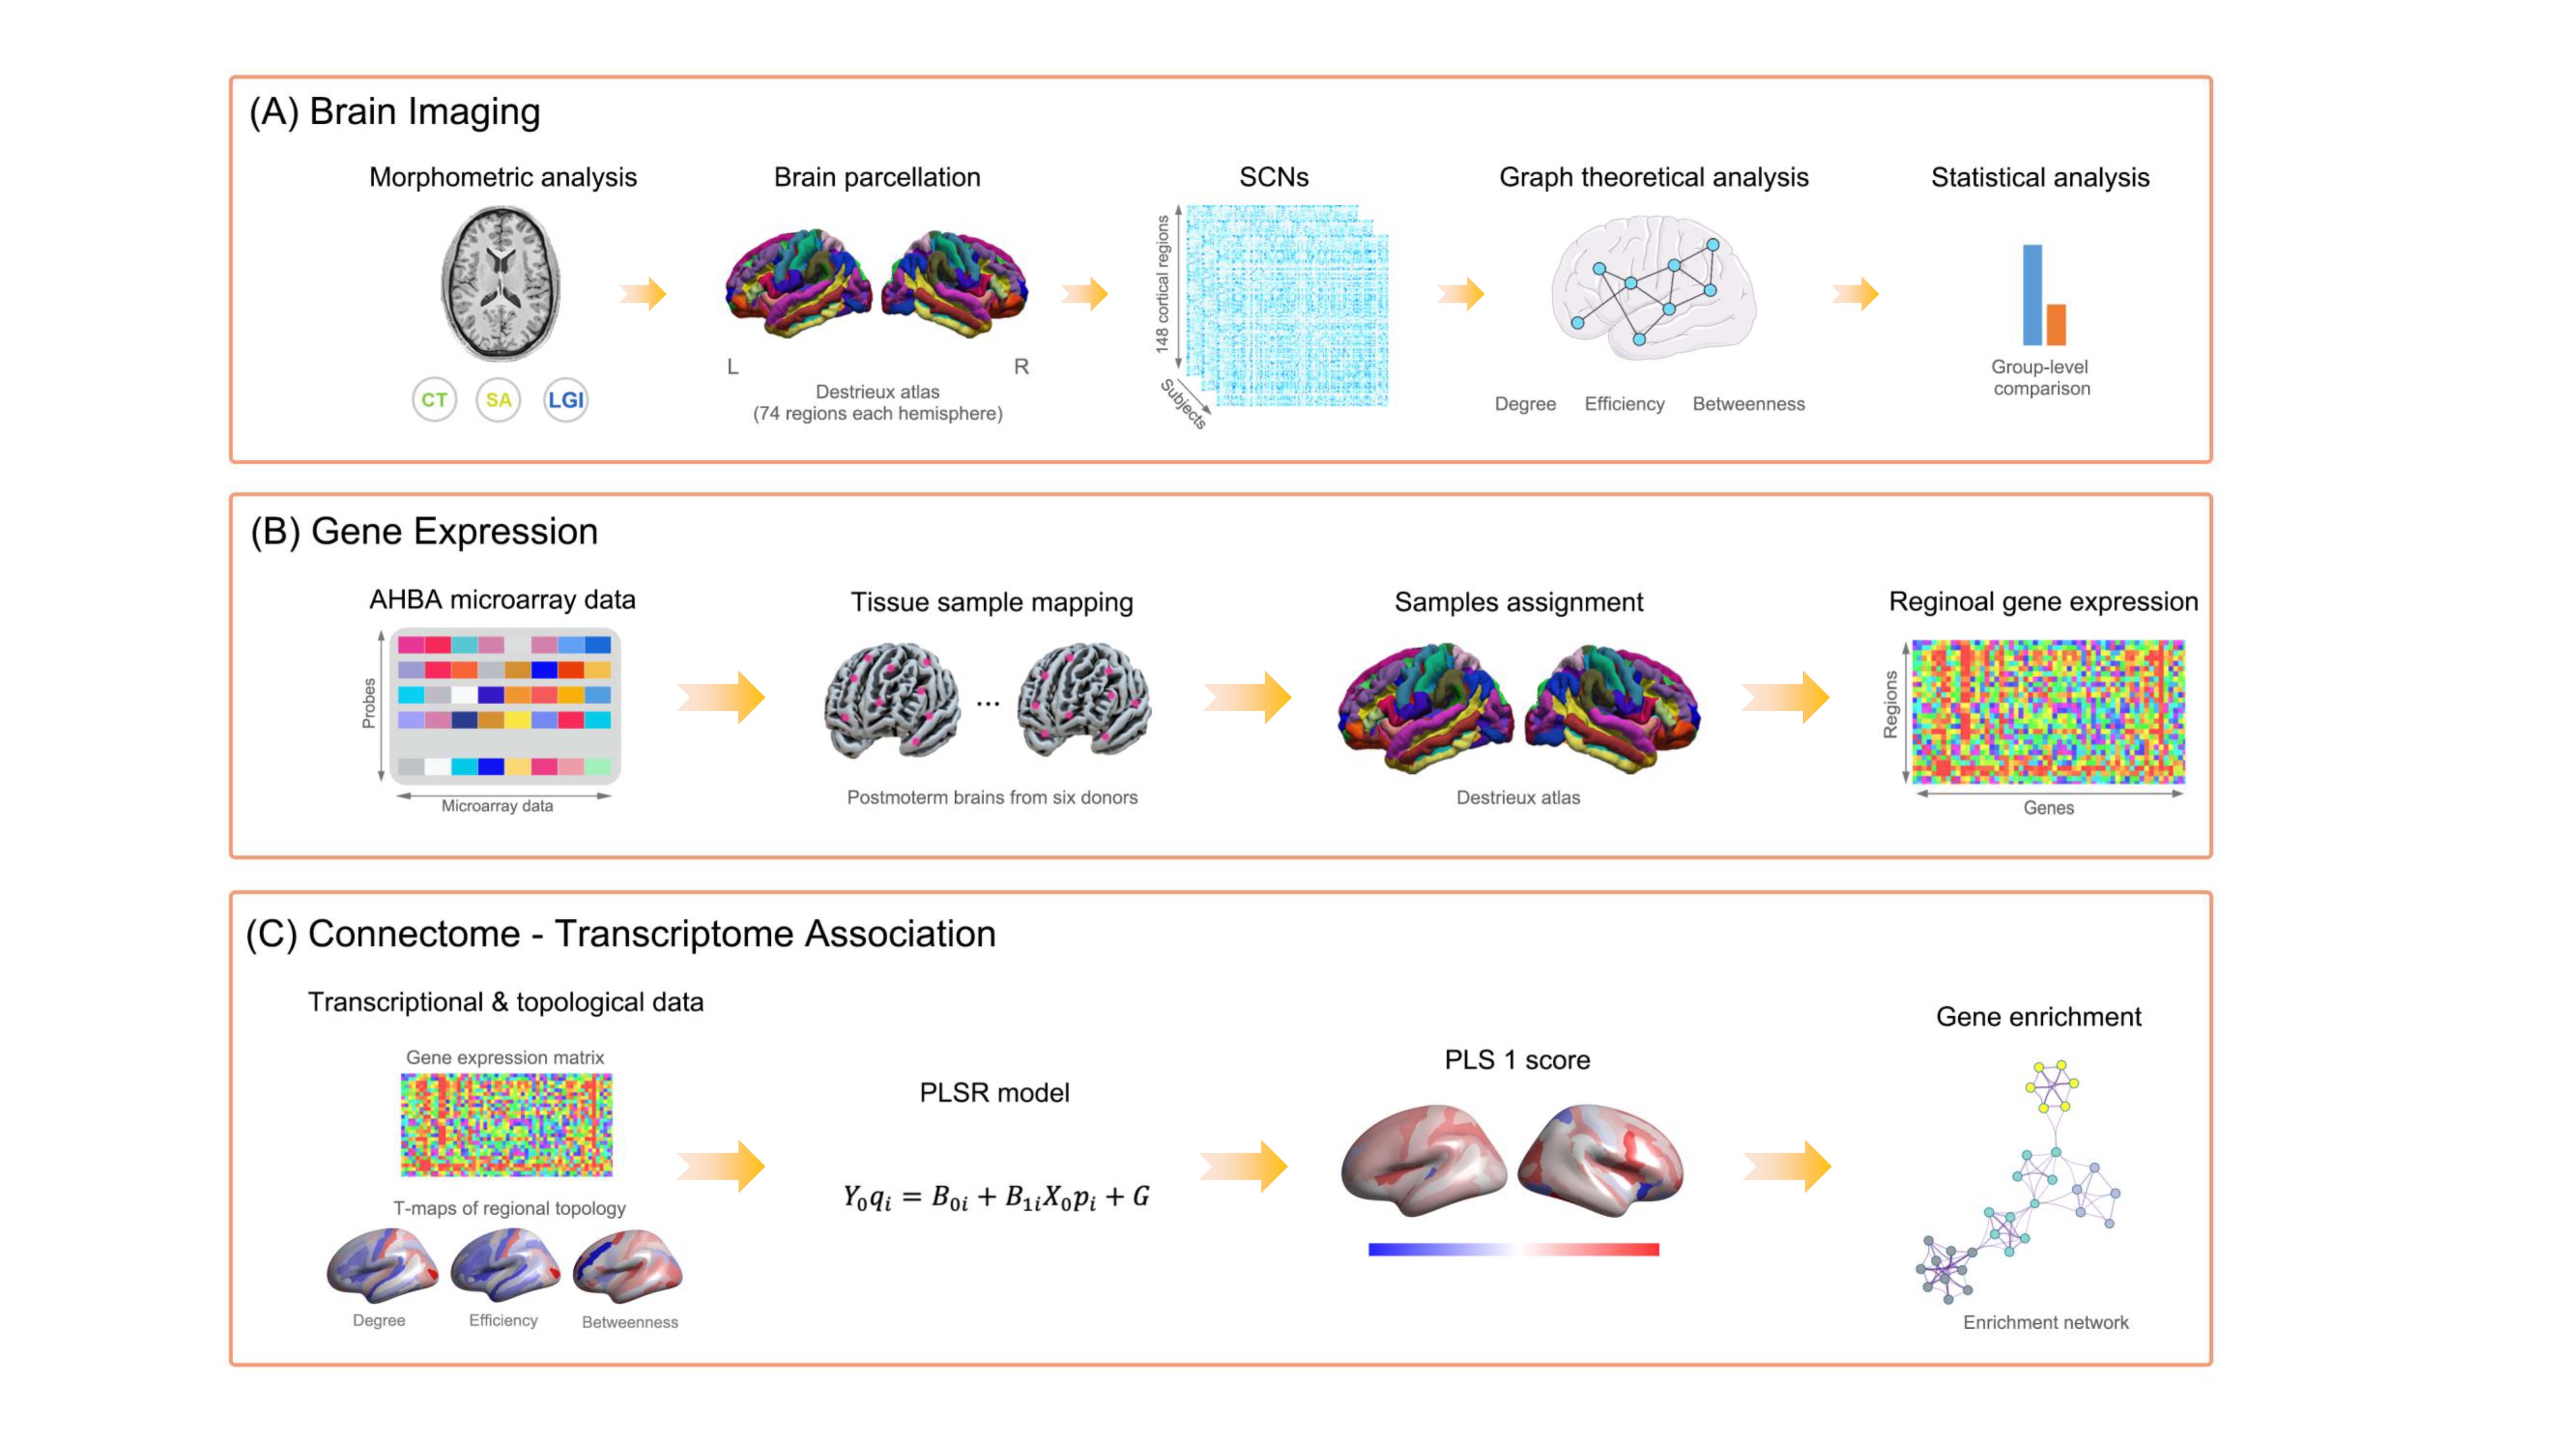
Fig. 1 Overview of the analysis pipeline.
Abbreviations: CT, cortical thickness; SA, surface area; LGI, local gyrification index; SCN, structural covariance network; PLSR, partial least square regression.
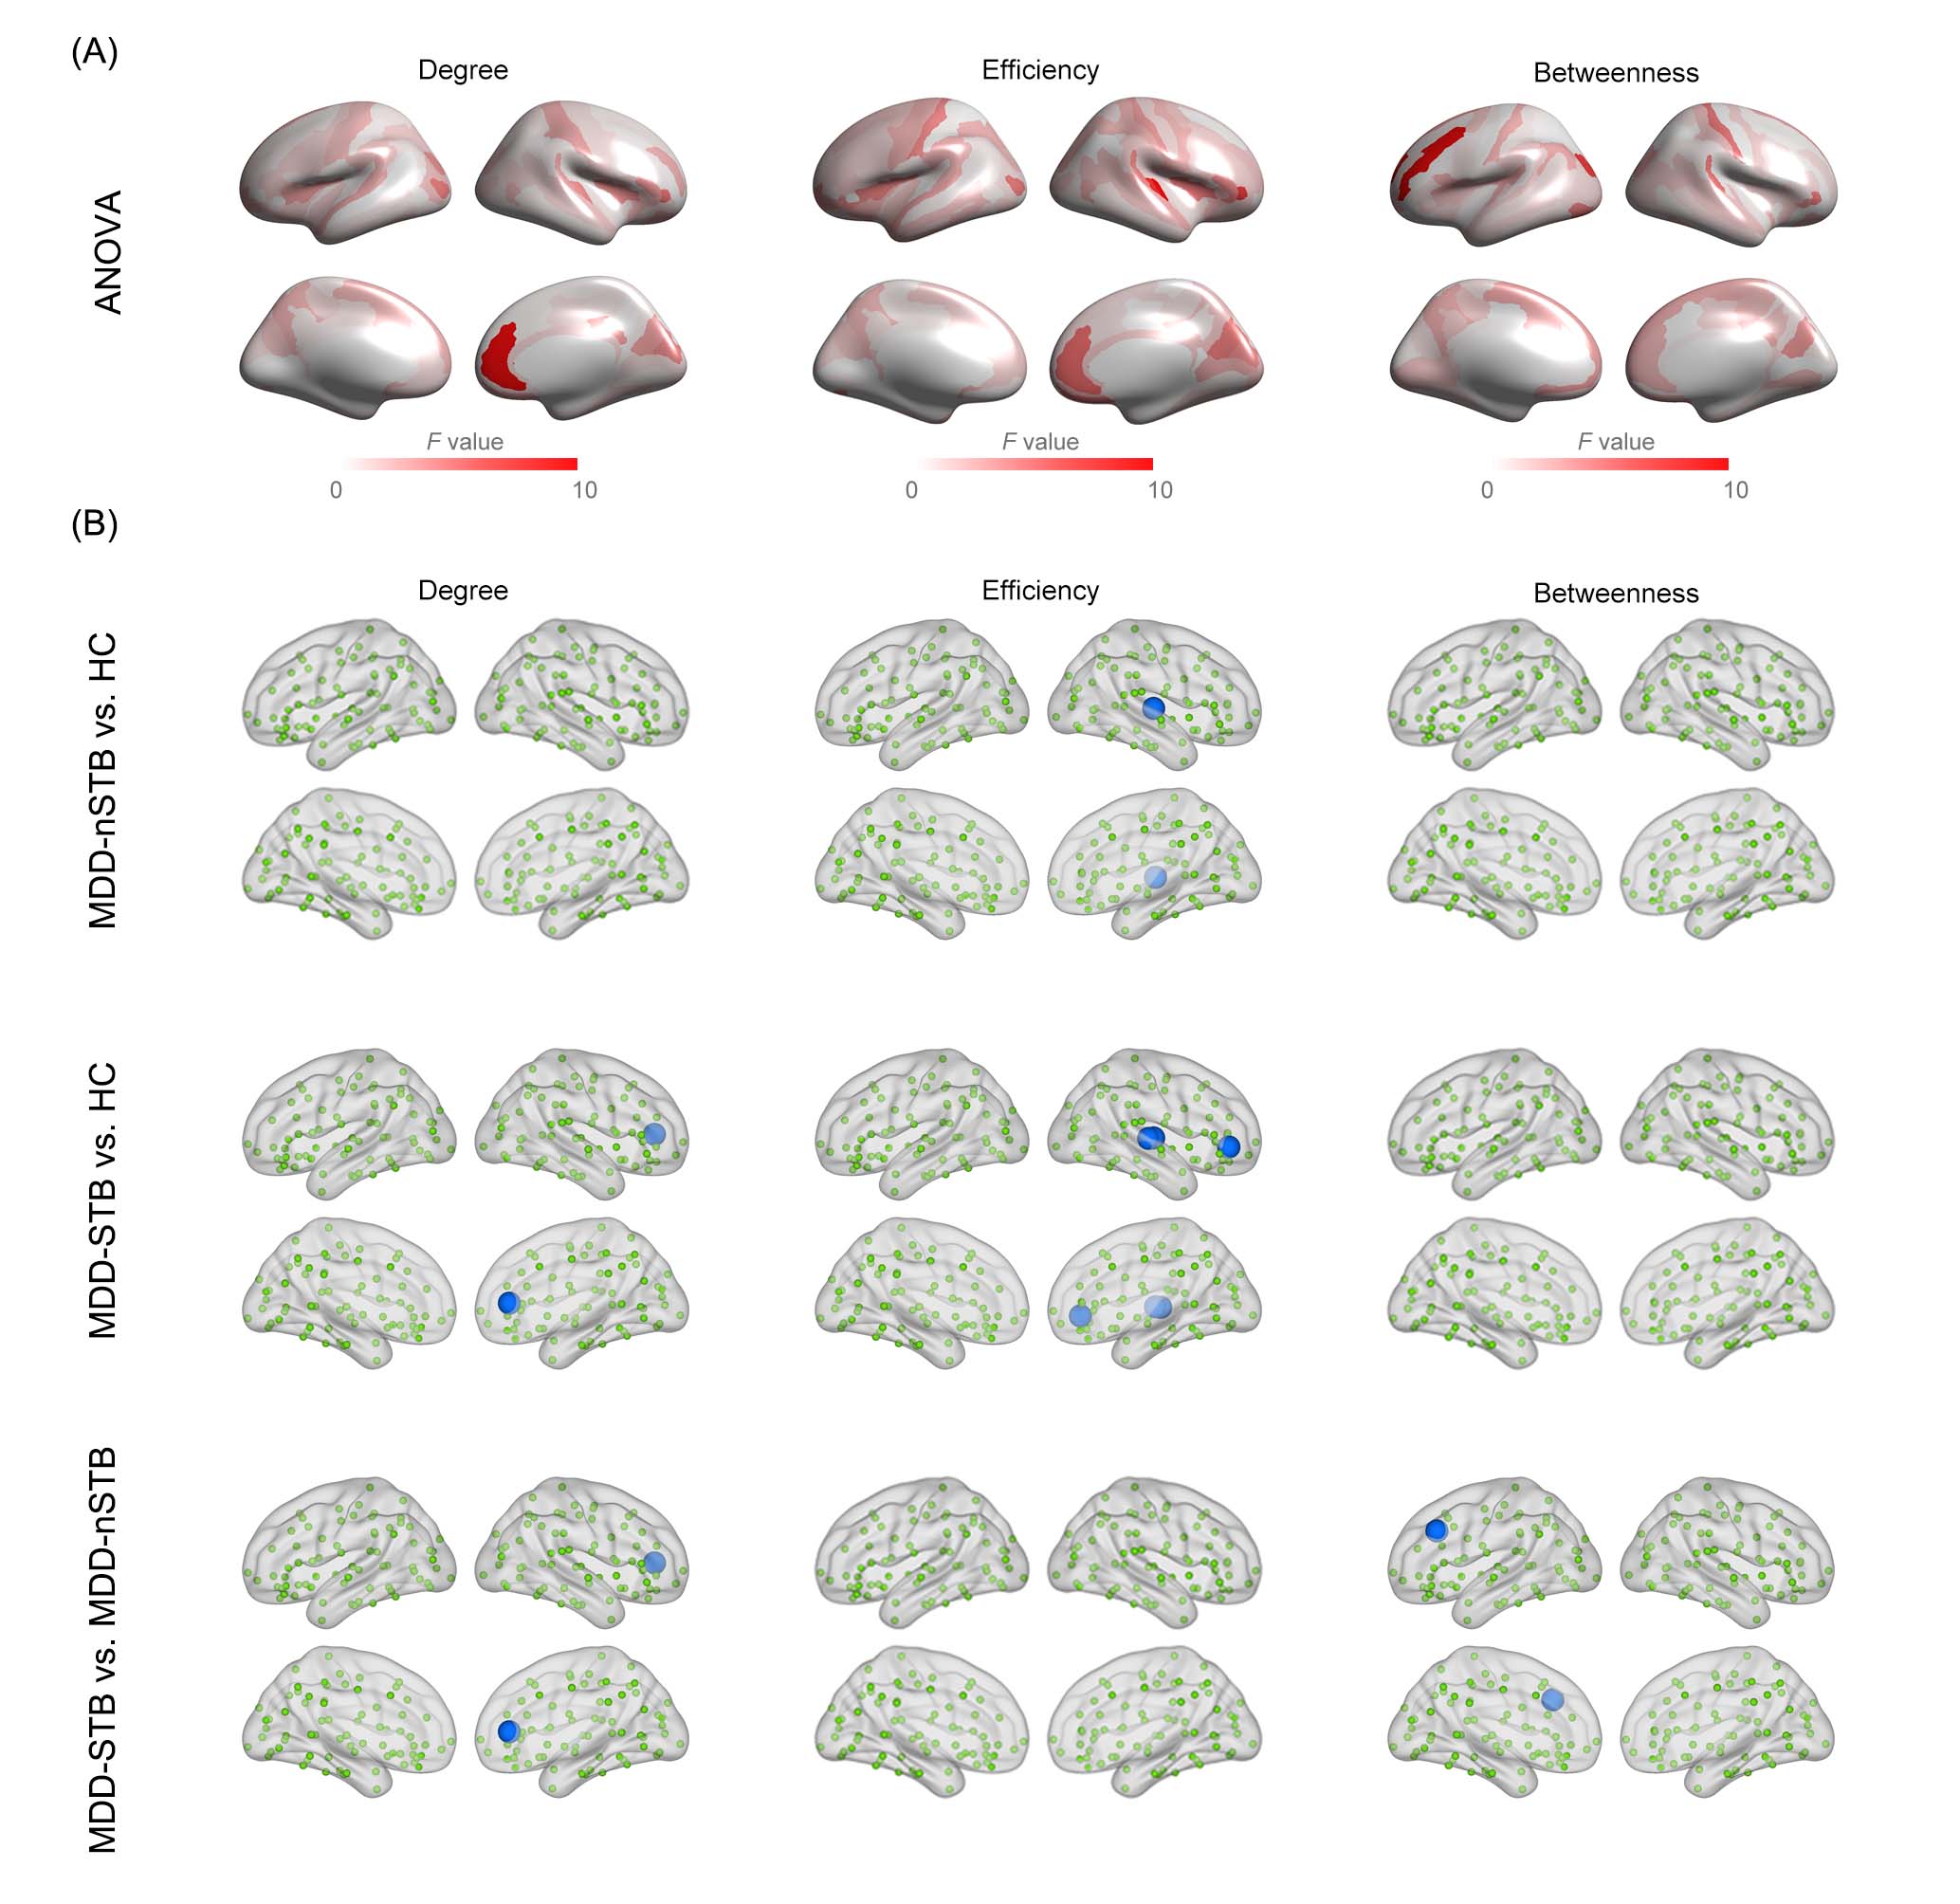
Fig. 2 Network topological differences across MDD-STB, MDD-nSTB and HC.
(A) F-maps of ANOVA analysis of topological metrics. (B) Regions showing significant topological differences in the posthoc pairwise comparisons. Nonsignificant regions are shown in green. Blue spheres denote significant decreases (i.e., MDD-nSTB < HC; MDD-STB < HC; MDD-STB < MDD-nSTB), and red spheres denote significant increases (i.e., MDD-nSTB > HC; MDD-STB > HC; MDD-STB > MDD-nSTB).
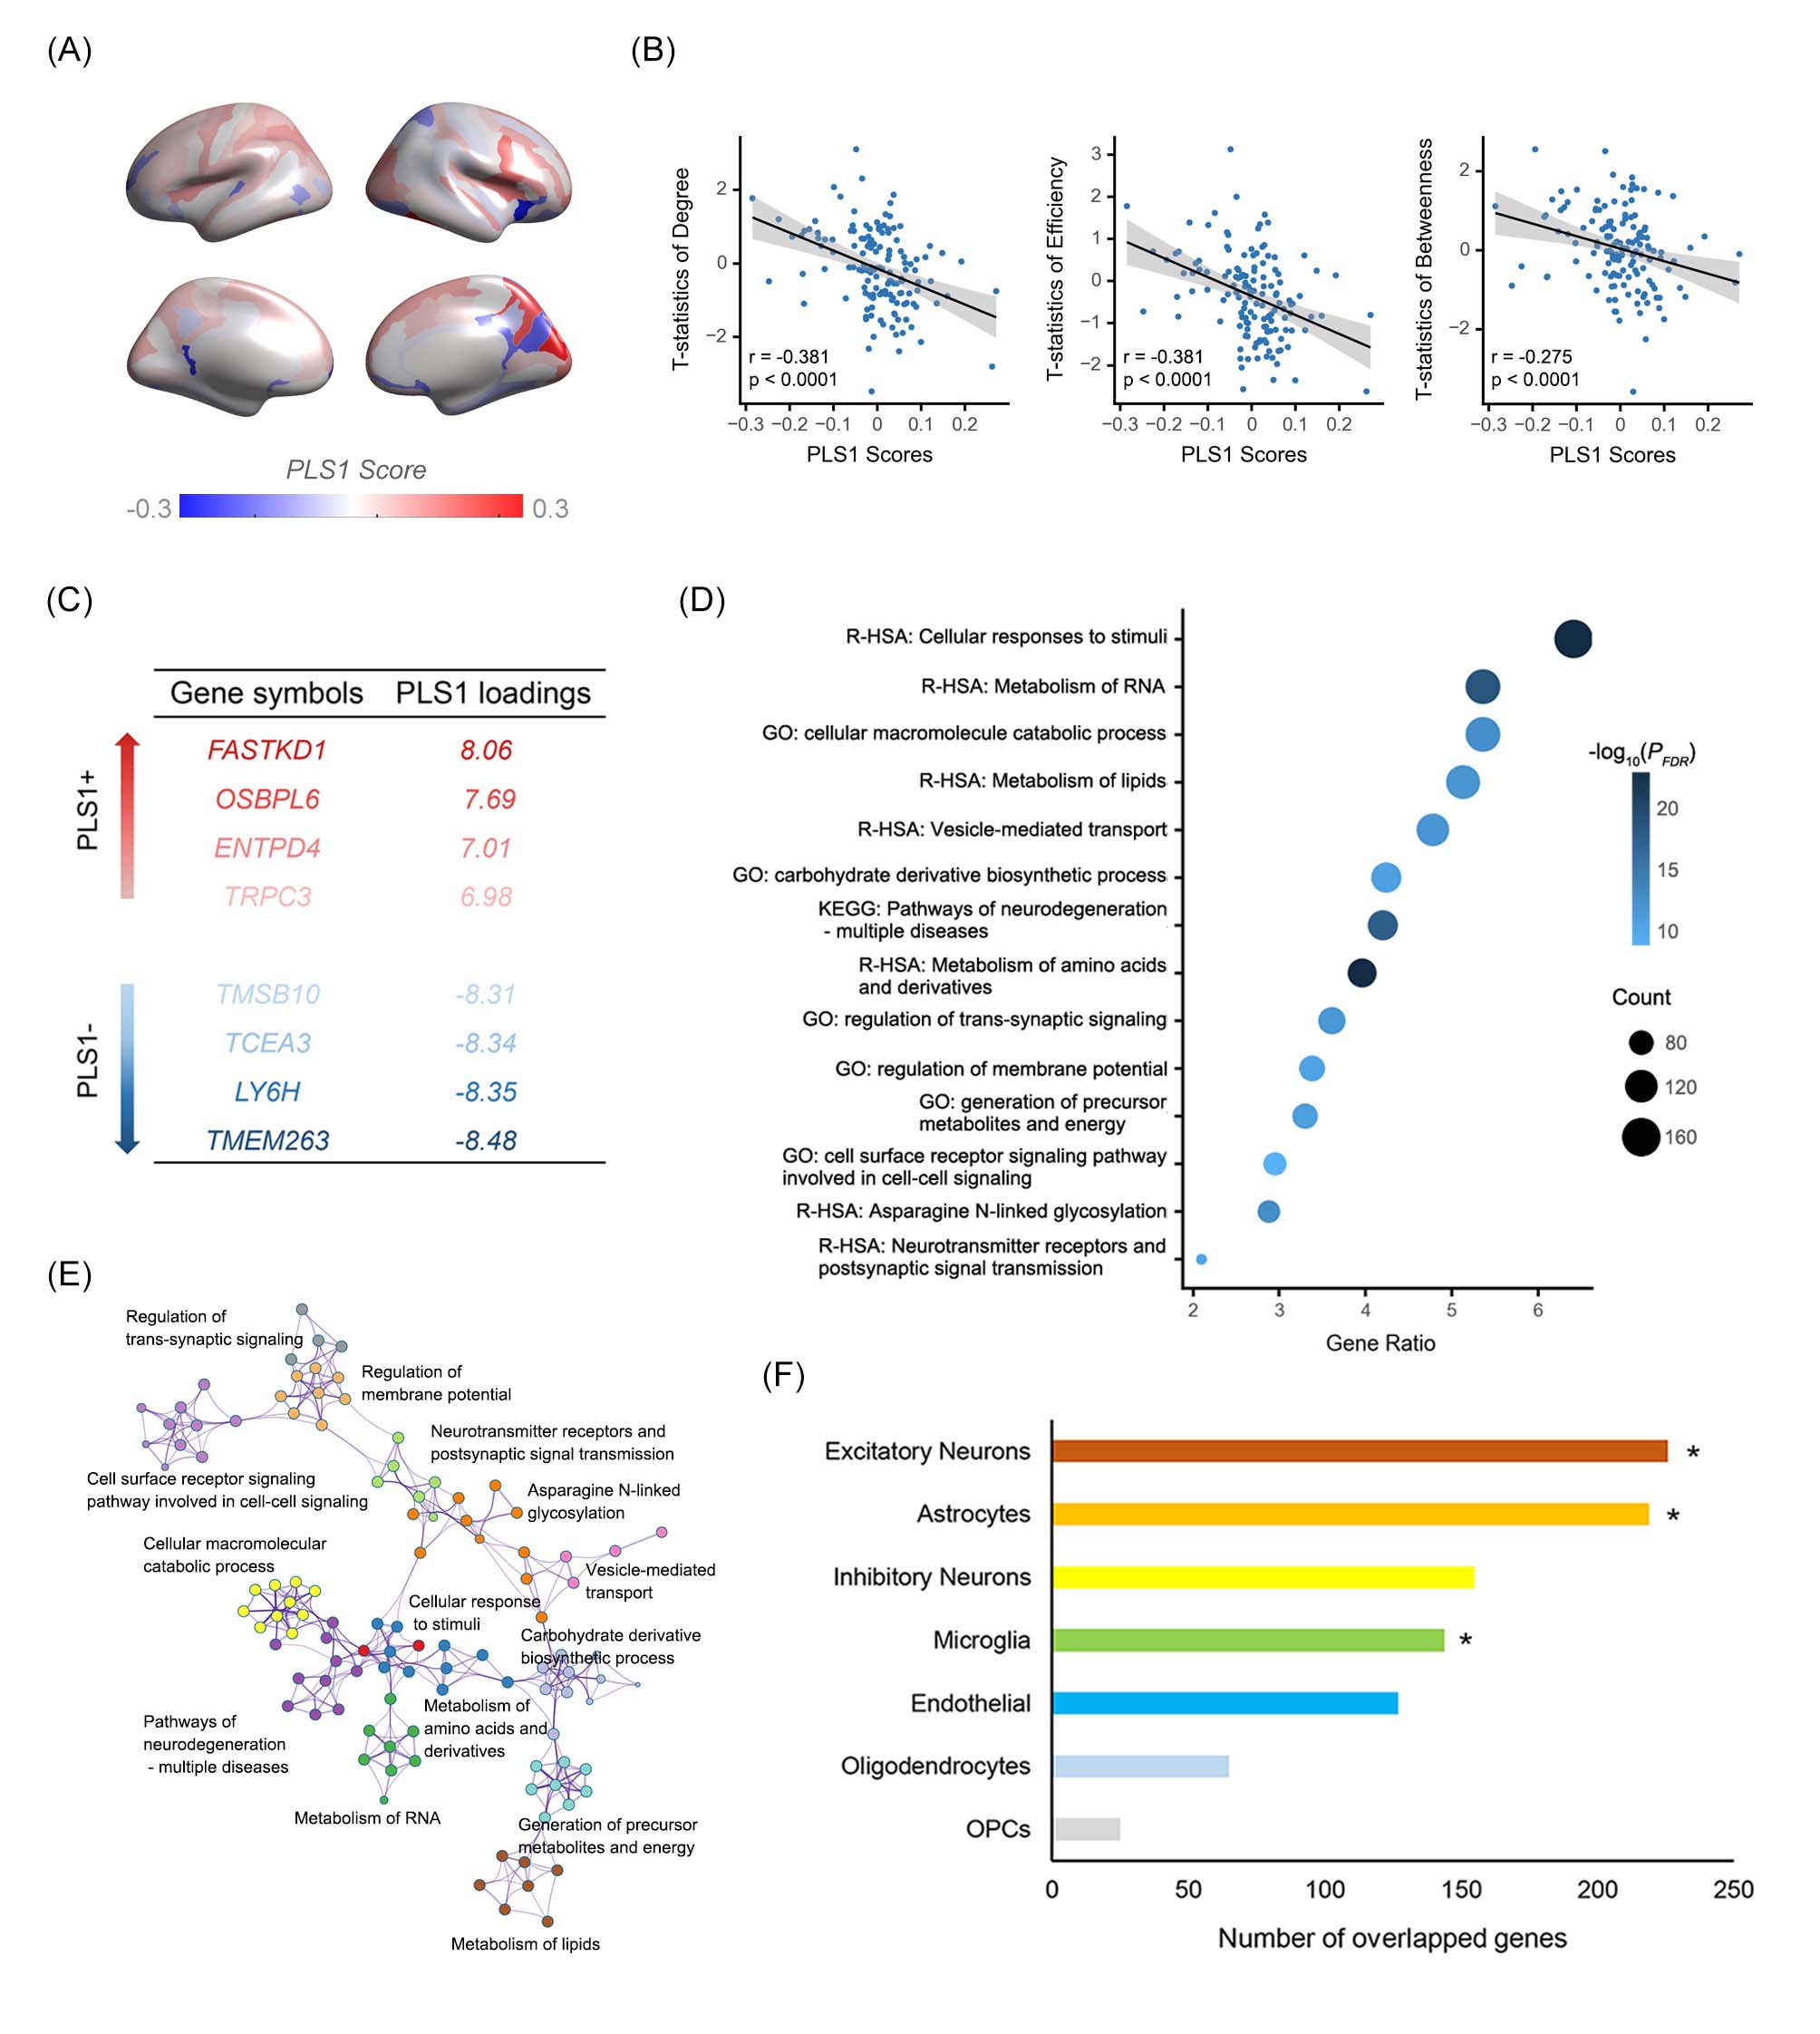
Fig. 3 Transcriptional profiles associated with STB-related network alterations.
(A) Brain map of the PLS1 scores. (B) Correlation between PLS1 score and connectomic changes. (C) List for the PLS1+ and PLS1- genes. (D) Enrichment terms for the PLS1- genes. (E) Enrichment network showing the intra- and inter-cluster similarities of enriched annotations. (F) The number of significant weighted PLS1- genes overlapped with gene sets for each cell type.