1241
Disrupted brain functional connectome gradient in social anxiety disorder1Huaxi MR Research Center (HMRRC), West China Hospital of Sichuan University, Chengdu, China
Synopsis
Keywords: Functional Connectivity, fMRI (resting state), biomarker
Motivation: Although discrete macroscale functional network abnormalities were observed in social anxiety disorder (SAD), the alterations of continuous spatial patterns of functional connectomes remain unknown.
Goal(s): We aimed to use a novel method to characterize aberrant patterns of connectome gradients in SAD patients.
Approach: We applied diffusion map embedding to characterize functional connectome gradients and investigated between-group differences of global and regional topological features and their clinical relevance.
Results: Globally, SAD patients demonstrated decreased explanation ratio, narrower gradient range and less spatial variation in the principal gradient. Regionally, SAD group showed increased gradients in the sensorimotor networks and decreased in the default mode network.
Impact: Our findings of internally clinically-relevant disrupted hierarchy patterns of functional connectomes could add further insights into the neurobiological underpinnings of SAD, and may advance the development of objective biomarkers for early diagnosis, targeted intervention, and therapeutic efficacy evaluation in SAD.
INTRODUCTION
Although increasing studies have been conducted to identify discrete macroscale functional network abnormalities in social anxiety disorder (SAD), it may be short of robust sensitivity to subtle changes1, and the alterations of the continuous spatial patterns of functional connectivity among regions remain unknown. To bridge this gap, a novel gradient-based approach for brain connectome was introduced to characterize the functional hierarchies in virtue of a set of low-dimensional gradients to represent the high-dimensional functional connectome, which can detect more gradual alterations in connectome patterns and characterize spatial features of inter-regional activity along a continuous spectrum2. Nevertheless, there is no study to investigate whether/how the functional connectome gradient is disrupted in SAD. Considering this, the current study aimed to adopt this promising method to characterize aberrant patterns of principal connectome gradients in a relatively large homogenous sample of SAD patients, and assess their potential clinical relevance.METHODS
Subjects and image acquisition. This study was approved by the local Medical Research Ethics Committee. Based on the power analysis (Cohen's d = 0.5, α = 0.05, 1-β = 0.8 for an independent-sample t-test)3, 49 non-comorbid SAD patients (aged 24.6±5.3 years; 19 female) and 53 demography-matched healthy controls (HC) (aged 23.4±3.3 years; 22 female) were recruited to undergo resting-state functional magnetic resonance imaging (rs-fMRI) using a gradient echo-planar imaging sequence on a 3.0-Tesla MR scanner (Siemens Trio, Erlangen, Germany) with a 12-channel head coil.Functional connectome gradient mapping. Firstly, the preprocessed rs-fMRI images (using a standard pipeline of the toolbox for Data Processing & Analysis of Brain Imaging4) were resampled to 4-mm isotropic resolution, and individual functional connectomes were constructed at the voxel level (18933 voxels)5. Then, the top 10% connections of each voxel were retained and cosine similarity among each pair of voxels was calculated to generate similarity matrix, which was further scaled into a normalized angle matrix to avoid negative values6. Lastly, by applying diffusion map embedding7, a nonlinear dimensionality reduction technique, the similarity matrix was further decomposed into gradient components explaining the variance in the connectivity patterns, which were further aligned across all subjects via iterative Procrustes rotation7.
Functional gradient patterns characterization. Considering the greatest explained variance of principal primary-to-transmodal gradient and its close relations to the neuronal microstructure and cognitive function8, we mainly focused on principal gradient. At the global level, three gradient metrics (explanation ratio, range and variation) were respectively compared between SAD and HC using nonparametric permutation tests (10000 iterations) with age, sex and head motion as covariates. At the regional level, voxel-wise gradients were compared using independent-sample t-test after controlling for age, sex and head motion, in which the Gaussian random field theory was performed to control for multiple comparisons with a significance threshold of a voxel-wise P < 0.001 and cluster-wise P < 0.05 9.
RESULTS
In general, the principal gradient explained 11.83 ± 2.18% of the total connectomes variance (SAD, 11.17 ± 2.10%; HC, 12.42 ± 2.09%; Figure 1), which was organized along a gradual axis from the primary sensorimotor/visual networks (SMN/VN) to the default mode network (DMN; Figure 2). Compared to HC, SAD showed global topographic abnormalities including decreased explanation ratio, narrower gradient range and less spatial variation in the principal gradient (Figure 3&4). Regionally, SAD patients demonstrated increased gradient scores mainly in SMN and VN, and decreased gradients in DMN (Figure 5). Furtherly, some aberrant gradient signatures correlated with symptom severity and illness duration, suggesting pathophysiological relevance.DISCUSSION
Globally, decreased explanation ratio, narrower gradient range and less spatial variation in SAD indicated less explained variance in the functional connectome and less differentiated connectivity patterns between the primary and transmodal areas5. This disrupted connectome hierarchy could result in aberrant information encoding and integration from sensation to cognition, which may underlie hypervigilance toward threateningly-social stimuli, disrupted perceptual analysis of sensory events and dysfunctional cognitive control in SAD10.Regionally, gradient abnormalities in DMN may underline the functional cognitive models of disturbed self-evaluative and self-referential processes11, while aberrant gradients in SMN and VN may be related to perceptual impairments and compromised social information processing such as gaze avoidance12, and abnormal facial emotion processing in SAD13.
CONCLUSION
Our study extended earlier SAD neuroimaging studies by identifying internally clinically-relevant disrupted patterns of principal gradient across functional connectomes in SAD, which may reflect imbalance of hierarchy bottom-up response and top-down regulation in cognitive, emotional and sensory domains. These results provide functional insights into the neurobiological underpinnings of SAD, and may advance the development of objective biomarkers for early diagnosis, targeted intervention, and therapeutic efficacy evaluation in SAD.Acknowledgements
The authors would like to express their sincere appreciation to supervisor and colleagues for valuable advice. We also thank all the participants in this study. This study was supported by the National Key R&D Program of China (Grant Nos. 2022YFC2009900) and the National Natural Science Foundation of China (Grant Nos. 81621003, 81761128023, 81820108018, and 82027808). The funding sources had no involvement in the study design, data collection and analysis, results interpretation, or writing of the paper.
References
[1] Mizzi S, Pedersen M, Lorenzetti V, et al. Resting-state neuroimaging in social anxiety disorder: a systematic review. Mol Psychiatry. 2022;27:164-179.
[2] Huntenburg JM, Bazin PL, Margulies DS. Large-scale gradients in human cortical organization. Trends Cogn Sci. 2018;22:21-31.
[3] Faul F, Erdfelder E, Lang AG, et al. G*Power 3: a flexible statistical power analysis program for the social, behavioral, and biomedical sciences. Behavior research methods. 2007;39:175-191.
[4] Chao-Gan Y, Yu-Feng Z. DPARSF: A MATLAB Toolbox for "Pipeline" Data Analysis of Resting-State fMRI. Front Syst Neurosci. 2010;4:13.
[5] Xia M, Liu J, Mechelli A, et al. Connectome gradient dysfunction in major depression and its association with gene expression profiles and treatment outcomes. Mol Psychiatry. 2022;27:1384-1393.
[6] Paquola C, Vos De Wael R, Wagstyl K, et al. Microstructural and functional gradients are increasingly dissociated in transmodal cortices. PLoS Bio. 2019;17:e3000284.
[7] Hong SJ, Vos de Wael R, Bethlehem RAI, et al. Atypical functional connectome hierarchy in autism. Nat Commun. 2019;10:1022.
[8] Margulies DS, Ghosh SS, Goulas A, et al. Situating the default-mode network along a principal gradient of macroscale cortical organization. Proc Natl Acad Sci USA. 2016;113:12574-12579.
[9] Friston KJ, Worsley KJ, Frackowiak RS, et al. Assessing the significance of focal activations using their spatial extent. Hum Brain Mapp. 1994;1:210-220.
[10] Miskovic V, Schmidt LA. Social fearfulness in the human brain. Neurosci Biobehav Rev. 2012;36:459-478.
[11] Cremers HR, Roelofs K. Social anxiety disorder: a critical overview of neurocognitive research. Wires Cogn Sci. 2016;7:218-232.
[12] Weeks JW, Howell AN, Goldin PR. Gaze avoidance in social anxiety disorder. Depress Anxiety. 2013;30:749-756.
[13] Machado-de-Sousa JP, Arrais KC, Alves NT, et al. Facial affect processing in social anxiety: tasks and stimuli. J Neurosci Methods. 2010;193:1-6.
Figures
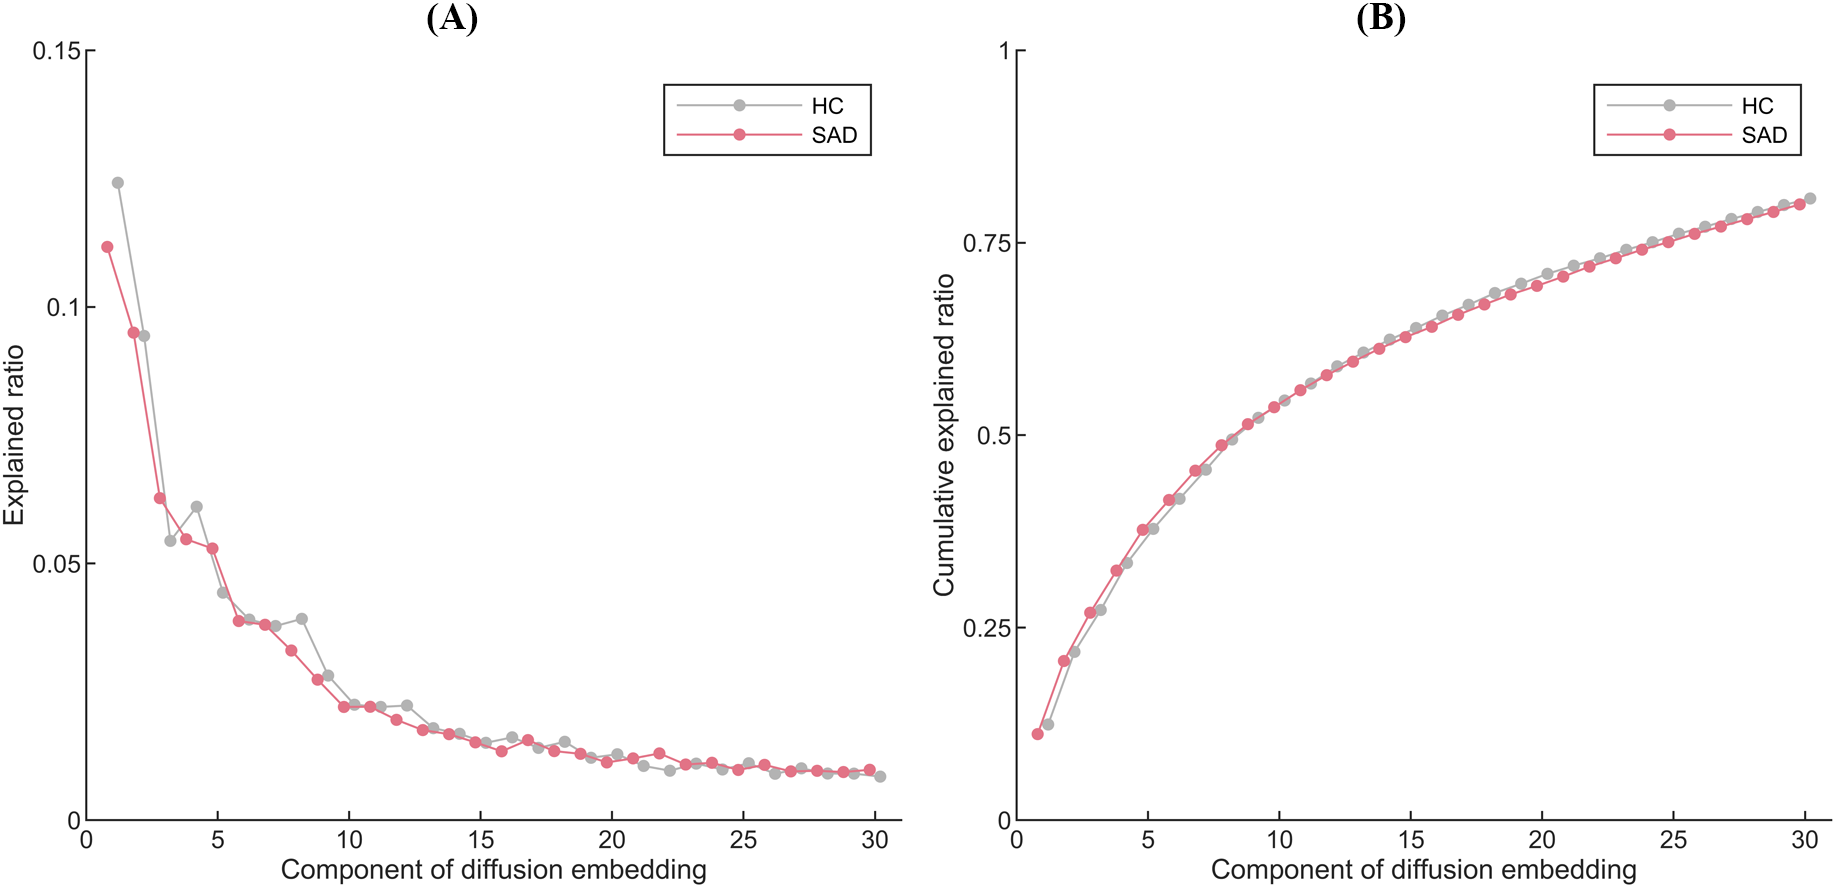
Figure 1. The averaged explained ratio (A) and the cumulative averaged explained ratio (B) of the first 30 diffusion embedding components in the SAD and HC groups. The SAD group is shown in red, while the HC group is gray. Abbreviations: HC, healthy controls; SAD, social anxiety disorder.
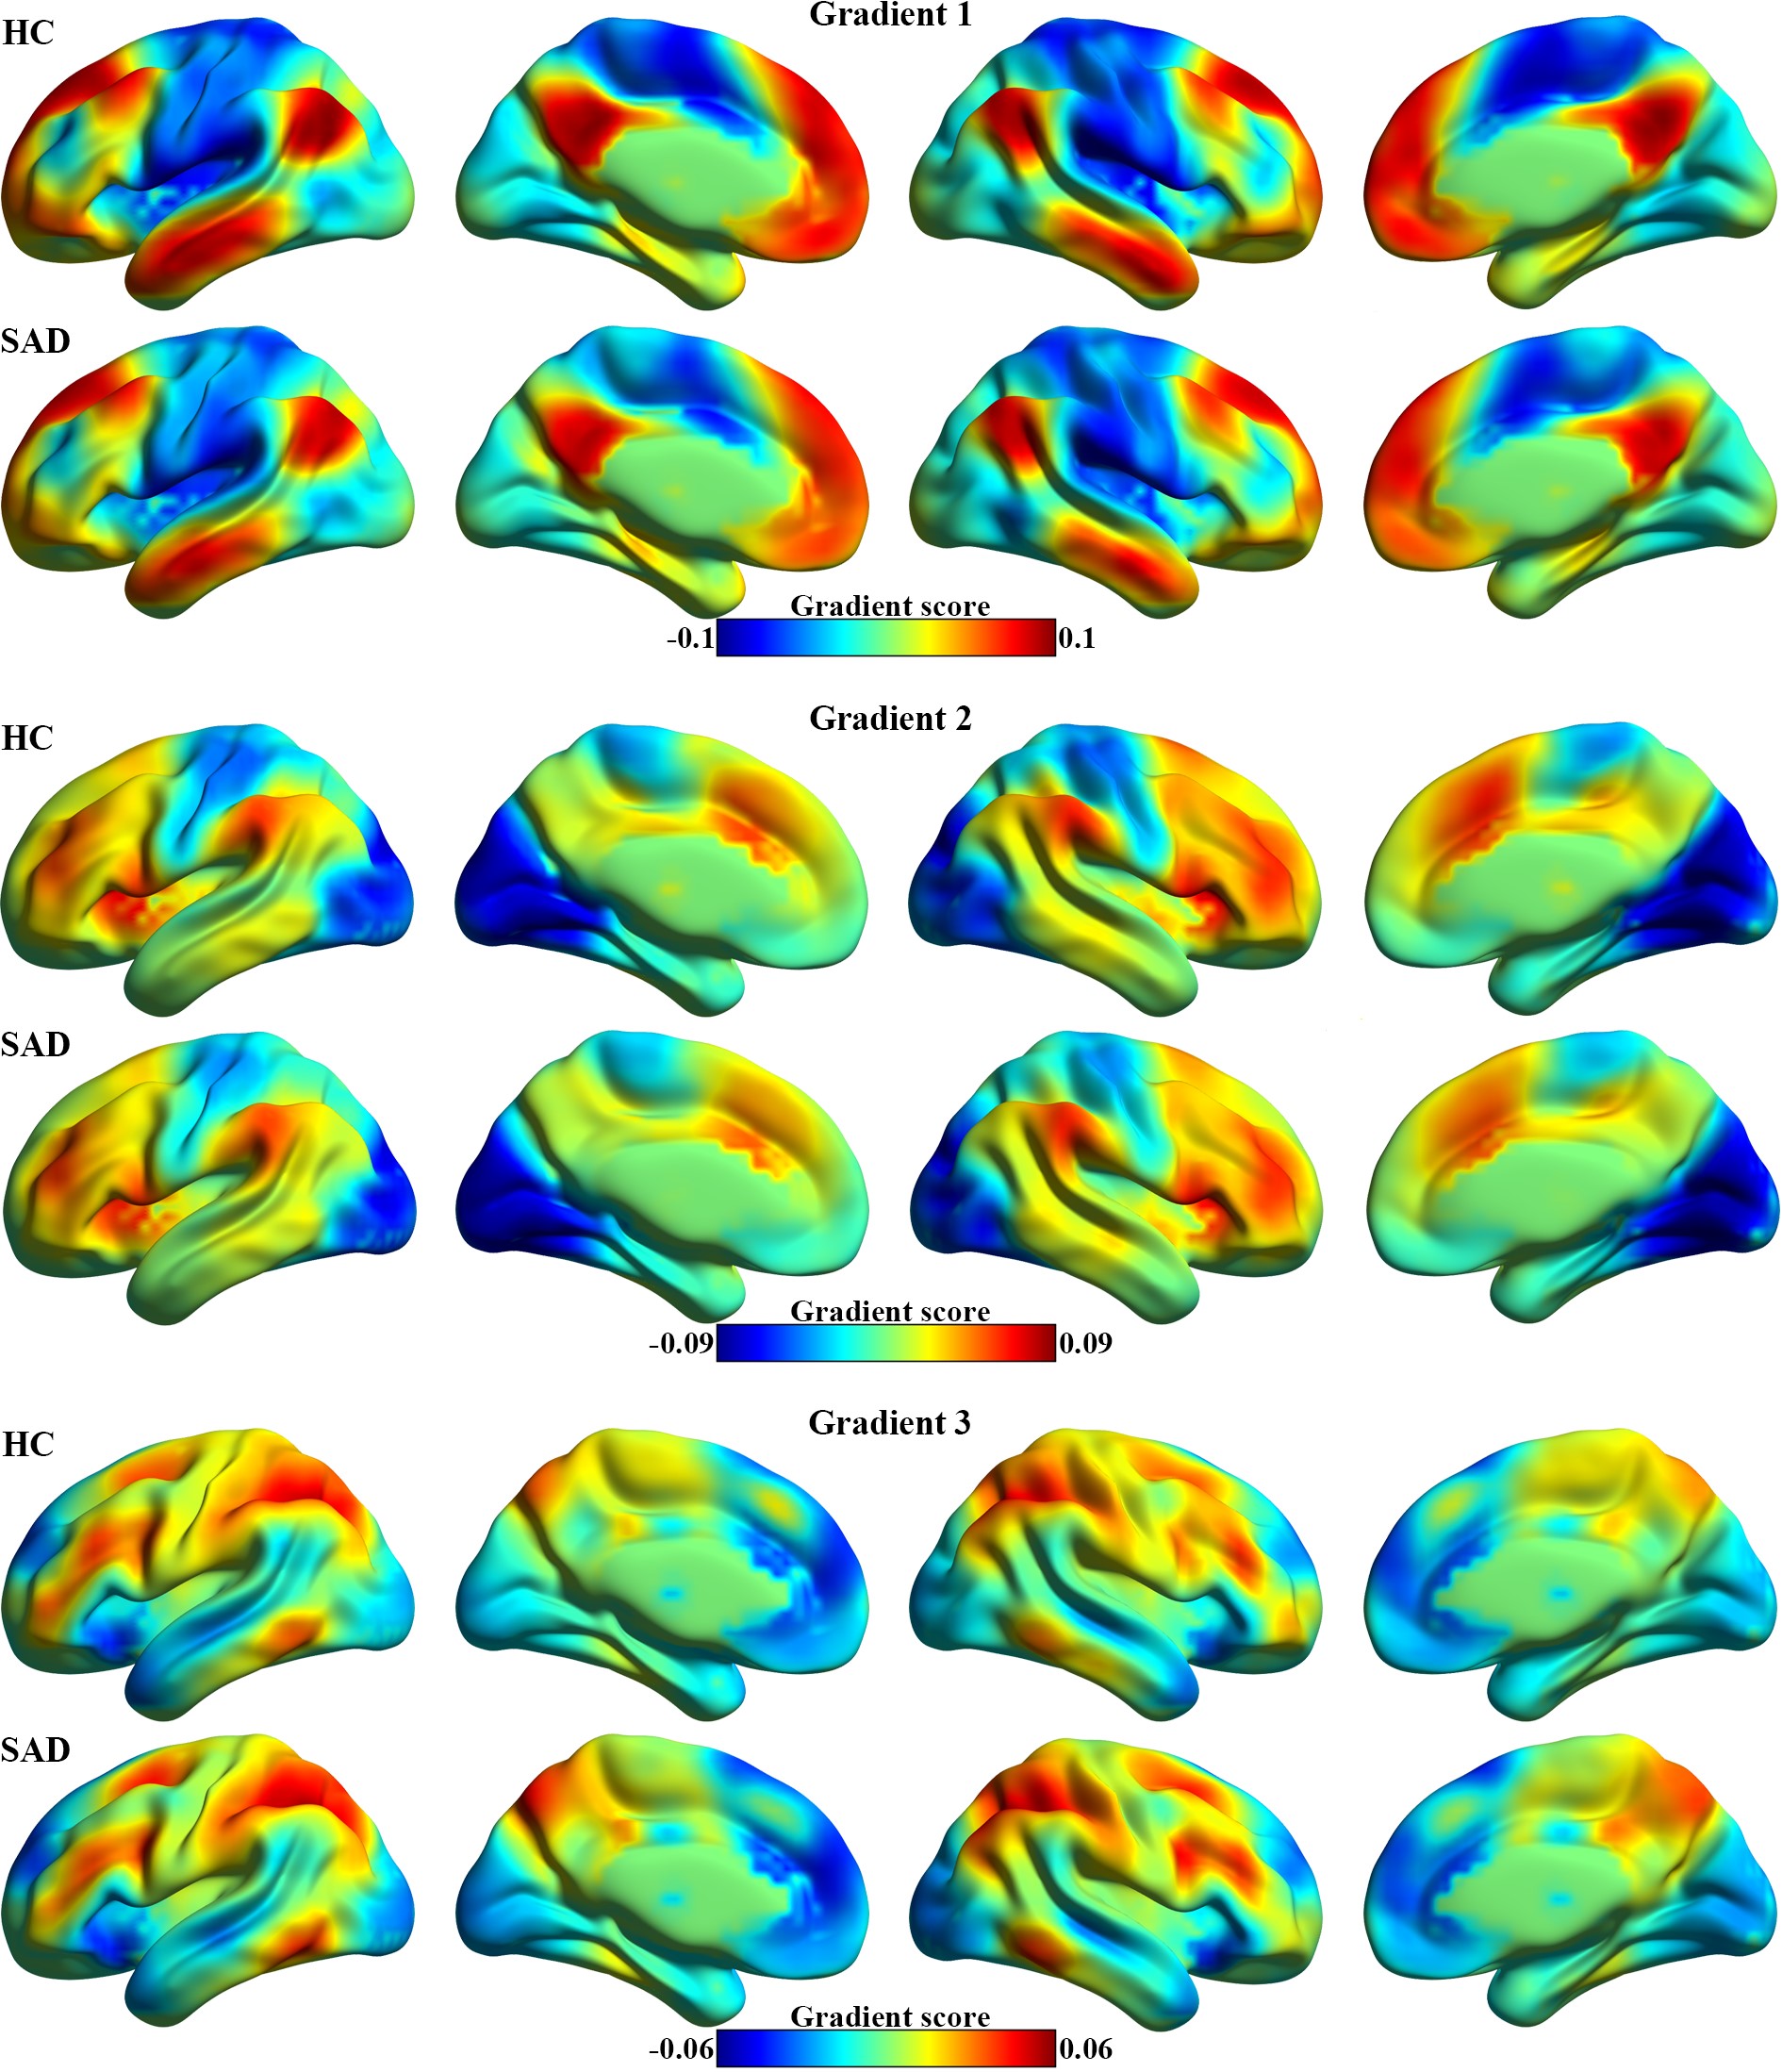
Figure 2. The first three connectome gradients mapping in the SAD and HC groups. Abbreviations: HC, healthy controls; SAD, social anxiety disorder.
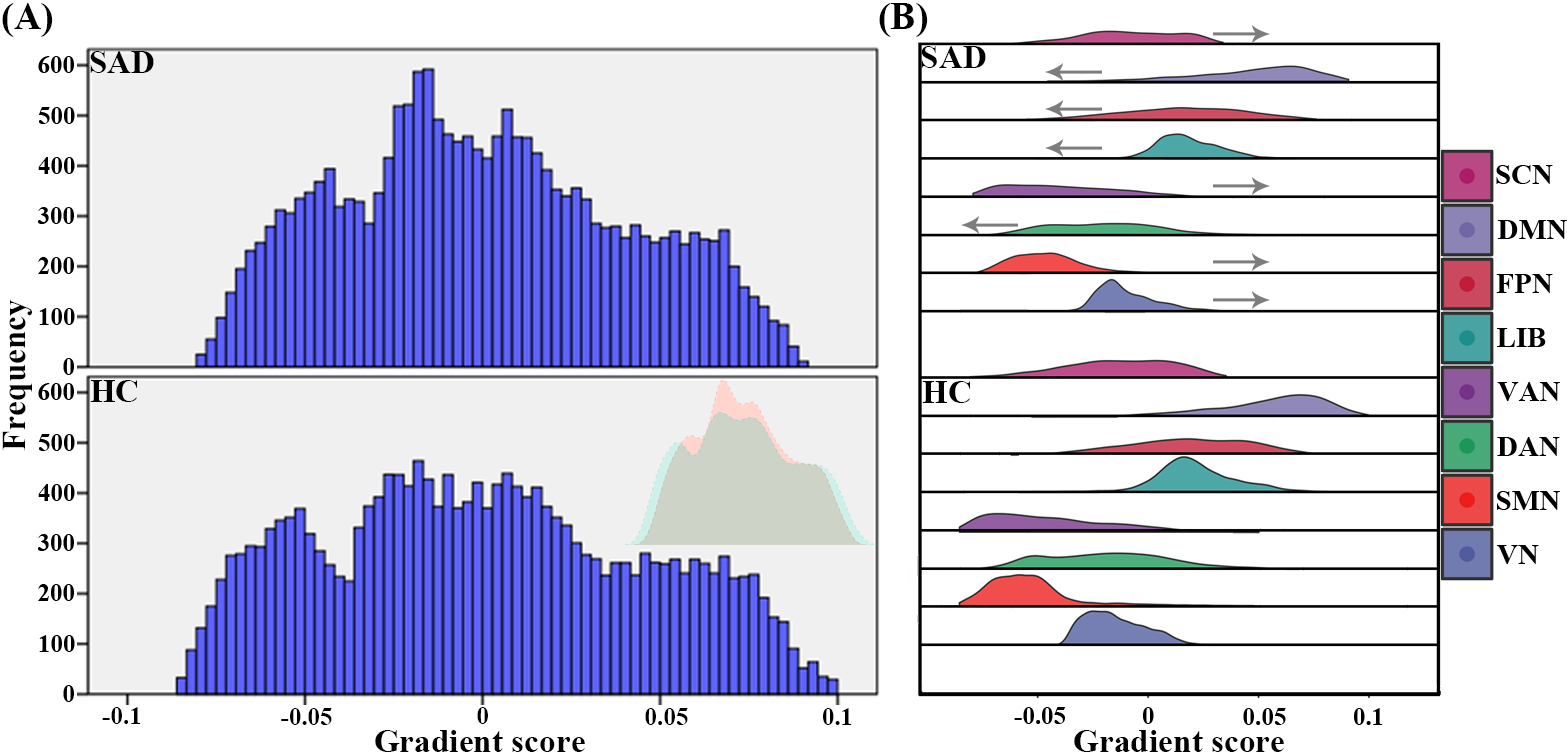
Figure 3. The global (A) and the system-based (B) histograms of the principal gradient in the SAD and HC groups. (A) Extreme values were contracted in the SAD group compared to HC. Arrows in (B) indicate the alteration direction of system-based gradient in SAD patients relative to HC. Abbreviations: DAN, dorsal attention network; DMN, default mode network; FPN, frontoparietal network; HC, healthy controls; LIB, limbic network; SAD, social anxiety disorder; SCN, subcortical network; SMN, sensorimotor network; VAN, ventral attention network; VN, visual network.
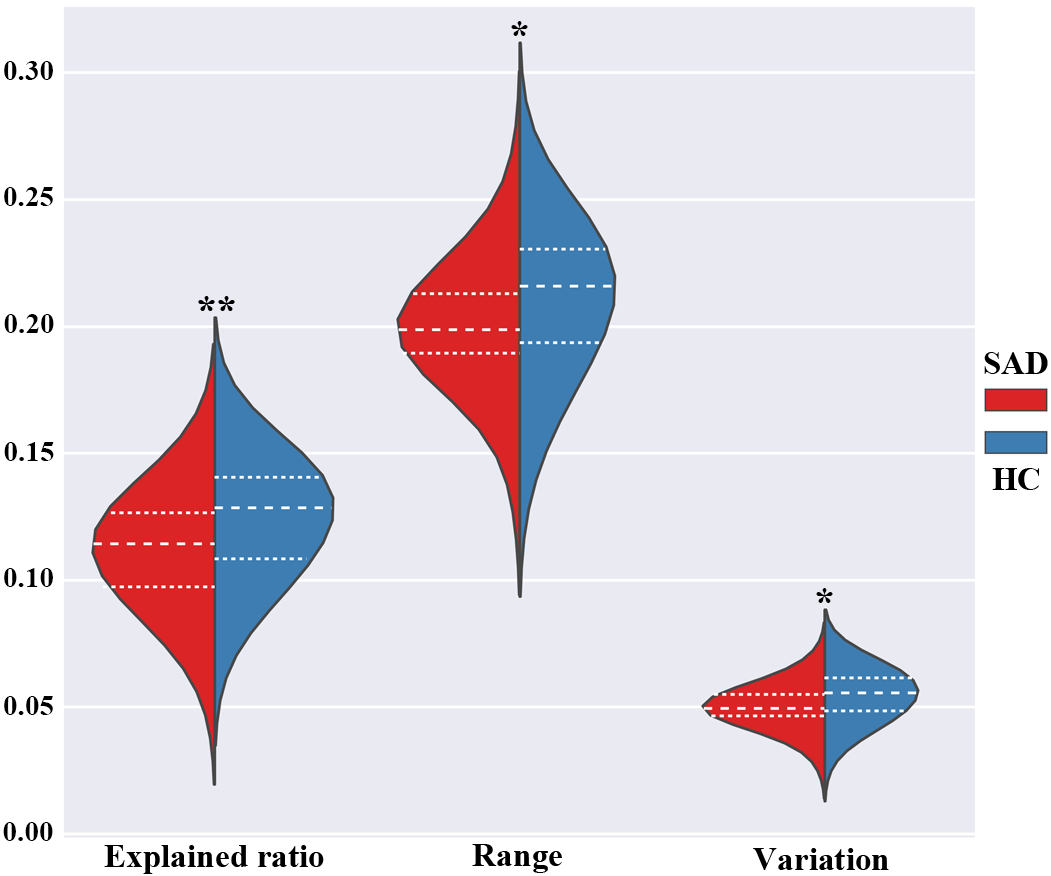
Figure 4. Between-group differences of global metrics of the principal gradient between SAD patients and HC. The SAD group is shown in red, while the HC group is blue. * P < 0.05, ** P < 0.01. Abbreviations: HC, healthy controls; SAD, social anxiety disorder.
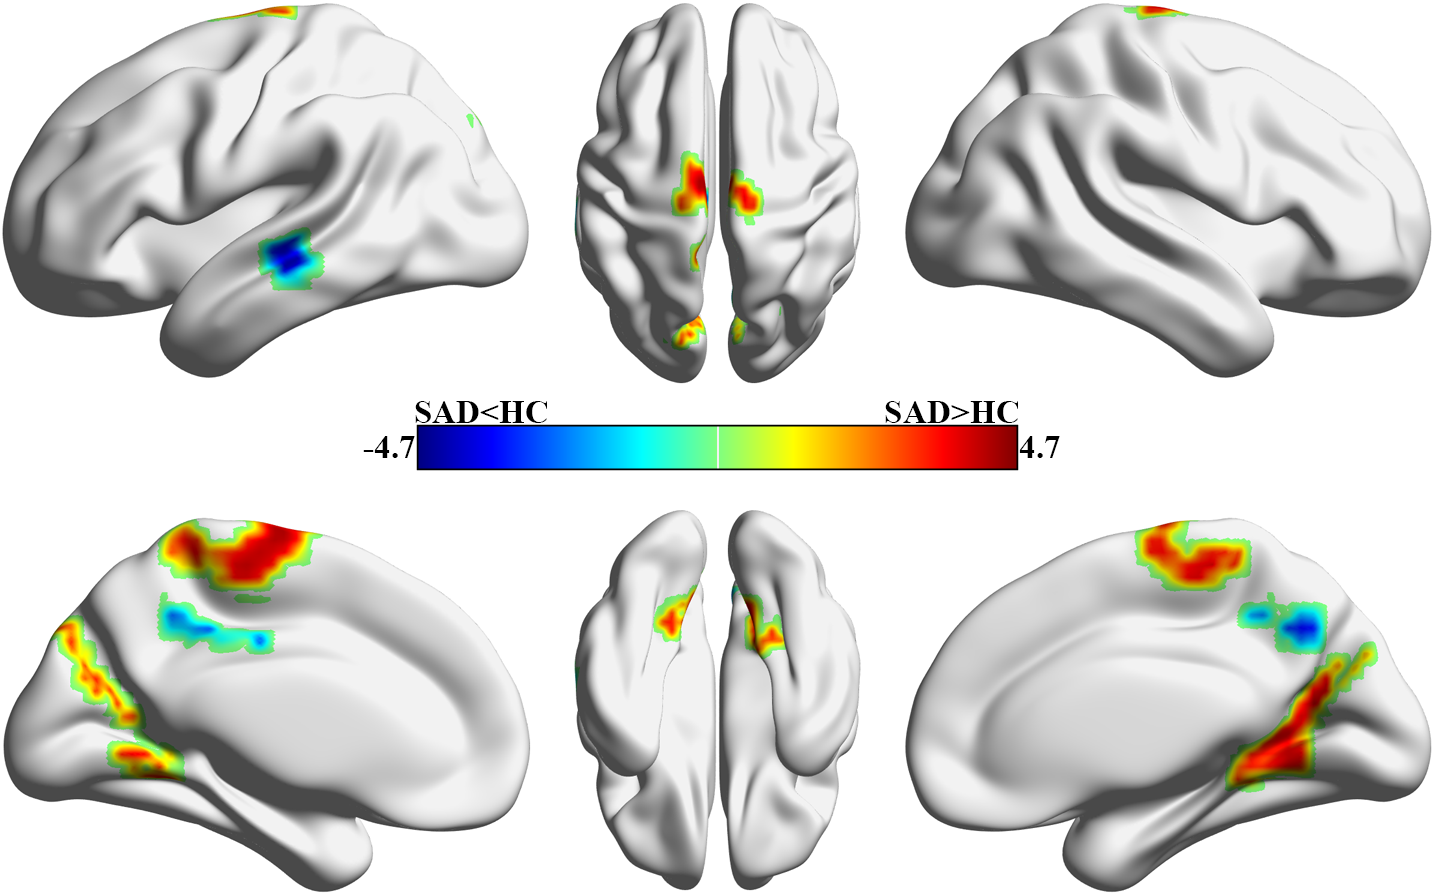
Figure 5. Between-group differences of voxel-wise principal gradient between SAD patients and HC. Warm colours (positive values) represent increased gradient scores, cool colours (negative values) decreased gradient scores in SAD patients compared to HC. Abbreviations: HC, healthy controls; SAD, social anxiety disorder.