1236
Prediction of Low Quality ADC Maps from T2 Scans1Molecular Imaging Branch, NCI/NIH, Bethesda, MD, United States
Synopsis
Keywords: Analysis/Processing, Prostate, Quality Control, DWI, ADC, Preduiction
Motivation: ADC maps are an essential tool for early prostate cancer detection but are often uninterpretable due to imaging artifacts
Goal(s): Detect problems early in the imaging procedure using T2 images to predict the future quality of the ADC map
Approach: Constructed a multisite corpus of 486 patients imaged at both the NIH and outside. Investigated the influence of acquisition parameters on image quality and the predictive power of neural networks and simple anatomy measurements from the T2 image
Results: ADC image quality can be predicted from the T2 image using either a neural network approach or measurement of the rectal cross-section
Impact: The probability of a low quality, uninterpretable ADC maps can be inferred early in the imaging process, allowing corrective action (e.g. removal of gas by a muscle relaxant) to be employed
Introduction
Active surveillance of prostate cancer typically employs multi-parametric MRI, using various MRI imaging modalities (T2, DWI, and DCE) to assess prostate anatomy and function. The key challenge lies in scan quality, as radiologists are often absent during image capture, leading to potential post-visit issues or worse, the missed progression of cancer. A 2023 multicenter European study revealed that low-quality images were over three times more likely to be upgraded to a higher-grade, more dangerous status after biopsy.(1) 40% of images fell into the low-quality category, indicating a significant number of potentially harmful lesions may go undetected by mpMRI due to image quality issues.(1) Within mpMRI, the ADC maps from diffusion weighted imaging (DWI) have been valuable in identifying potentially dangerous lesions. However, the EPI sequence used in DWI is susceptible to magnetic susceptibility distortion. Previous work has shown that ADC maps can be correctly classified as high or low quality by neural net methods.(2) However, this requires that the ADC map must be acquired. Given that acquiring the ADC map is the most time-consuming step of mpMRI and occurs late in the imaging procedure, an interventional method capable of predicting the quality of the ADC map before DWI acquisition occurs would have obvious benefits.Methods
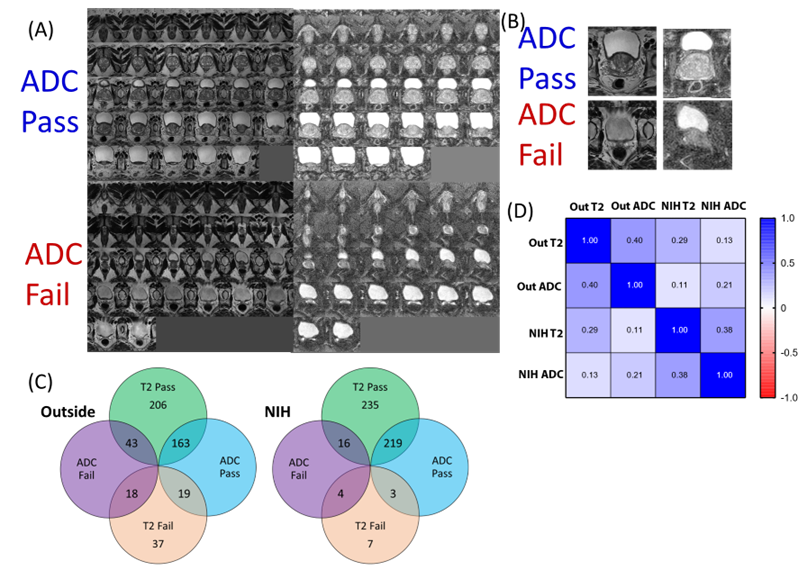
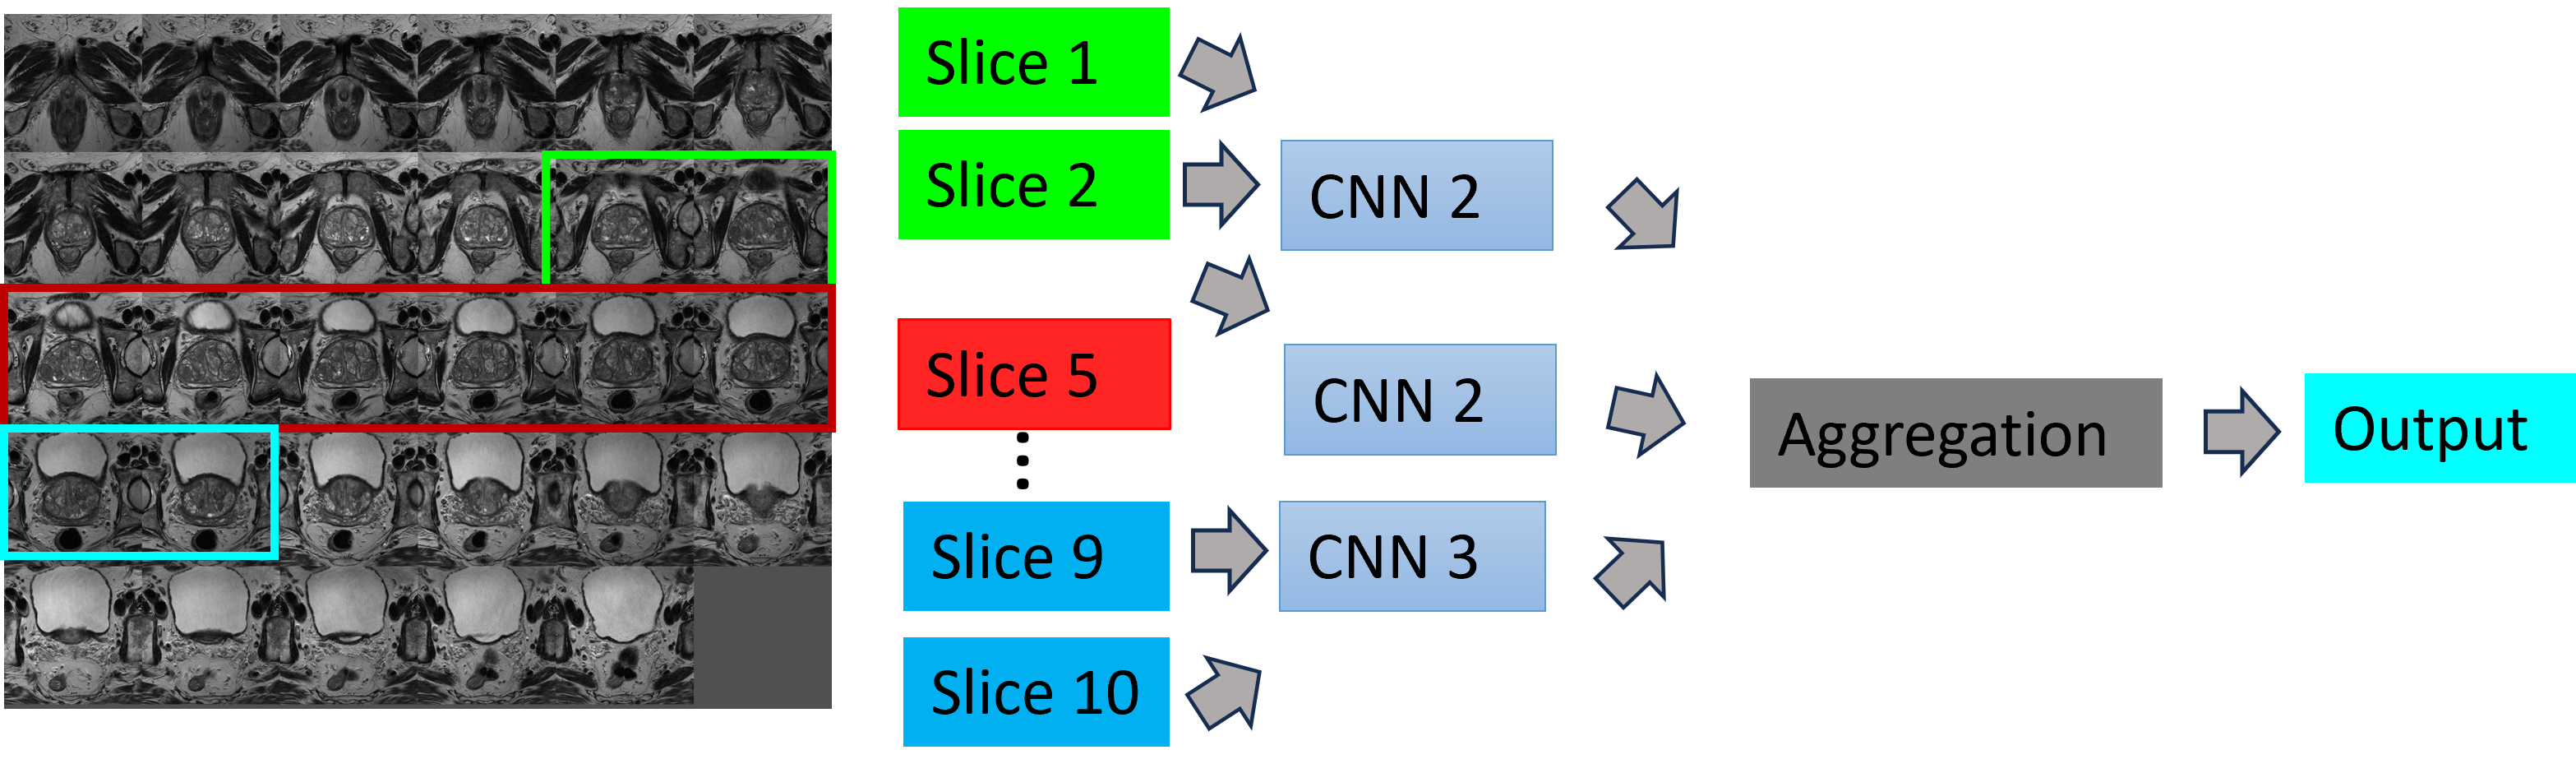
A multi-site training corpus of mpMRI images was constructed from 486 patients imaged first at one of 62 different institutions before being subsequently referred to our facility for imaging and evaluation by an expert radiologist, Dr. Turkbey, who rated the images as satisfactory or unsatisfactory (see figure 1A for an example). This unique paired dataset encompasses a wide array of imaging procedures, scanning hardware, and pulse sequences, providing a comprehensive reflection of the clinical imaging landscape. 25% of ADC maps from outside institutions were rated as unsatisfactory, compared to 8% at the NIH (Figure 1C). To construct our predictive model, we employed an artificial neural network based on the VGG13-BN architecture. Three neural networks were constructed, each taking as input three images centered on different regions in proximity to the prostate region (bladder, prostate, and rectum see Fig 3) The final prediction was generated through a majority vote function based on the values of each neural network.Relationship Between Acquisition Parameters, T2 Image Quality, and ADC Image Quality
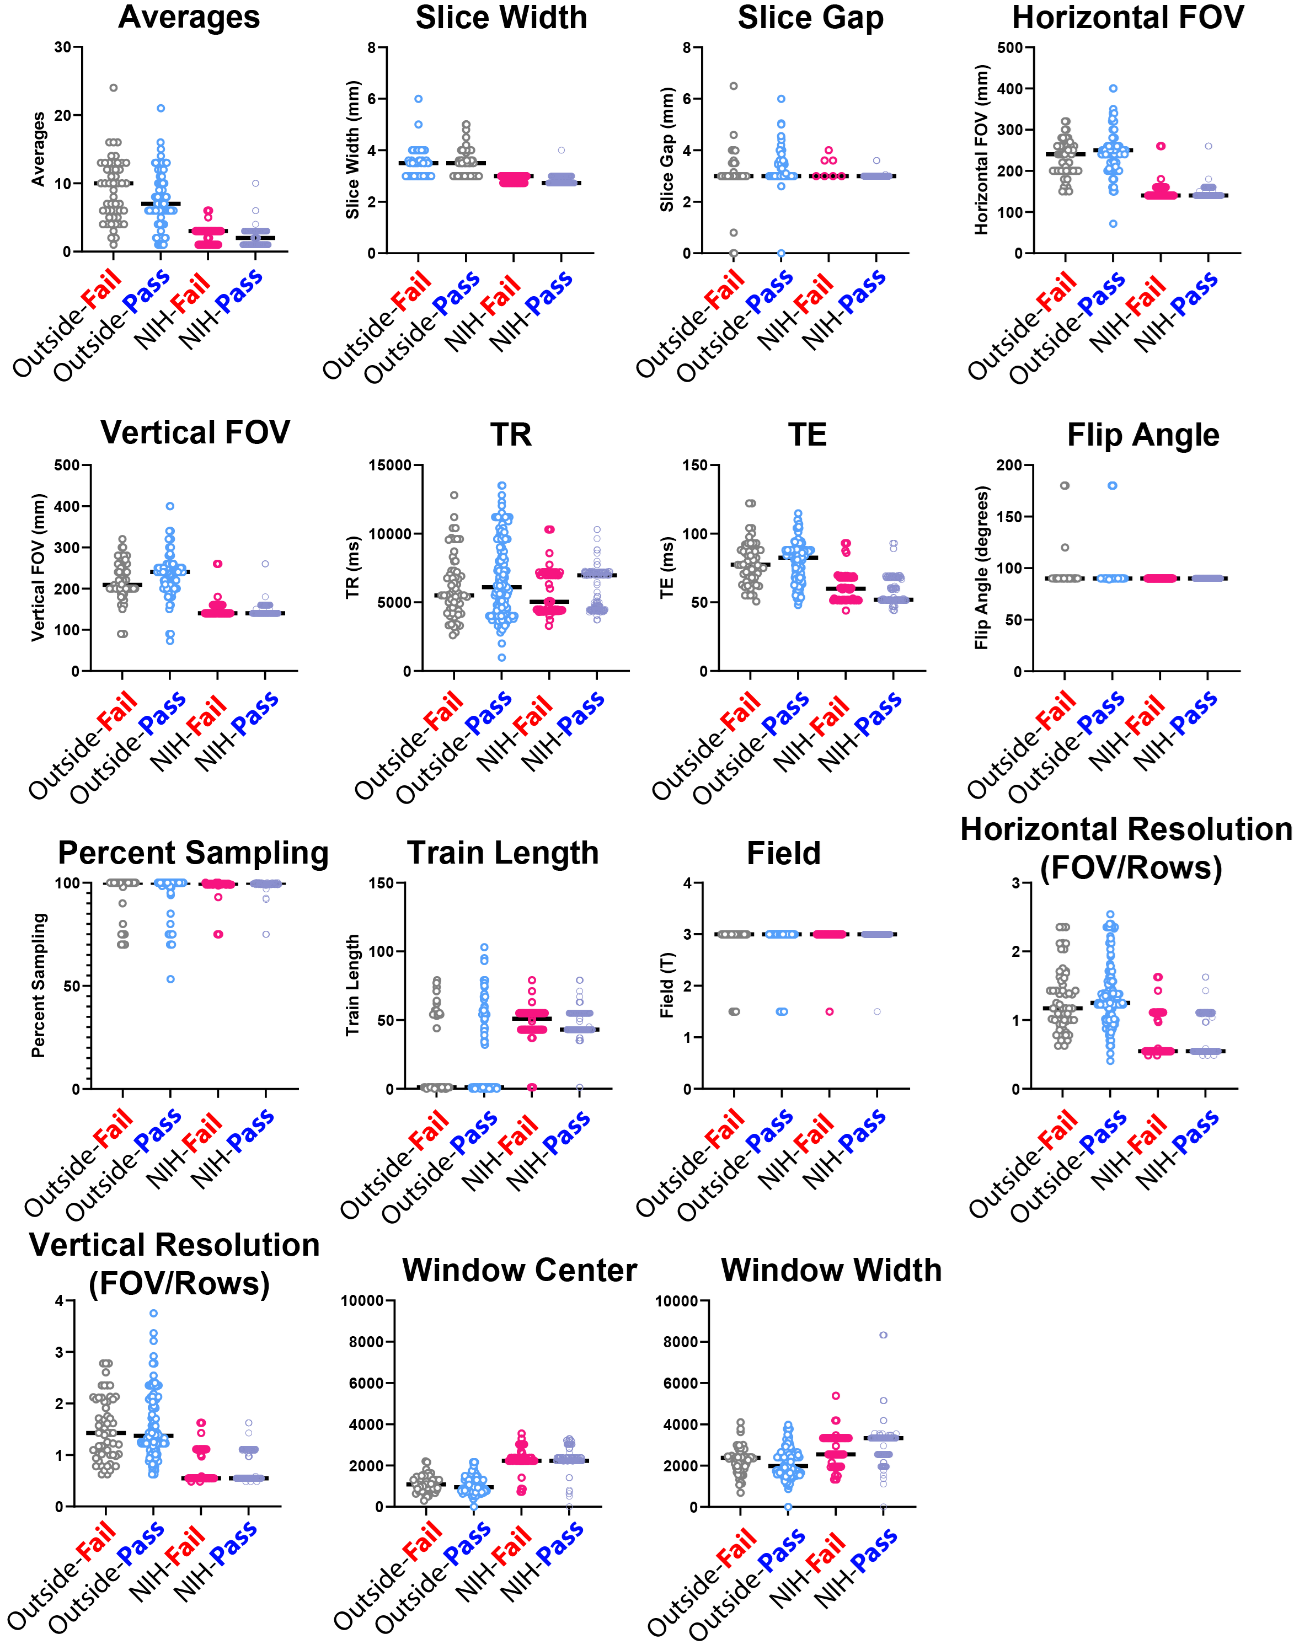
The unique paired nature of the dataset enables a thorough exploration of the interrelationships between acquisition parameters, T2 image quality, and ADC image quality. The quality of the preceding T2 scan is moderately correlated with the quality of the ADC map on the same visit (r~0.4) (Figure 1D). However, there is almost no correlation with successive scans when the same patient is scanned at different sites in either modality (Figure 1D). There was no clear relationship between individual imaging parameters and image quality for either T2 or DWI imaging (Figure 2), in line with previous reports.(3) To the limited extent they are captured on DICOM files, patient demographics (age, weight, race) did not correlate with image quality for either modality.Future ADC Image Quality can be Predicted from T2 Images
The neural network achieved 83% sensitivity and 80% specificity in predicting low quality ADC maps from T2 scans in a balanced (50% pass / 50% fail) holdout from the test set.Distortion From Susceptibility Artifacts is a Greater Contributor to Low Quality Images than Noise
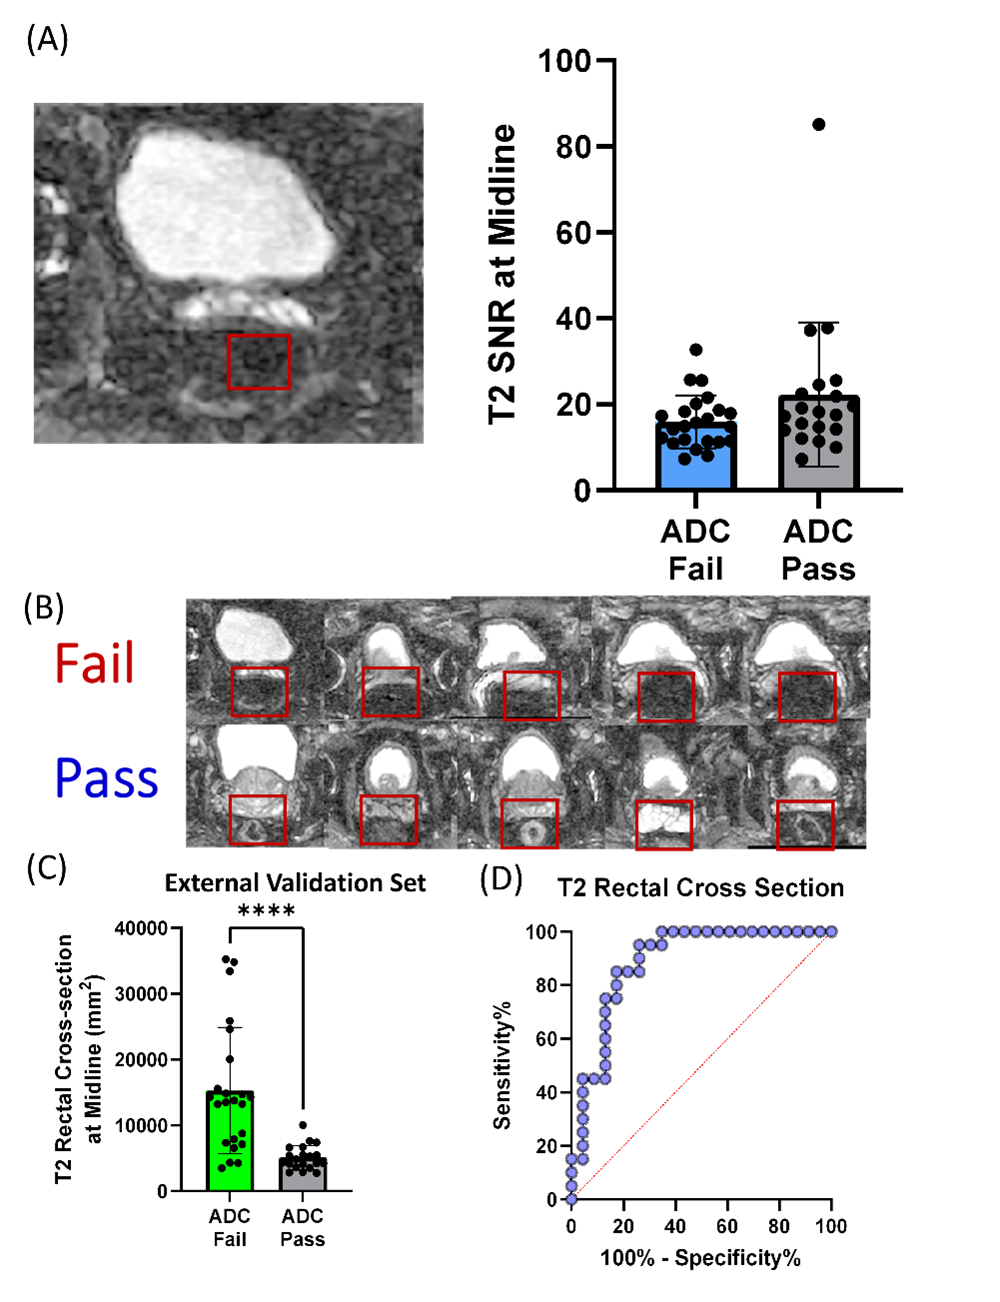
The neural network made relatively accurate predictions, but it struggles to provide clear explanations for those predictions, making it difficult to create new quality control procedures. In response, we explored alternative metrics that are directly indicative of specific imaging artifacts. Surprisingly, the SNR (Fig. 4B) did not correlate with image quality and was in fact higher in low quality images.Rectal Area is a Strong Surrogate for ADC Image Quality
Distortion from susceptibility differences is another potential major artifact. While gross distortion of the prostate was minimal even in ADC scans, distortion was more evident near the rectum (Fig. 4B) and correlated with rectal volume (Fig. 4C). A simple measure of rectal cross-sectional area in the T2 image had strong predictive value for ADC image quality (AUC 0.887, Fig.4D).Key Takeaways:
- ADC image quality appears to be largely a transient phenomenon and not heavily depend on the inherent characteristic of the patient or the technical aspects of the imaging sequence
- Clinical evaluation of ADC maps appears to be mostly impacted by the susceptibility artifact caused by rectal gas
- A neural network can detect these artifacts in T2 images, even when the T2 image itself is not obviously affected by them
- Rectal cross-sectional area in the T2 image also strongly predicted ADC image quality (4)
Acknowledgements
No acknowledgement found.References
- Prostate Magnetic Resonance Image Quality in Pathological Upstaging After Radical Prostatectomy: A Multicentre European Study. Eur Urol Open Sci. 2023;47:94-101.
- Cipollari S, Guarrasi V, Pecoraro M, et al. Convolutional Neural Networks for Automated Classification of Prostate Multiparametric Magnetic Resonance Imaging Based on Image Quality. J Magn Reson Imaging. 2022;55:480-490.
- Sackett J, Shih JH, Reese SE, et al. Quality of Prostate MRI: Is the PI-RADS Standard Sufficient? Acad Radiol. 2021;28:199-207.
- Ullrich T, Quentin M, Schmaltz AK, et al. Hyoscine
butylbromide significantly decreases motion artefacts and allows better
delineation of anatomic structures in mp-MRI of the prostate. Eur Radiol. 2018;28:17-23.
Figures