1234
The Effect of Deep Learning on Radiomic Imaging Features: A Phantom Study1Imaging, Cambridge University Hospital, Cambridge, United Kingdom, 2Department of Radiology, University of Cambridge, Cambridge, United Kingdom
Synopsis
Keywords: Analysis/Processing, Radiomics
Motivation: To investigate the effect of a deep learning reconstruction algorithm on radiomic image features.
Goal(s): To assess the effect of AIRTM Recon Deep Learning (ARDL), a commercial AI reconstruction algorithm, on radiomic features in a set of phantoms.
Approach: A set of radiomic phantoms were constructed and used to acquire images with different numbers of signal averages and ARDL levels. Effects were evaluated through intraclass correlation coefficient (ICC) measures.
Results: Radiomic features maintain excellent ICC values (>0.9) at a constant SNR with ARDL Low, but ICC values decrease with higher ARDL levels
Impact: This research highlights how deep learning image reconstruction can alter radiomic features and could help define a subset of stable features. The level of deep learning reconstruction applied is shown to have significant impact, even at constant SNR.
Introduction
The Image Biomarker Standardization Initiative (IBSI) has done much to establish a general radiomics image processing scheme for calculation of features from imaging1. The ability of radiomics to provide detailed characterisation of tissues has great significance in the field of oncology, especially in MRI due to excellent soft tissue contrast2. However, the lack of standardized imaging protocols and wide variability between centres accentuates reproducibility challenges3.In MRI for prostate tumours, repeatability of radiomics features was highly susceptible to the processing configuration4. While a test–retest reproducibility in T2-w MRI of cervical cancer5 found of only 52% of radiomic had Inter-Class Correlation (ICC) values >0.75. MRI phantoms have also been used for radiomic repeatability studies6,7, with good agreement to in-vivo findings8.
In this study, we examine the effect of AIRTM Recon DL (GE Healthcare, Waukesha, WI) on the consistency of radiomic features using phantoms with different radiomic characteristics. AIRTM Recon DL (ARDL) is a deep learning-based MR image reconstruction method designed to denoise images and supresses Gibbs ringing9.
Methods
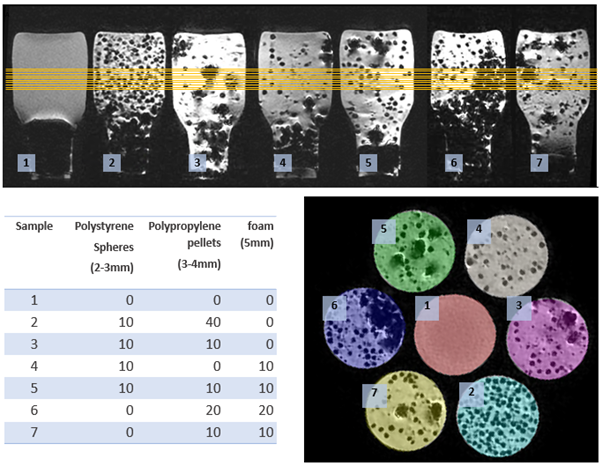
MRI PhantomMRI phantoms were developed with hypointense materials (Figure 1) with diameters from 2mm to 5mm6-8. The materials were mixed with agar, prepared following the Stanford Agar Phantom Recipe10, and poured into 50 mm diameter glass vials.
MRI
Imaging was performed using a 2D Fast Spoiled Gradient Echo, settings were: FOV 25.6 x 25.6 mm, slice thickness = 1 mm, spacing 0 mm, 10 slices, matrix 256 x 256, bandwidth ±31.25 kHz, TR = 34.0 ms, TE = 3 ms, flip angle 10.0°, Parallel Imaging, phase ARC = 2, reconstruction matrix 512 x 512. Images were acquired at NEX of 1, 2, 3, 5 and 9, each with ARDL levels of ‘Off’, ‘Low’, ‘Medium’ and ‘High’.
Segmentation
3D regions of interest were segmented used ITK-Snap v4.0.1, with each vial in the phantom assigned a separate label. Radiomic features were generated using Pyradiomics v3.1.011 without changing the parameter file provided. In total 107 features were generated.
Analysis
SNR was calculated for each NEX and ARDL level using method 1 from NEMA MS-112 Using the agar only vial, the signal ($$${S}$$$) was defined as the mean across the 10 slices within the measurement ROI, and the noise was defined as the standard deviation ($$${SD}$$$) of difference images between even and odd slices within the measurement ROI, giving: $${SNR = \frac{S}{\sqrt{2}\times{SD}}}$$ The intraclass correlation coefficient (ICC) was used to compare the features at each NEX and ARDL level. An ICC value was calculated for each radiomic feature using values pooled across the segmented ROIs. Hierarchical dendrograms with accompanying heatmaps were generated to examine the effect of NEX and ARDL Level on the ICC of the radiomic features.
The ICC for radiomic features were compared at matched scan time and approximately constant SNR. For the constant SNR paradigm, additional images were acquired in a separate imaging session to ensure MR images had the correct NEX.
Results
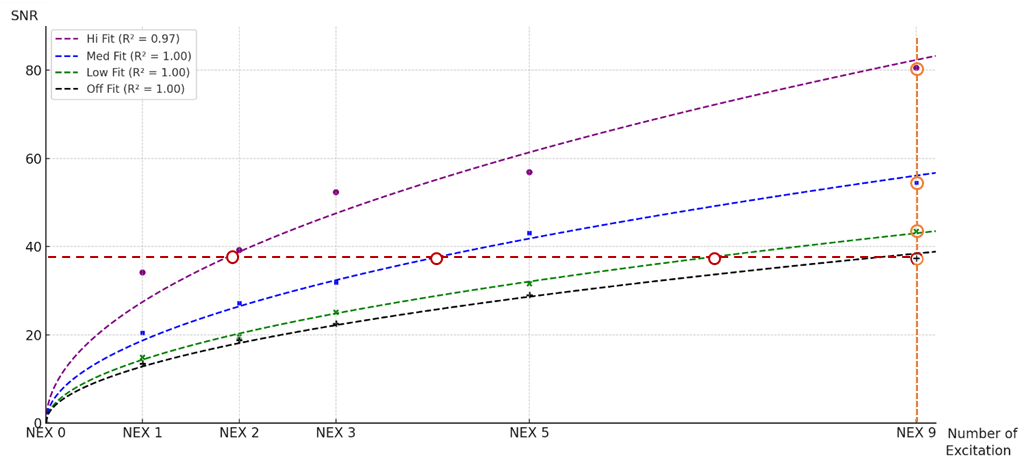
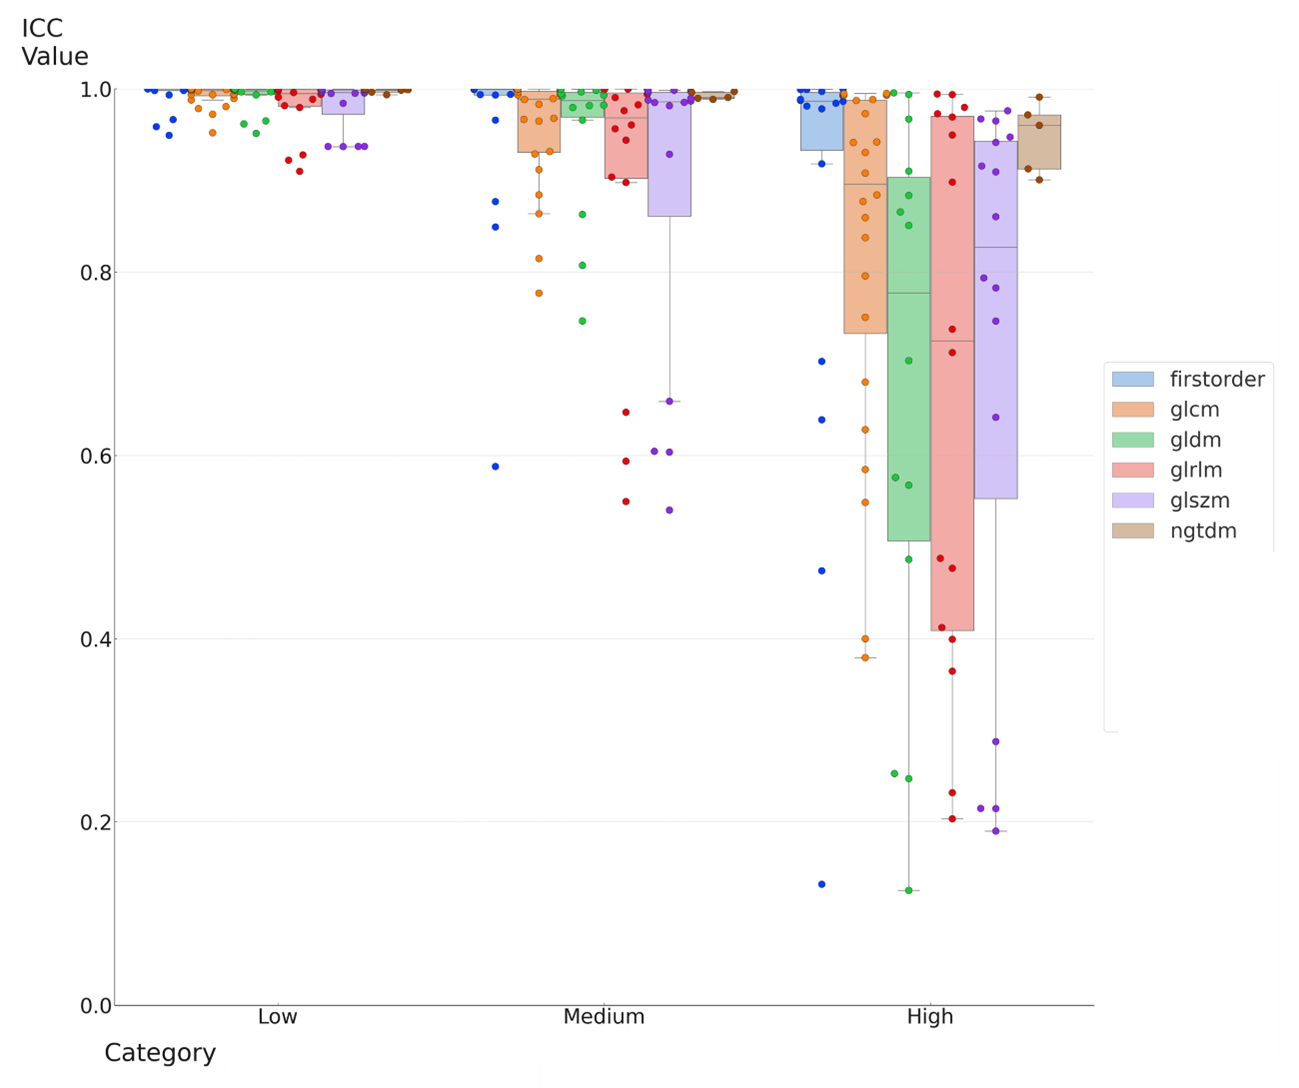
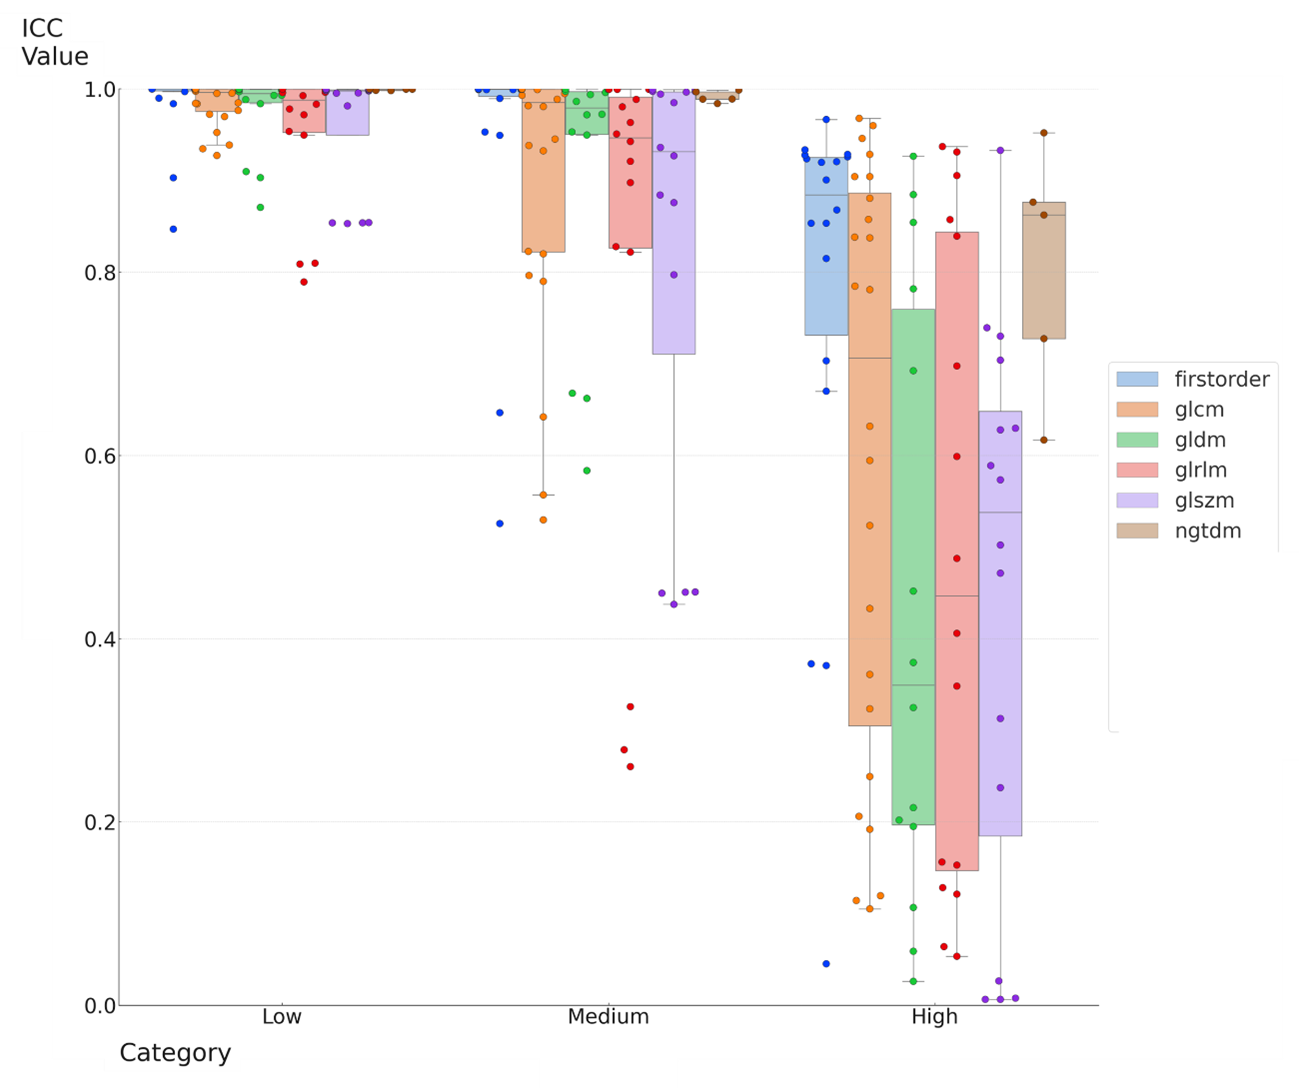
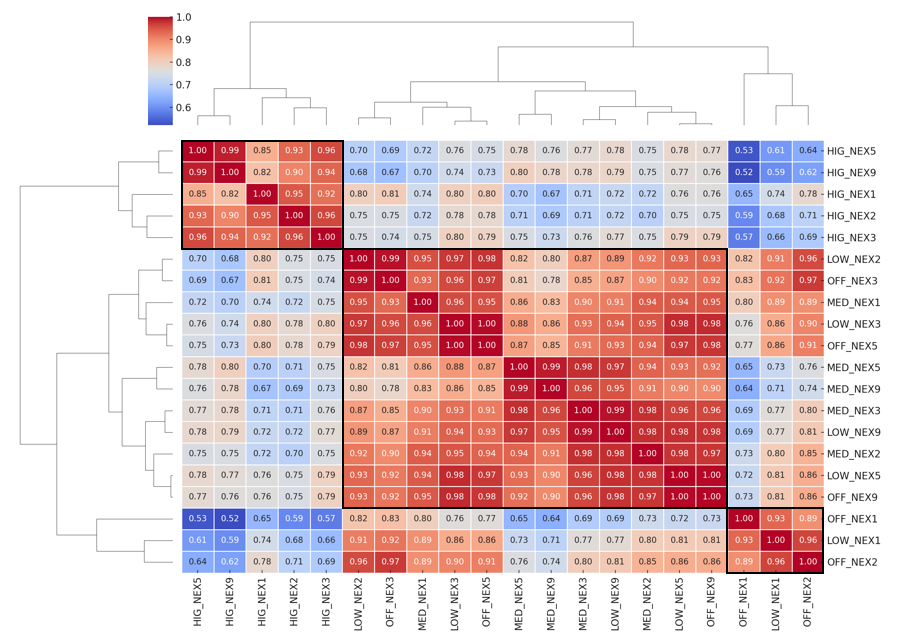
The changes in SNR over the range of NEX and ARDL Levels used in this study are shown in Figure 2. Best fit curves were generated using $$$\alpha\sqrt{NEX}$$$ as reported by Lebel9 where $$$\alpha$$$ is a scale factor for each ARDL Level with values: $$$\alpha_{Hi}=27.4$$$, $$$alpha_{Med}=14.4$$$, $$$\alpha_{Low}=14.4$$$, $$$\alpha_{off}=12.8$$$. The radiomic feature ICC for matched scan time and approximately constant SNR show and shown in Figures 3 and 4. Hierarchical cluster maps of ICC values are shown in Figure 5, demonstrating the clustering of NEX and ARDL levels with overall similar ICC values.Discussion
Data from the uniform gel phantom shows the relationship between SNR and NEX at each ARDL level follows the $$$\alpha\sqrt{NEX}$$$ as previously reported by Lebel9.In both the equal SNR and equal time comparisons the ICC values decrease with increasing ARDL level. At an average SNR of 37, ICC values were all excellent (>0.9) for all radiomic features at ARDL Low, while the proportion of radiomic features with ICC > 0.9 decreased to 83% and 58% for ARDL Medium and ARDL High respectively.
The clustered heatmap shows three distinct groups, the first dendrogram split separates with radiomic features acquired at ARDL High irrespective of NEX, while the second split separates a low SNR group from a larger central group.
Conclusion
In ARDL reconstructed images, exclusion of radiomic features with poor ICC (e.g., <0.75) may benefit subsequent analysis. In the equal SNR comparison, all ARDL Low features have ICC values > 0.9 when compared with the original images. Using ARDL Medium and High levels the ICC values decreased substantially, with the greatest effect on grey level radiomic features.Acknowledgements
No acknowledgement found.References
1. Zwanenburg, Alex, et al. "The image biomarker standardization initiative: standardized quantitative radiomics for high-throughput image-based phenotyping." Radiology 295.2 (2020): 328-338.
2. Limkin, Elaine Johanna, et al. "Promises and challenges for the implementation of computational medical imaging (radiomics) in oncology." Annals of Oncology 28.6 (2017): 1191-1206.
3. Guiot, Julien, et al. "A review in radiomics: making personalized medicine a reality via routine imaging." Medicinal Research Reviews 42.1 (2022): 426-440.
4. Schwier, Michael, et al. "Repeatability of multiparametric prostate MRI radiomics features." Scientific reports 9.1 (2019): 9441.
5. Fiset, Sandra, et al. "Repeatability and reproducibility of MRI-based radiomic features in cervical cancer." Radiotherapy and Oncology 135 (2019): 107-114.
6. Jirák D, Dezortová M, Hájek M. Phantoms for texture analysis of MR images. Long-term and multi-center study. Medical Physics. 2004;31(3):616–22.
7. Steinmann A, Stafford RJ, Sawakuchi G, Wen Z, Court L, Fuller CD, et al. Developing and characterizing MR/CT-visible materials used in QA phantoms for MRgRT systems: Medical Physics. 2018 Feb 1;45(2):773–82.
8. Lee J, Steinmann A, Ding Y, Lee H, Owens C, Wang J, et al. Radiomics feature robustness as measured using an MRI phantom. Scientific Reports 2021 11:1
9. Lebel, R. Marc. "Performance characterization of a novel deep learning-based MR image reconstruction pipeline." arXiv preprint arXiv:2008.06559 (2020).
10. Lucas Center Agar Phantom Recipe, https://med.stanford.edu/content/dam/sm/lucasmri/documents/15_0210_Lucas_Agar_Phantom.pdf
11. Van Griethuysen, Joost JM, et al. "Computational radiomics system to decode the radiographic phenotype." Cancer research 77.21 (2017): e104-e107.
12. National Electrical Manufacturers Association. "Determination of signal-to-noise ratio (SNR) in diagnostic magnetic resonance imaging." NEMA Standards Publication MS 1-2001 (2001).
Figures