1233
RNN-aided metabolite quantification from incomplete FIDs in 1H-MRS of the brain1Department of Applied Bioengineering, Seoul National University Graduate School of Convergence Science and Technology, Seoul, Korea, Republic of, 2Department of Biomedical Sciences, Seoul National University College of Medicine, Seoul, Korea, Republic of, 3Department of Radiology, Seoul National University Hospital, Seoul, Korea, Republic of, 4Department of Medical Sciences, Seoul National University College of Medicine, Seoul, Korea, Republic of
Synopsis
Keywords: Analysis/Processing, Spectroscopy, Brain, Deep learning, Quantification, RNN
Motivation:
Incomplete FIDs can be obtained due to the limited sampling windows as in spectroscopic MRF and SSFP-MRSI, or due to FID truncation for removing spectral artifact.
Goal(s): Developing a means of quantifying metabolites from incomplete FIDs will allow more efficient sequence design and better experimental outcome.
Approach: We developed a recurrent-neural-network (RNN) for metabolite quantification from incomplete FIDs at 3.0T. The RNN was trained on simulated data and tested on in vivo data.
Results: Although the performance of the RNN requires further improvement for low concentration metabolites (e.g., GABA), it may allow quantification of the major metabolites under highly limited sampling windows.
Impact: Incomplete FIDs can be obtained due to the limited
sampling windows as in spectroscopic MRF and SSFP-MRSI. We developed a
recurrent-neural-network, which can quantify the major metabolites from the
initial 64 FID data points, thereby allowing more efficient sequence design.
Introduction
Typically, free induction decays (FIDs) are fully acquired in 1H‐MRS/MRSI. However, there are cases where only incomplete FIDs are available due to the limited sampling windows as in spectroscopic magnetic resonance fingerprinting1,2 and steady-state free precession-based MRSI3-5 or due to FID truncation for removing spectral artifact6.We developed a recurrent-neural-network (RNN) for metabolite quantification from incomplete FIDs at 3.0T. The RNN was trained on simulated data and tested on in vivo data.
Methods
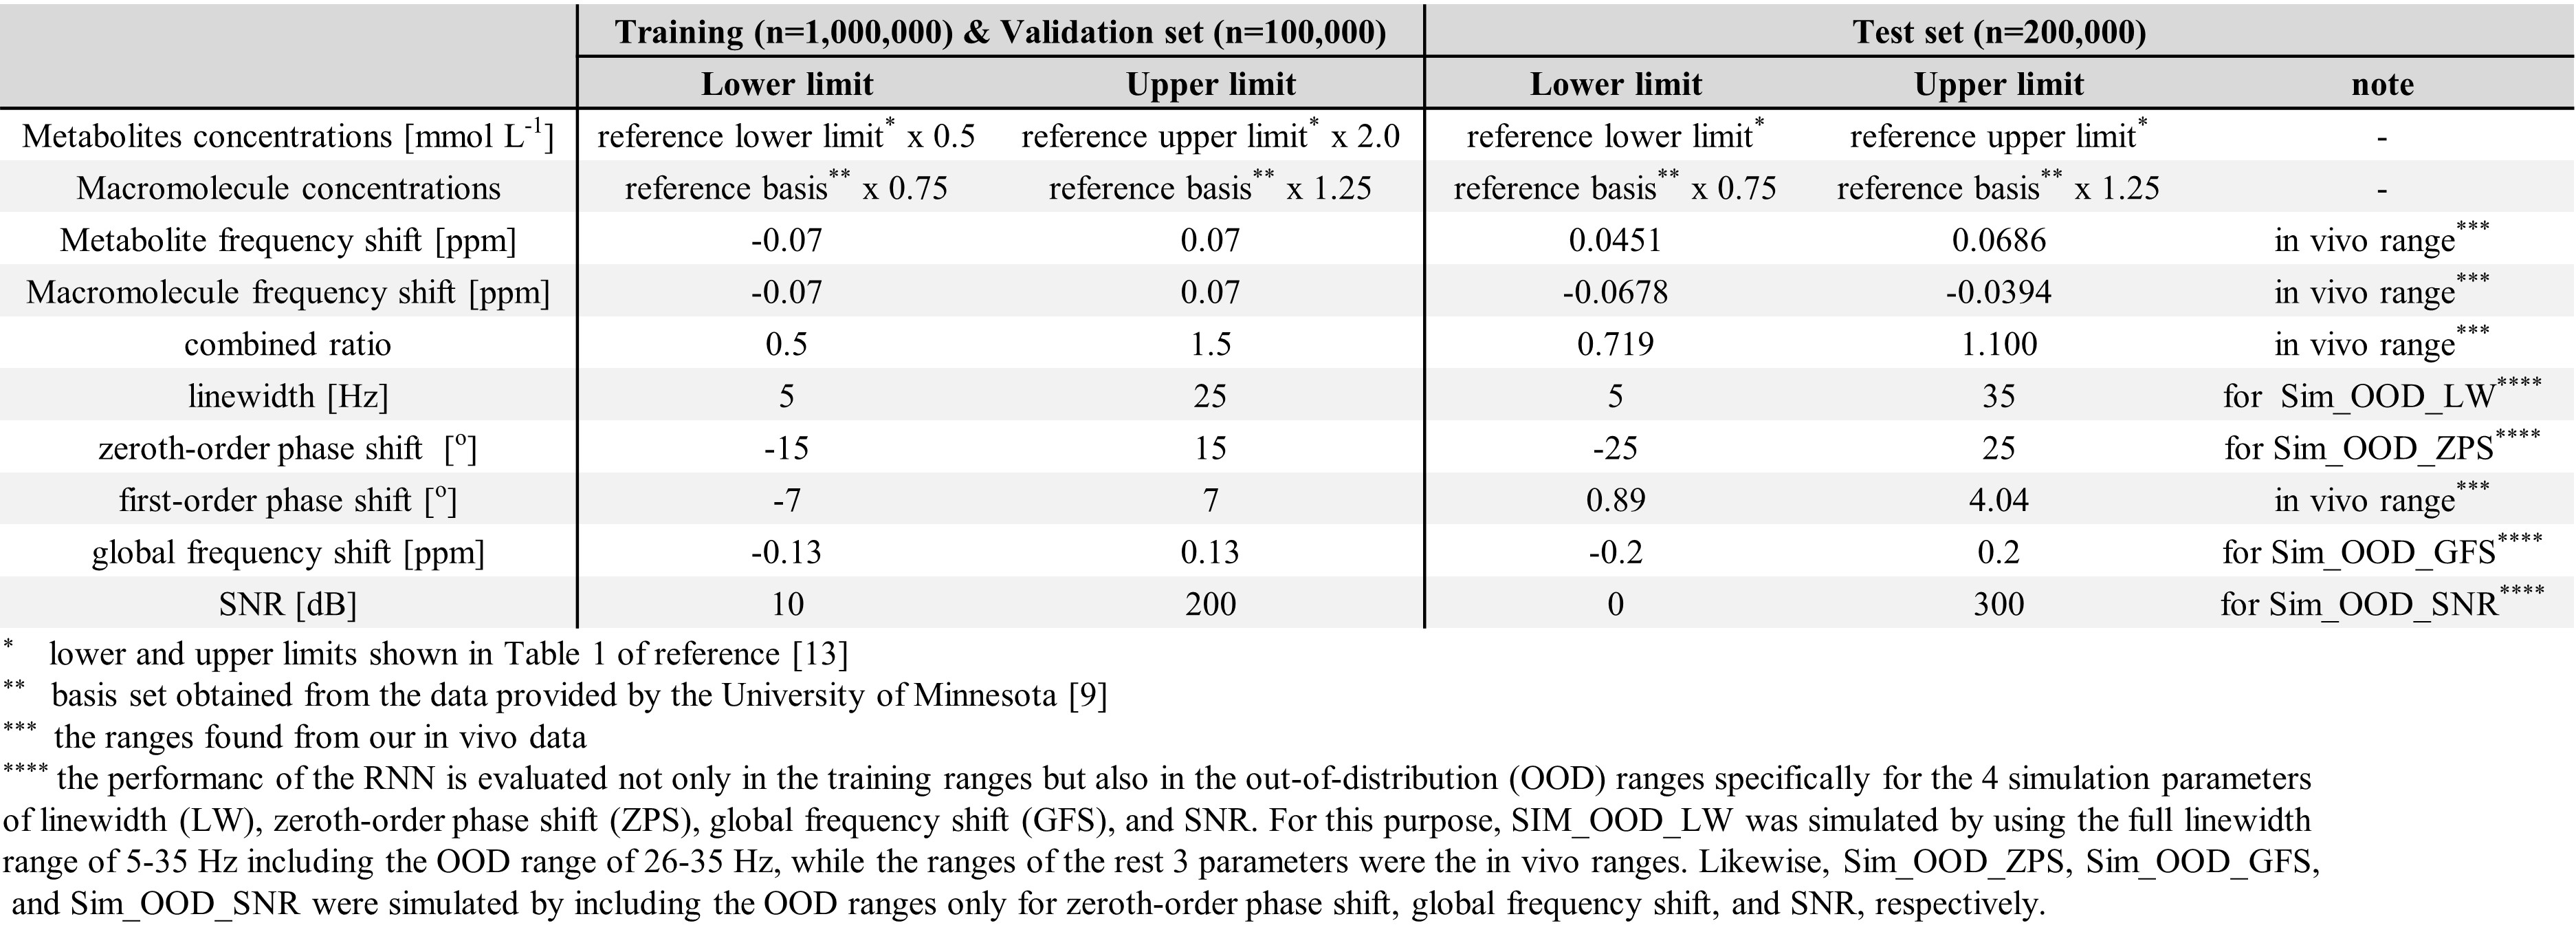
In vivo data: This study was approved by IRB (informed consent received from all volunteers (n=27)). Data were acquired on a Siemens scanner (a 2x2x2 cm3 voxel (posterior cingulate cortex), PRESS, TR/TE=2000/30 ms, spectral bandwidth=2000 Hz, 2048 points, and NEX equivalent to 64).FID-simulation and RNN: To extract a prior knowledge for simulation, in vivo data were fitted7 using an in-house software (Python (v3.10.4)), a metabolite basis set (17 metabolites), and a macromolecule (MM) basis set (21 model functions)8,9. The residuals-of-fit were used to model spectral baseline10-12. Then, fully sampled FIDs were generated based on the prior knowledge13 and used as a training and a validation datasets (Table 1). Linewidth (LW; Lorentzian), zeroth-/first-order phase shift (ZPS/FPS), global frequency shift (GFS), and SNR (Gaussian noise) were also included as the simulation parameters (Table 1). For the test set, 200,000 FIDs were generated using wider ranges of LW, ZPS, GFS, and SNR to evaluate the RNN in the out-of-distribution (OOD) ranges as well. Then, the data, for which those 4 parameters were in the in vivo ranges, were sorted into Sim_REAL (n=34). The data, for which the LW range includes OOD ranges, while the rest 3 parameters were in the in vivo range, were sorted into Sim_OOD_LW (n=278). Likewise, the data including OOD ranges for ZPS, GFS, or SNR were sorted into Sim_OOD_ZPS (n=417), Sim_OOD_GFS (n=174), and Sim_OOD_SNR (n=392), respectively (Table 1).
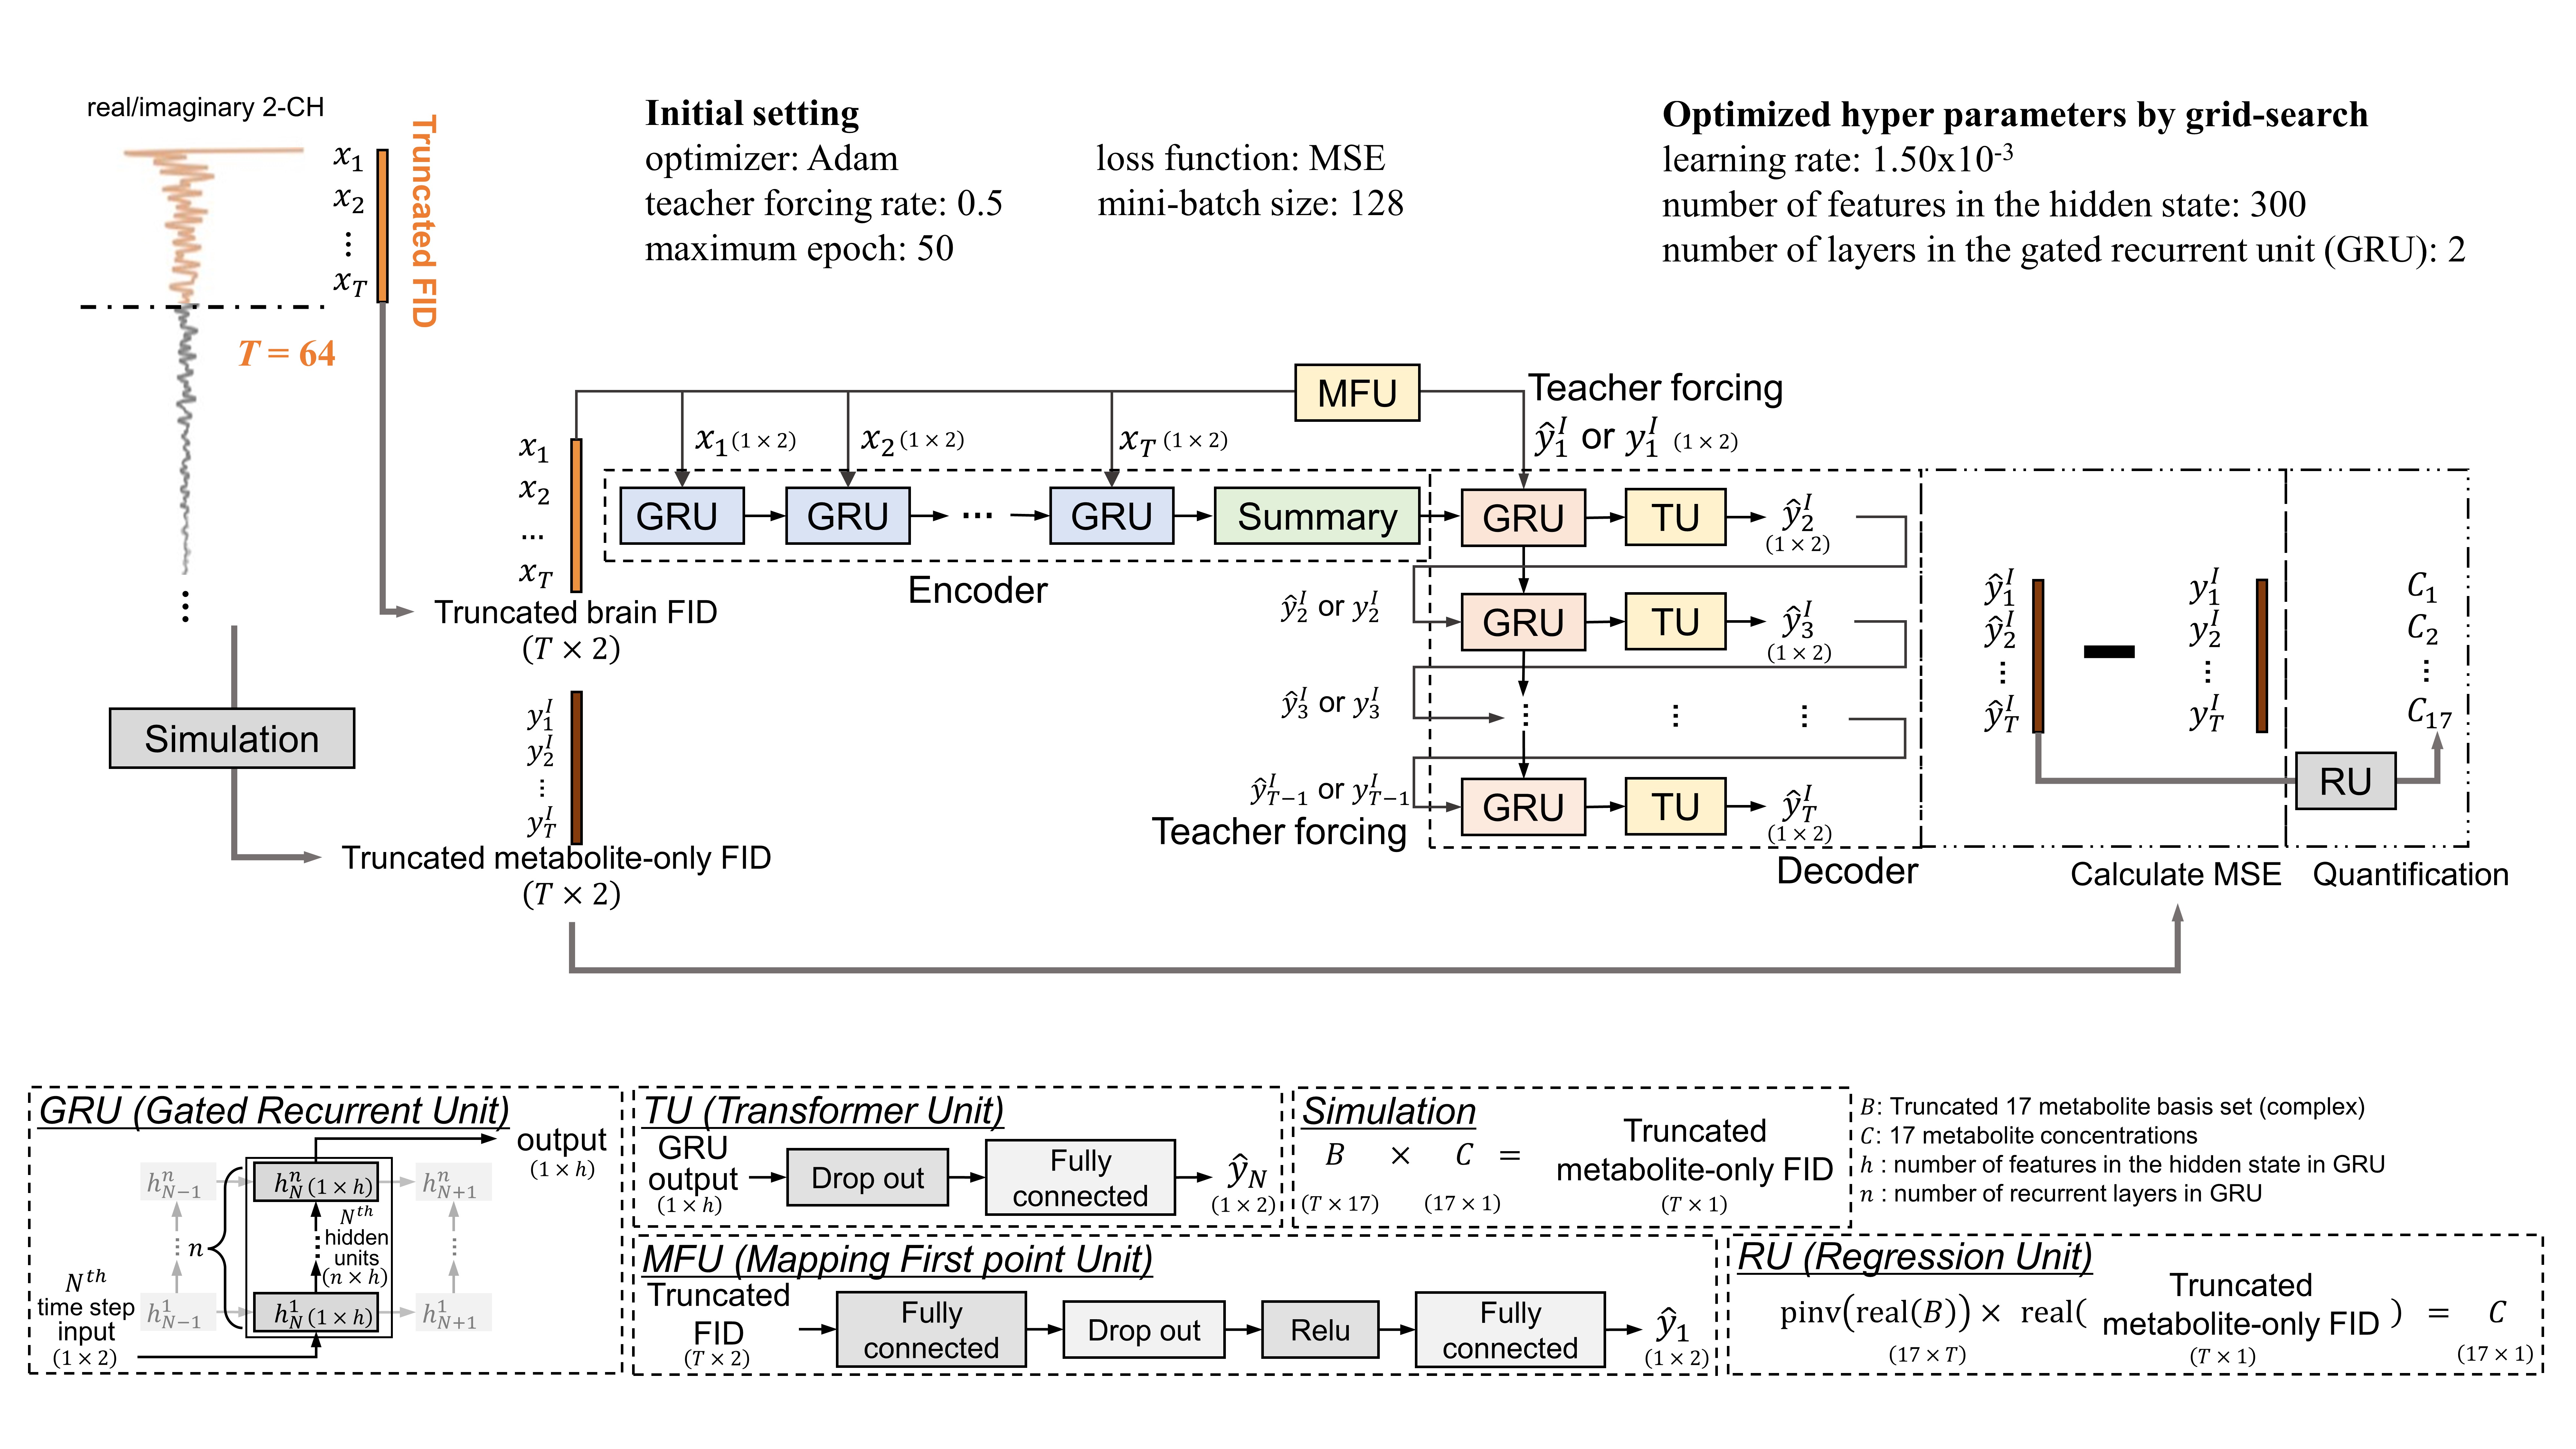
The RNN was implemented (Figure 1) by modifying an RNN encoder-decoder14 (PyTorch (v.1.11.0)). The inputs of the RNN were real/imaginary two-channel truncated FIDs (tFIDs) retaining only the first 64 data points. The corresponding ground-truth (GT) FIDs were prepared by including only the metabolite basis set that was also truncated. Therefore, the RNN is trained to convert a brain tFID into a noise-free, line-narrowed, phase/frequency-corrected, metabolite-only tFID. The regression unit (RU) performs linear regression on the metabolite-only tFID using the truncated metabolite basis set to yield concentrations (Figure 1). Thus, it is a time-domain approach of the previous study13, but with tFIDs instead of fully sampled spectra.
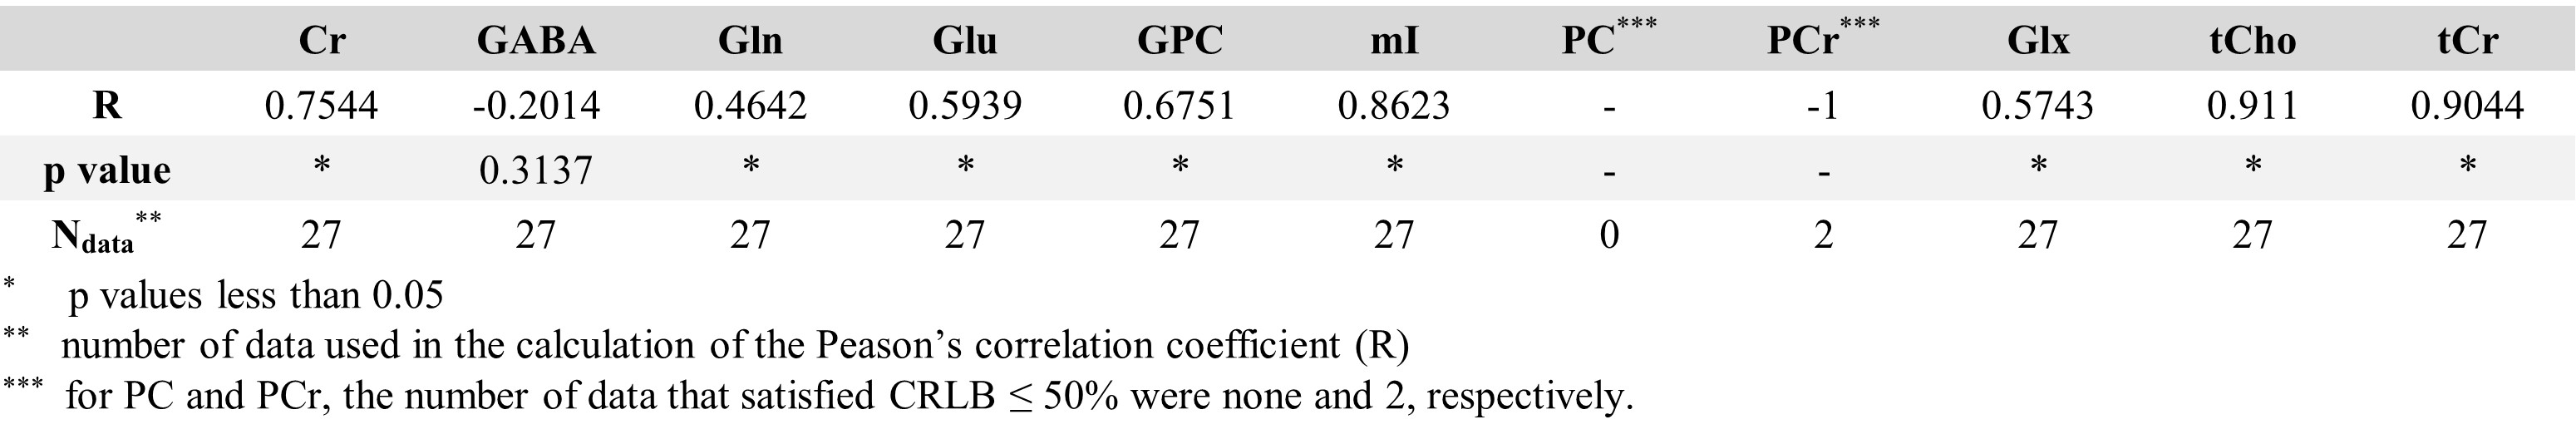
Evaluation: For simulated data (known GT concentrations), mean-absolute-percentage-error (MAPE) was estimated for the RNN-derived concentrations. For in vivo data, fully sampled data were analyzed by LCModel (v.6.3), and only those results with CRLB≤50% were used as the GT concentrations. Then, the Pearson’s correlation coefficients were obtained between the RNN-derived and GT concentrations.
Results
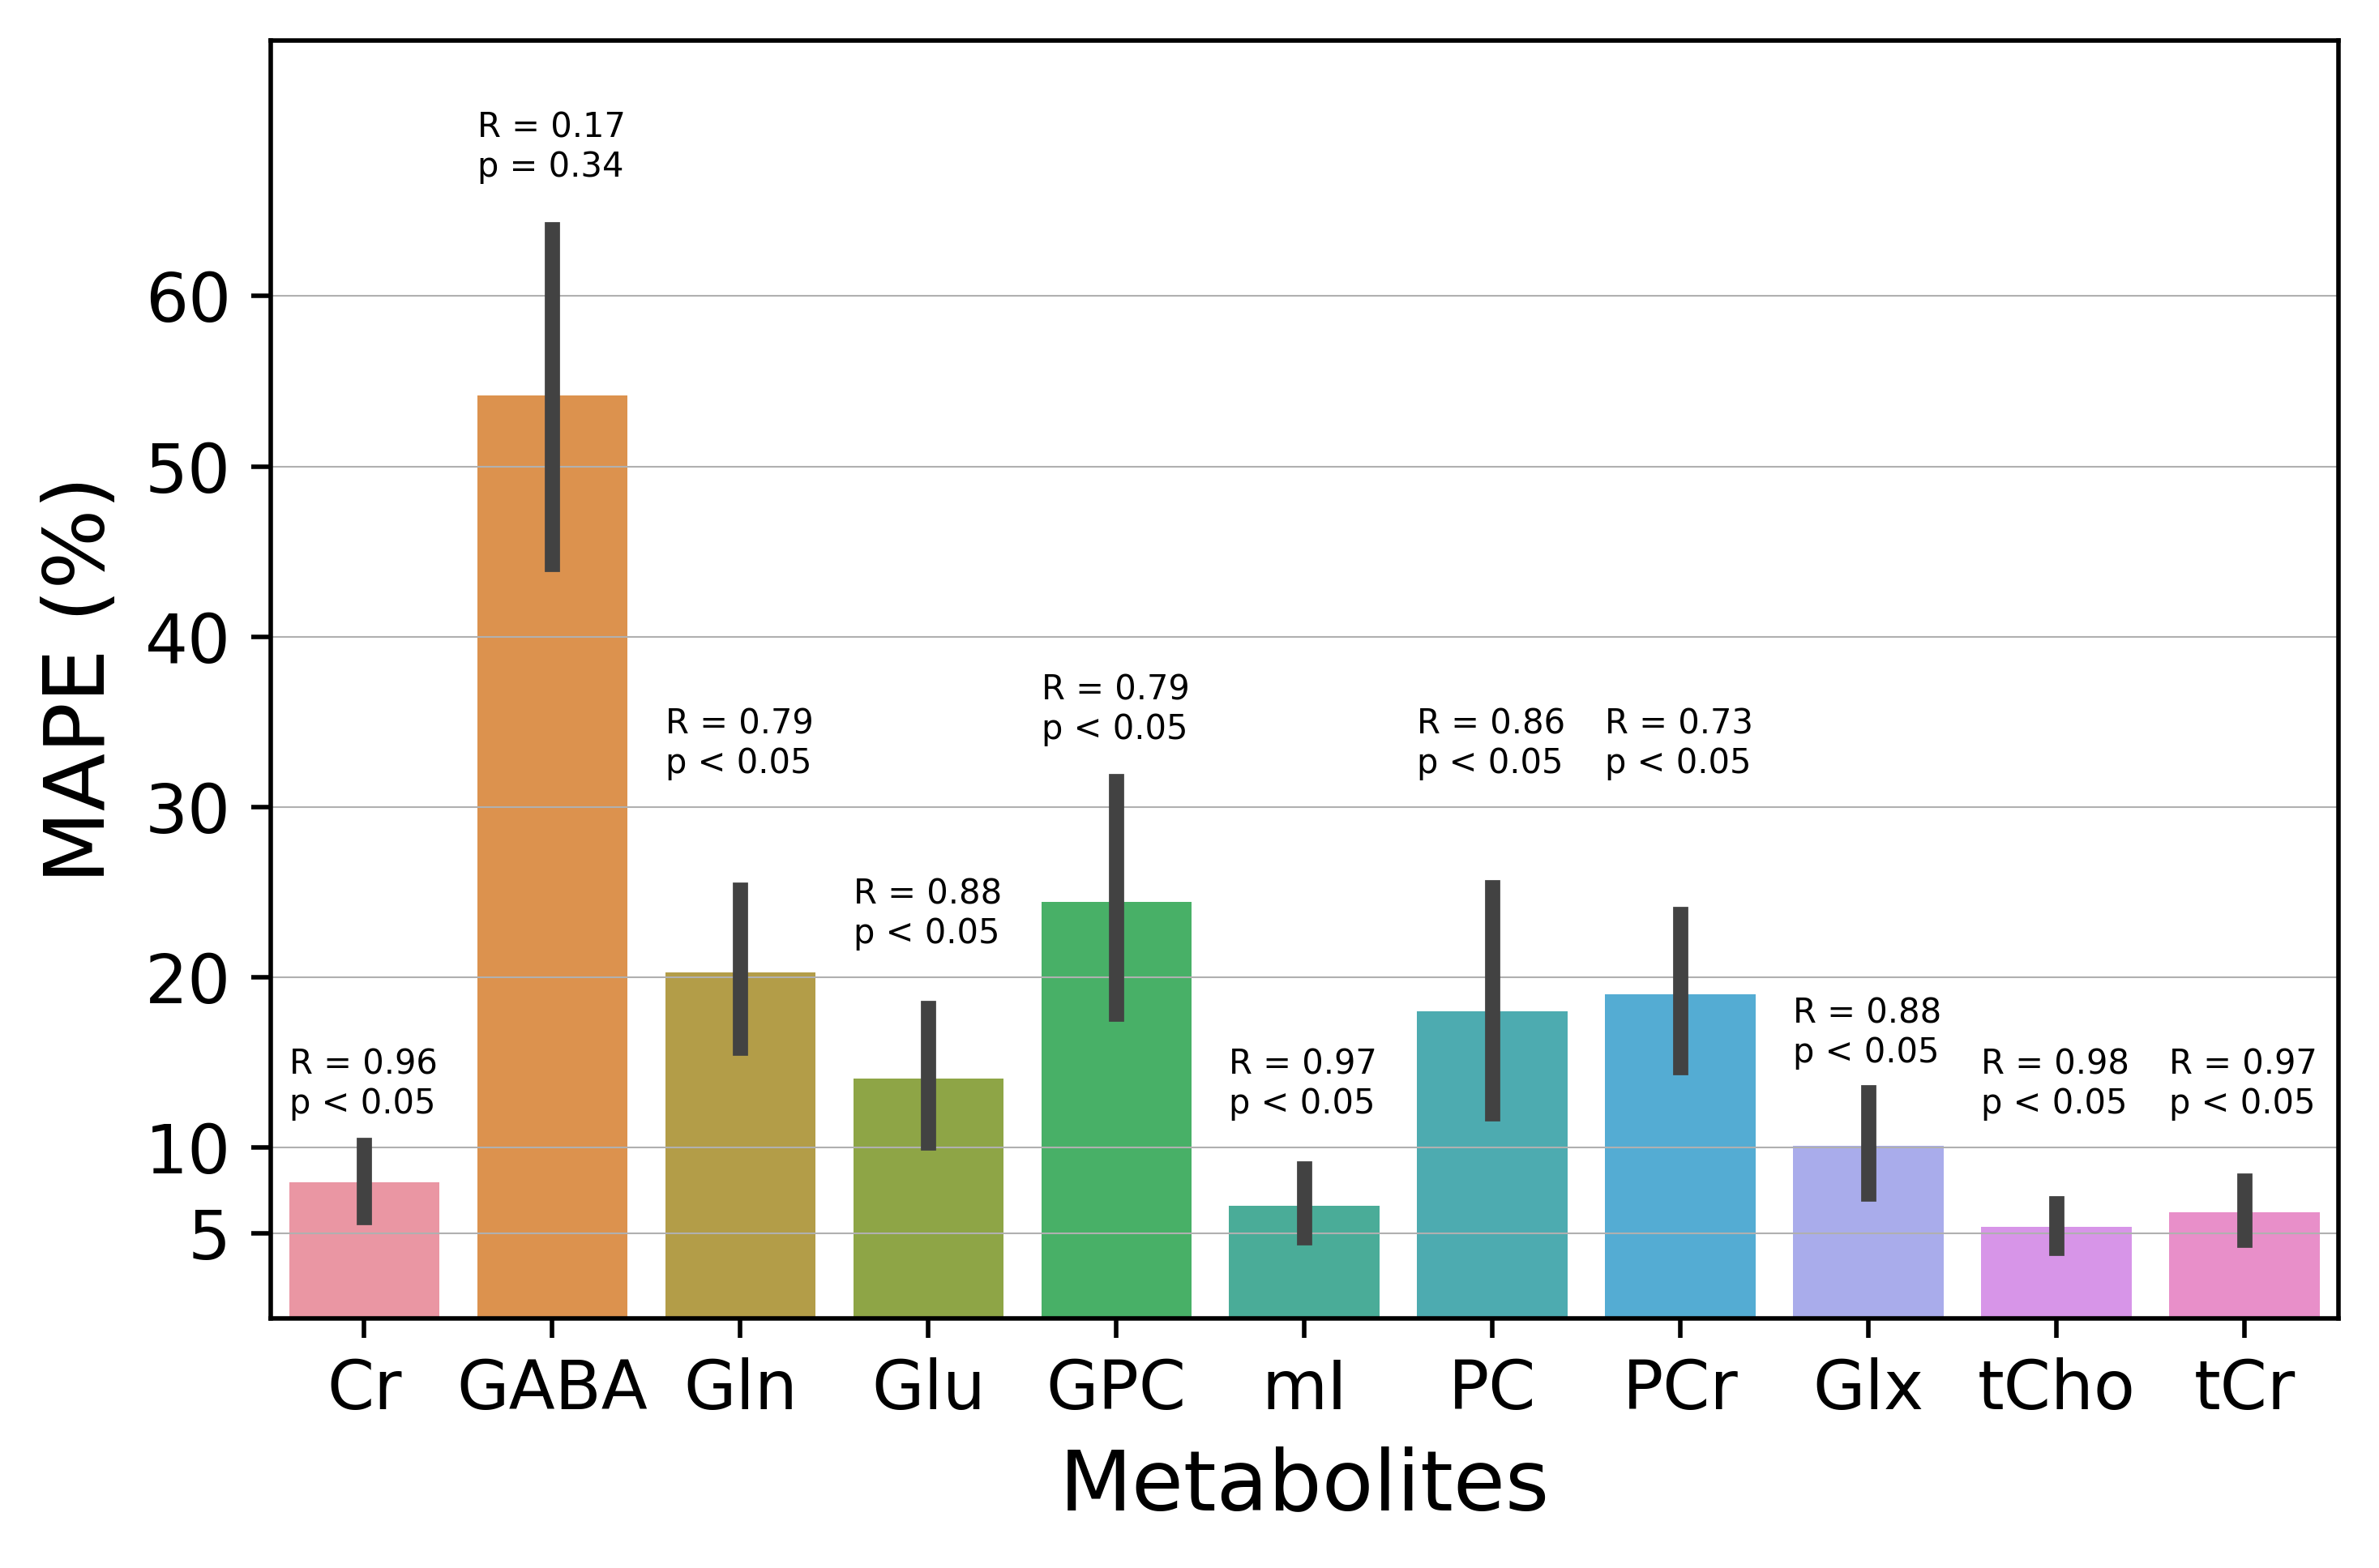
Figure 2 shows the MAPE of the RNN-derived concentrations on Sim_REAL. For mI, Glx, tCho, and tCr normalized to tNAA, the MAPE were 5.35~10.1%. Except for GABA, the RNN-derived concentrations were highly correlated with the GT concentrations (R=0.73~0.98).The correlations between the RNN-derived and GT concentrations on the in vivo tFIDs are shown in Table 2. Strong correlations were obtained for mI, tCho, and tCr, and a moderate correlation was obtained for Glx. The correlation did not reach statistical significance for GABA.
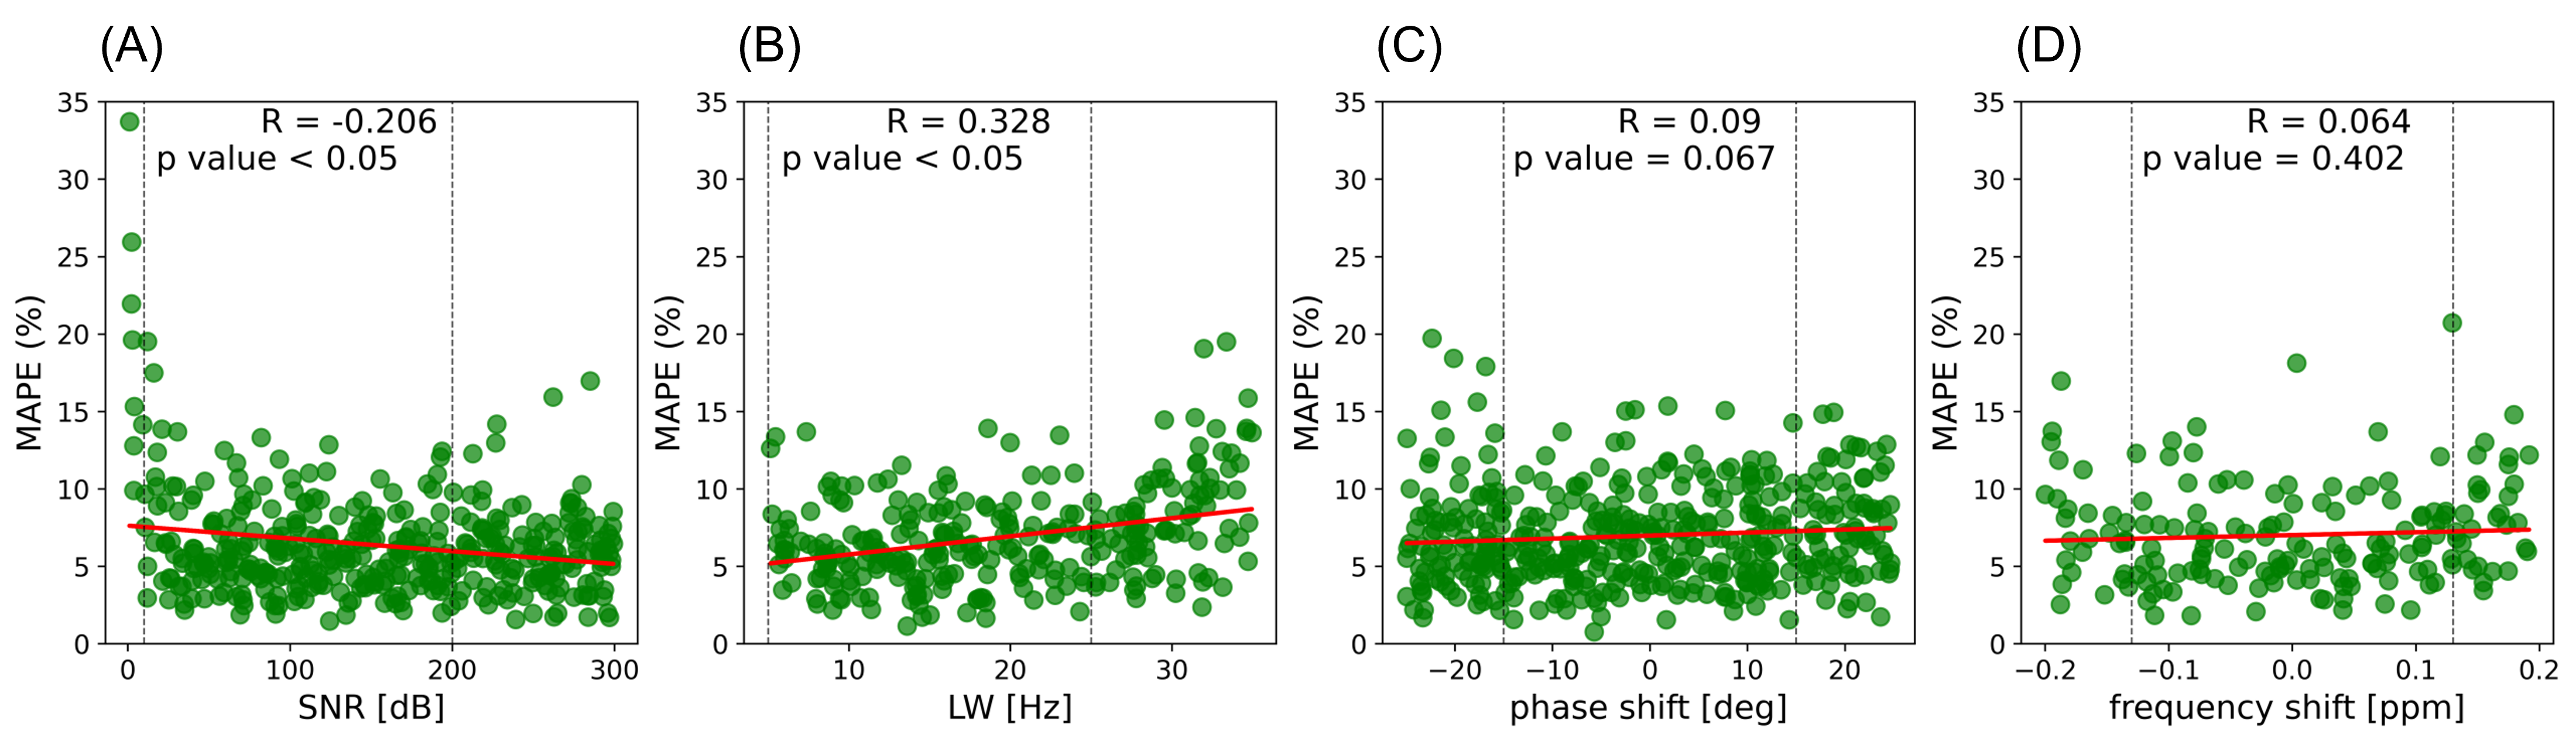
In Figure 3, overall, the performance of the RNN is consistent across the training and OOD ranges for the simulation parameters. However, MAPE is rapidly increasing in the lower OOD range of SNR (A).
Discussion
Although the performance of the RNN requires further improvement for low concentration metabolites (e.g., GABA), the strong correlations between the RNN-derived and GT concentrations for mI, tCho, and tCr were observed on both simulated (Sim_REAL) and in vivo data. This supports the utility of our simulated data and the potential application of our RNN in the quantification of the major metabolites under highly limited sampling windows.Our approach of the initial metabolite-only tFID generation followed by quantification with simple linear regression may be more desirable than, for instance, an initial restoration to fully sample FIDs followed by LCModel analysis, given the potential alteration of the noise property in machine-generated outputs and its implication in nonlinear fitting15,16. Our approach also reduces the burden imposed on the RNN relative to a direct quantification from tFIDs. The analysis in Figure 3 can be used for screening of the input data to minimize the potential quantitative bias with neural networks17.
Conclusion
RNN may allow quantification of the major metabolites under highly limited sampling windows.Acknowledgements
This work was supported by the National Research Foundation of Korea (NRF) grant funded by the Korea government (MSIT) [2022R1A2B5B01002398].References
- Wang CY, Liu Y, Huang S, Griswold MA, Seiberlich N, Yu X. 31P magnetic resonance fingerprinting for rapid quantification of creatine kinase reaction rate in vivo. NMR Biomed. 2017;30(12). doi:10.1002/nbm.3786
- Kulpanovich A, Tal A. The application of magnetic resonance fingerprinting to single voxel proton spectroscopy. NMR Biomed. 2018;31(11):e4001. doi:10.1002/nbm.4001
- Henning A, Fuchs A, Murdoch JB, Boesiger P. Slice-selective FID acquisition, localized by outer volume suppression (FIDLOVS) for 1H-MRSI of the human brain at 7 T with minimal signal loss. NMR Biomed. 2009;22(7):683-696. doi:10.1002/nbm.1366
- Bogner W, Gruber S, Trattnig S, Chmelik M. High-resolution mapping of human brain metabolites by free induction decay 1H MRSI at 7 T. NMR Biomed. 2012;25(6):873-882. doi:10.1002/nbm.1805
- Hangel G, Strasser B, Považan M, et al. Ultra-high resolution brain metabolite mapping at 7 T by short-TR Hadamard-encoded FID-MRSI. NeuroImage. 2018;168:199-210. doi:10.1016/j.neuroimage.2016.10.043
- Kreis R. Issues of spectral quality in clinical 1H-magnetic resonance spectroscopy and a gallery of artifacts. NMR Biomed. 2004;17(6):361-381. doi:10.1002/nbm.891
- Borbath T, Murali-Manohar S, Dorst J, Wright AM, Henning A. ProFit-1D—A 1D fitting software and open-source validation data sets. Magn Reson Med. 2021;86(6):2910-2929. doi:10.1002/mrm.28941
- Cudalbu C, Behar KL, Bhattacharyya PK, et al. Contribution of macromolecules to brain 1H MR spectra: Experts’ consensus recommendations. NMR Biomed. 2021;34(5):e4393. doi:10.1002/nbm.4393
- Marjanska, M. (Creator), Deelchand, D. K. (Creator), Kreis, R. (Creator) (Apr 16 2021). MRS fitting challenge data setup by ISMRM MRS study group. Data Repository for the University of Minnesota. https://experts.umn.edu/en/datasets/mrs-fitting-challenge-data-setup-by-ismrm-mrs-study-group.
- Giapitzakis I, Borbath T, Murali-Manohar S, Avdievich N, Henning A. Investigation of the influence of macromolecules and spline baseline in the fitting model of human brain spectra at 9.4T. Magn Reson Med. 2019;81(2):746-758. doi:10.1002/mrm.27467
- Provencher S. LCModel Manual. Stephen Provencher; 2019
- Simicic D, Rackayova V, Xin L, et al. In vivo macromolecule signals in rat brain 1H-MR spectra at 9.4T: Parametrization, spline baseline estimation, and T2 relaxation times. Magn Reson Med. 2021;86(5):2384-2401. doi:10.1002/mrm.28910
- Lee HH, Kim H. Intact metabolite spectrum mining by deep learning in proton magnetic resonance spectroscopy of the brain. Magn Reson Med. 2019;82(1):33-48. doi:10.1002/mrm.27727
- Cho K, Merrienboer B van, Gulcehre C, et al. Learning Phrase Representations using RNN Encoder–Decoder for Statistical Machine Translation. Proc 2014 Conf Empir Methods Nat Lang Process (EMNLP).:1724-1734. doi:10.3115/v1/d14-1179
- Dziadosz M, Rizzo R, Kyathanahally SP, Kreis R. Denoising single MR spectra by deep learning: Miracle or mirage? Magn Reson Med. 2023;90(5):1749-1761. doi:10.1002/mrm.29762
- Landheer K, Juchem C. Are Cramér-Rao lower bounds an accurate estimate for standard deviations in in vivo magnetic resonance spectroscopy? NMR Biomed. 2021;34(7):e4521. doi:10.1002/nbm.4521
- Rizzo R, Dziadosz M, Kyathanahally SP, Shamaei A, Kreis R. Quantification of MR spectra by deep learning in an idealized setting: Investigation of forms of input, network architectures, optimization by ensembles of networks, and training bias. Magn Reson Med. 2023;89(5):1707-1727. doi:10.1002/mrm.29561
Figures