1216
A novel cumulative transfer function concept for accurate prediction of RF heating of bipolar leads1Department of Biomedical Engineering, McCormick School of Engineering, Northwestern University, Evanston, IL, United States, 2Department of Radiology, Feinberg School of Medicine, Northwestern University, Chicago, IL, United States
Synopsis
Keywords: Safety, Modelling, Medical Implants, Transfer Function, ISO/TS 10974
Motivation: Radiofrequency (RF) tissue heating is a known safety risk for patients with cardiac implantable electronic devices (CIEDs), especially children with epicardial systems.
Goal(s): We present the first cumulative transfer function based on the guidelines in ISO/TS 10974 to evaluate the RF heating of a CIED with a bipolar epicardial lead.
Approach: We measured, calibrated, and validated cumulative transfer functions for predicting RF heating through in vitro experiments and electromagnetic simulations.
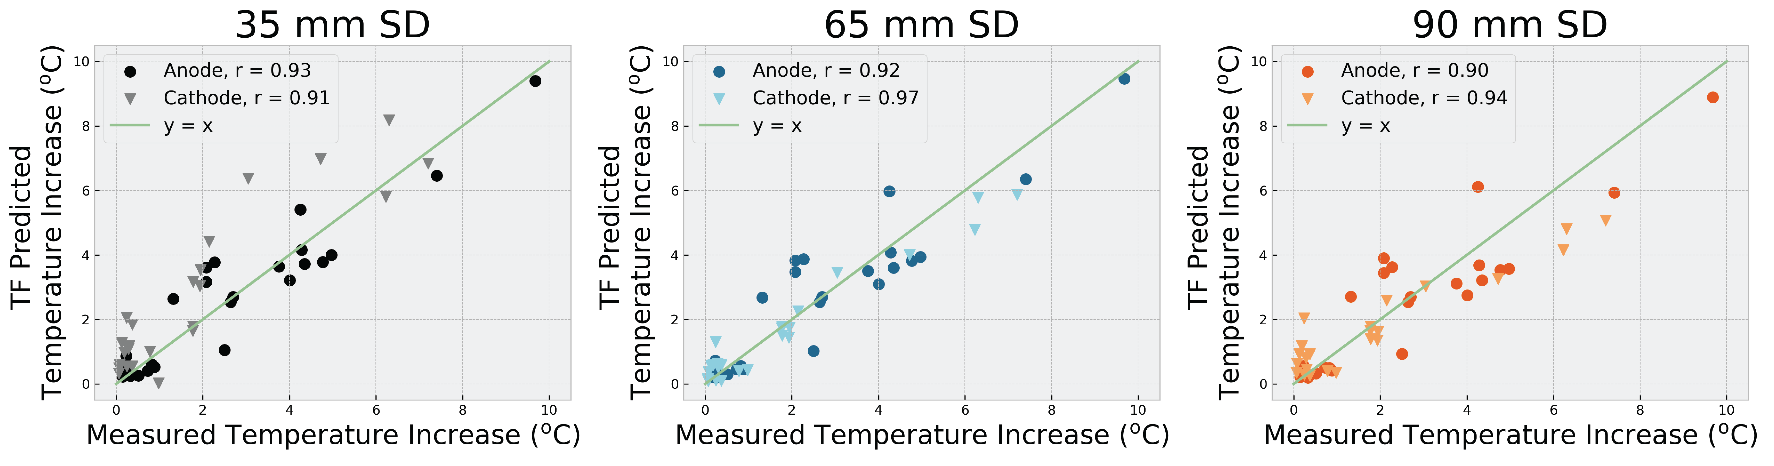
Results: Our cumulative transfer functions accurately predicted RF heating around the electrode ends for 48 unique lead trajectories (r=0.90-0.97, p<0.05).
Impact: We introduce a high-fidelity cumulative transfer function model of a CIED with a bipolar epicardial lead to enable the evaluation of RF heating of bifurcating leads during MRI.
Introduction
Radiofrequency (RF) tissue heating around medical implants is a prominent safety risk, restricting accessibility to MRI1,2. Currently, there are no MR-conditional epicardial cardiac implantable electronic devices (CIEDs), which disproportionally affects the pediatric population who are the main recipients of epicardial CIEDs. Current methods for predicting RF heating of active devices outlined in ISO/TS 10974, particularly the transfer function (TF) method, do not specify the approach for bipolar epicardial leads which include lead bifurcation3. Recent studies have developed TF methods for parallel wires, but bifurcating leads have yet to be studied4,5. Here, we present the first successful application of the TF concept for evaluating RF heating of a CIED with a bipolar epicardial lead.Methods
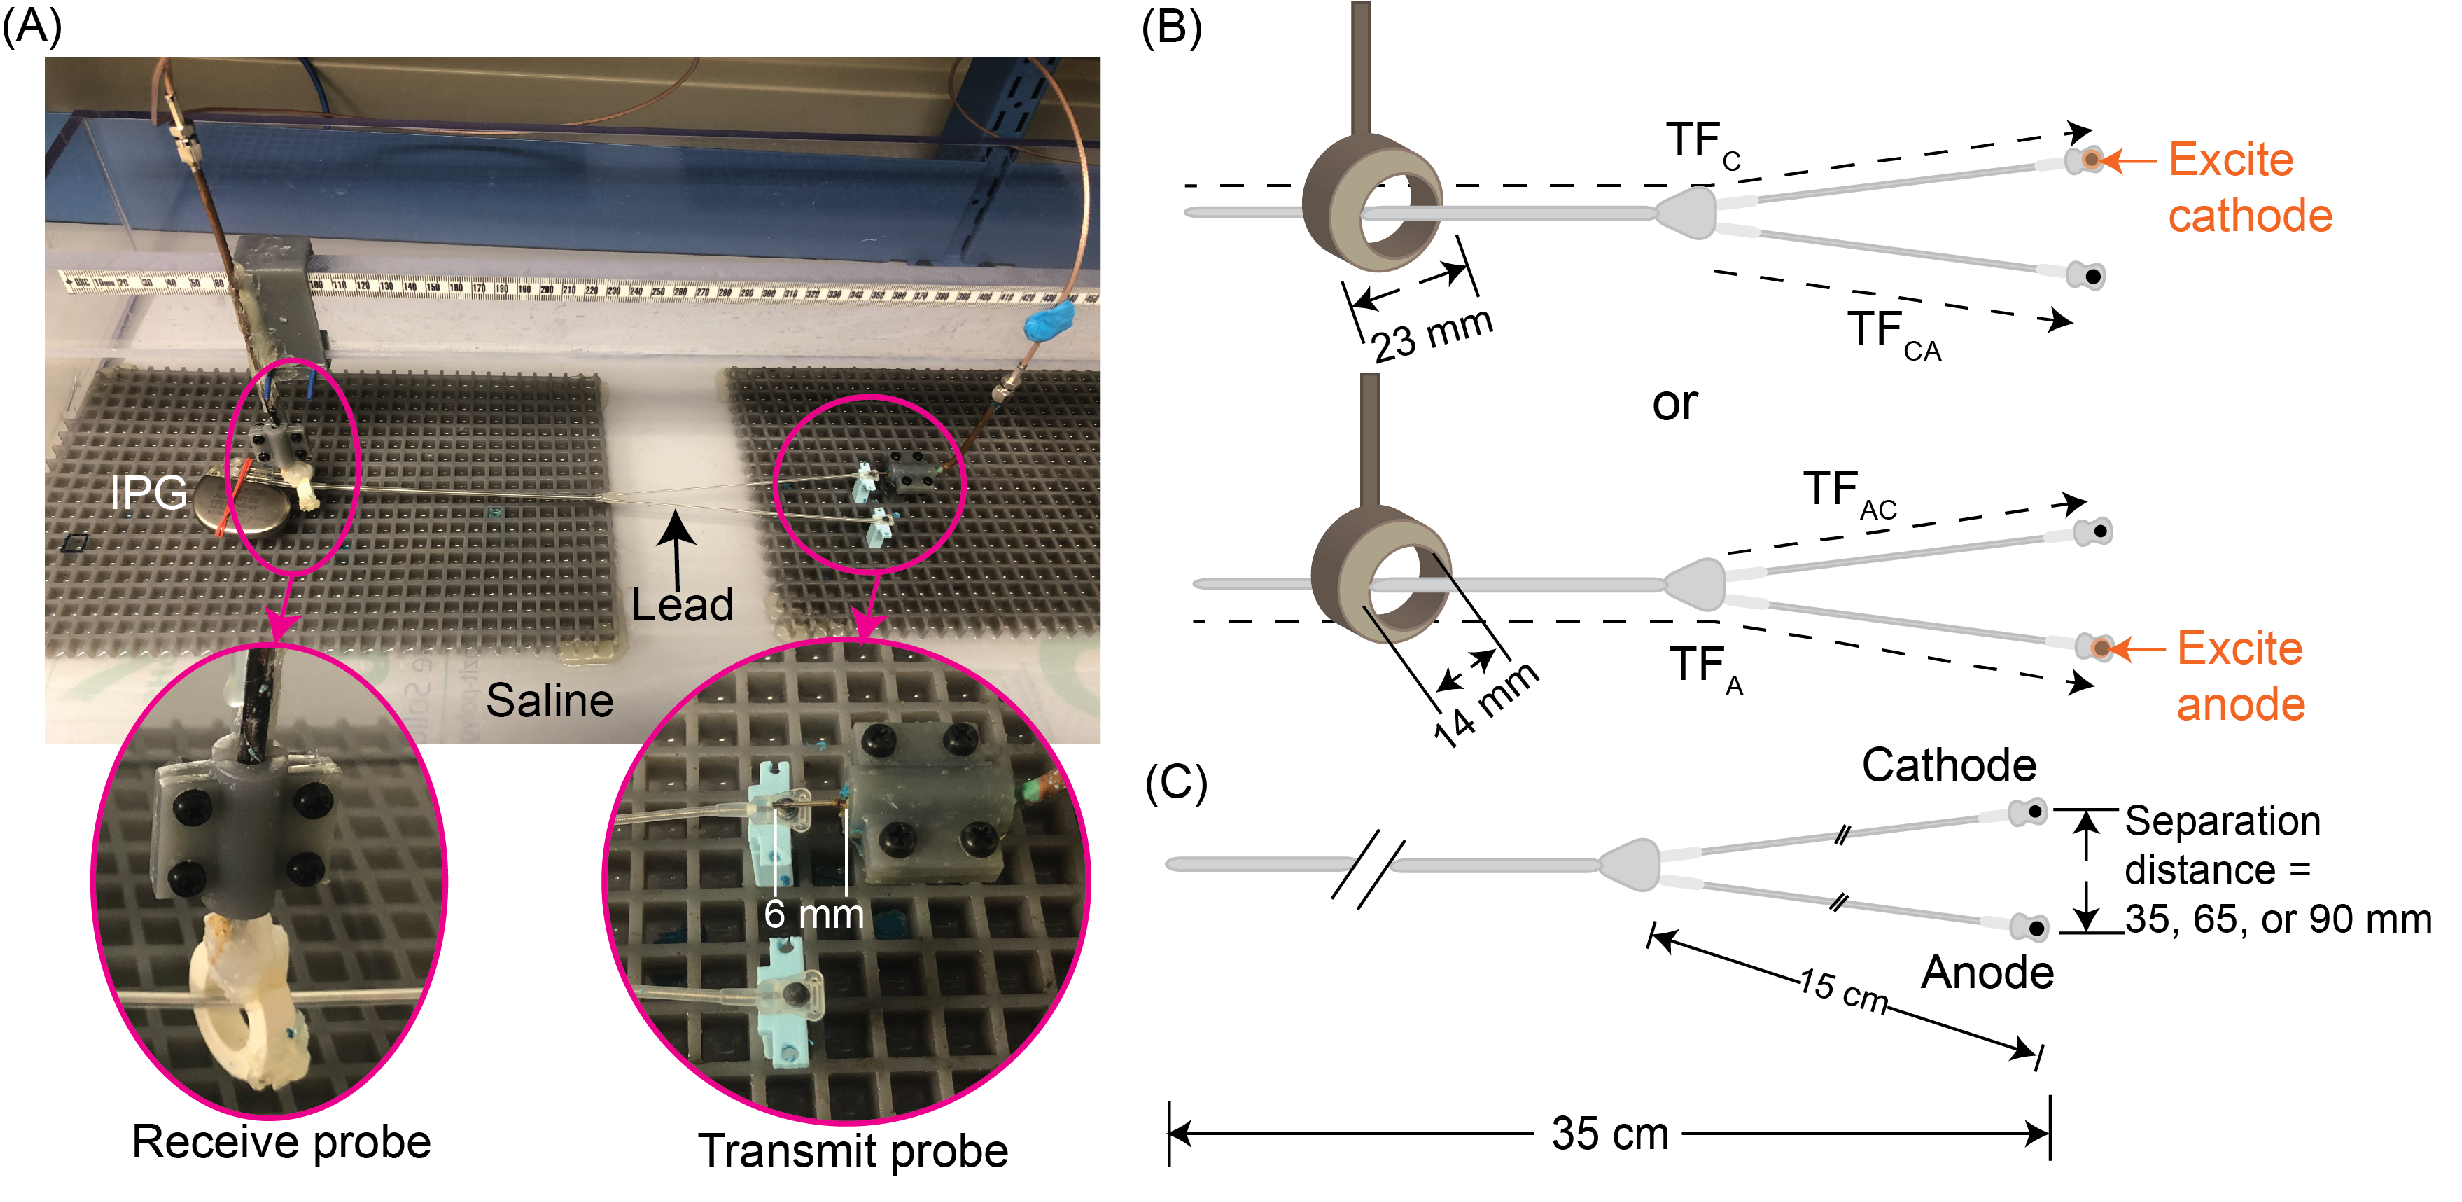
The TF concept was used to model a 35-cm bipolar epicardial lead (Medtronic CapSure® EPI 4968) connected to a Medtronic Azure™ XT DR MRI SureScan implantable pulse generator (IPG). We measured, calibrated, and validated the TFs following Clause 8 of ISO/TS 109743 and determined them based on the reciprocity method6. The transmit probe was constructed using a rg402 semirigid coaxial cable to create a monopole antenna that excited the electrode (Figure 1A)7. The receive probe was constructed from a rg402 semirigid coaxial cable wound around a 4C65 ferrite torus. The probes were connected to a two-port vector network analyzer (VNA 5063, Keysight Technologies) where the complex S-parameter S21 was measured at 5 mm intervals along the lead while submerged in a boxed phantom filled with saline (σ=0.5 S/m, 𝜀r=80).Cumulative transfer function: During excitation of the cathode, the cumulative TF, TFC,total, was measured by adding two terms. First, the transfer function TFC was measured as S21 as the receive probe moved along the lead from the proximal end to the branch leading to the cathode (Figure 1B). Then, the coupling effect due to the presence of the anodal branch was measured as S21 when the receive probe moved along the anodal branch while still exciting the cathode (TFCA). The total temperature increase (ΔT) at the cathode was estimated using the following equation:
$$\triangle T_{C,total} = C \vert \int_{0}^{z=L} TF_{C}(z) E_{tan,C}(z)dz + \int_{z_{1, bifurcation}}^{z_{1}=L} TF_{CA}(z_{1}) E_{tan,CA}(z_{1})dz_{1}\mid^{2}$$
To assess the effect of coupling, this process was repeated three times with different separation distances between the two electrodes: 35, 65, and 90 mm (Figure 1C). The reciprocal was performed during excitation of the anode resulting in 6 total TFs.
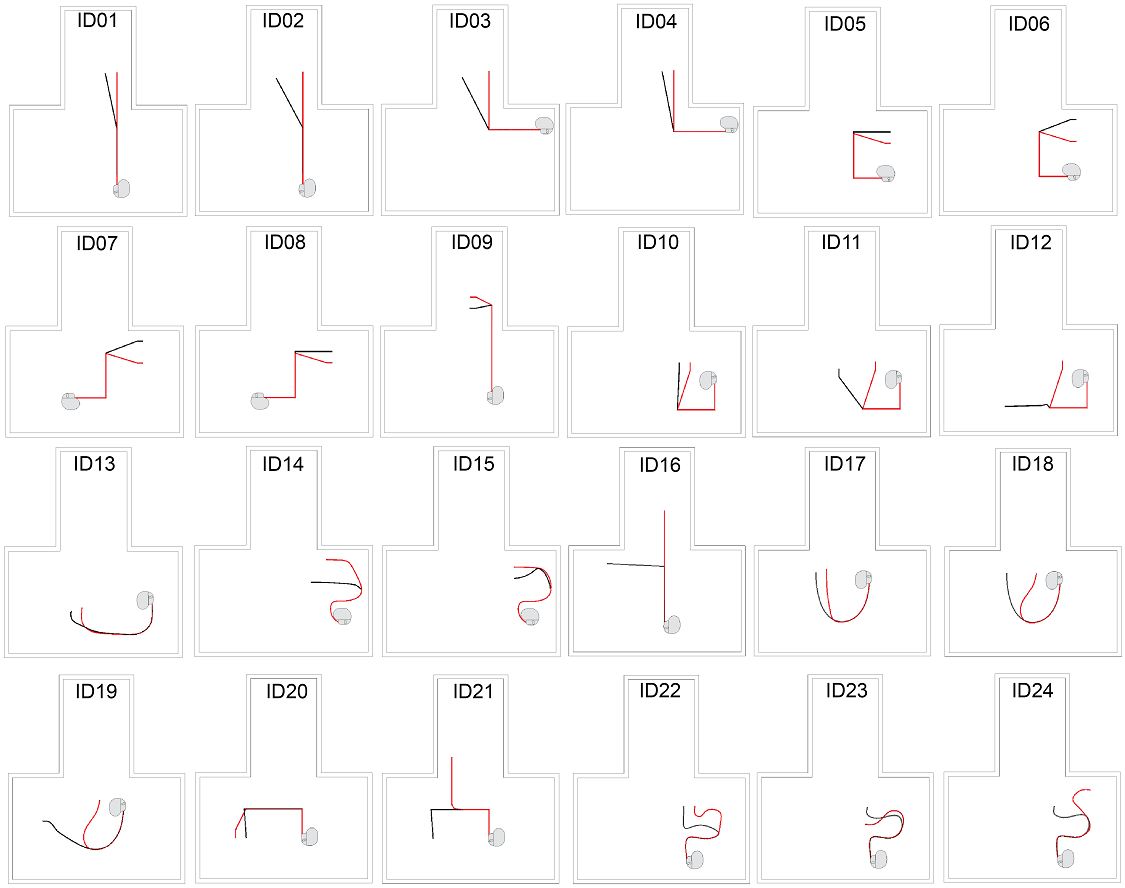
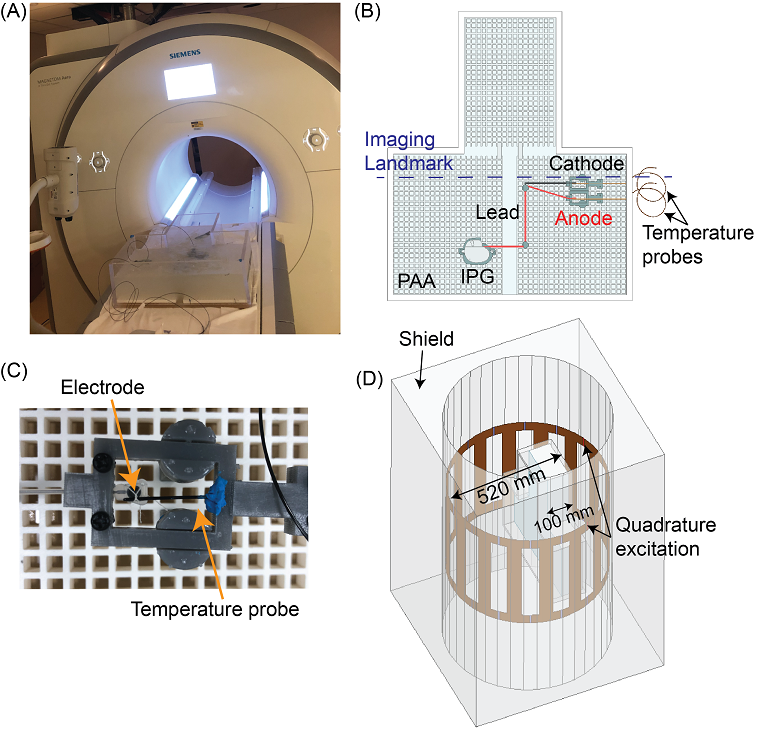
Validation: To calibrate and validate the cumulative TFs, we performed experiments with the CIED in a phantom filled with polyacrylic acid (PAA) gel representing average tissue (σ=0.50 S/m, 𝜀r=88.96). The CIED lead was routed along 24 different configurations amounting to 48 total trajectories (Figure 2). The ΔT was measured in the PAA around the electrodes using fiber optic probes (Osensa) (Figure 3A-C). All experiments were performed in a 1.5T Siemens Aera MRI scanner with RF exposure from a T1-TSE sequence (TE/TR=7.3/897 ms, TA=280 s, FA=133o, B1+rms=4.1µT). Electromagnetic simulations (ANSYS Electronic Desktop 2021 R1 HFSS) were performed to determine the incident electric field distribution inside the phantom (Figure 3D). The complex tangential component of the incident electric field (Etan) was calculated along each trajectory and its corresponding opposing branch. For each TF, the calibration factor, C, was calculated based on the temperature measurement of one arbitrary trajectory. Following calibration, we applied the calibrated TFs to predict RF heating for the remaining trajectories.
Results
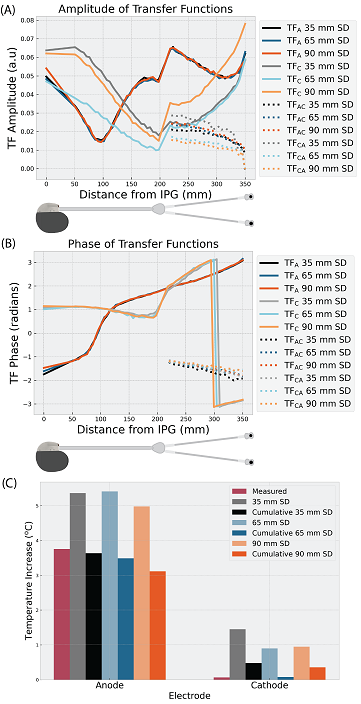
Figure 4 shows the magnitude and phase of the TFs. Figure 5 shows the measured and TF-predicted ΔT at the anode and cathode. The cumulative TFs demonstrated high fidelity in predicting ΔT at both the anode and cathode across separation distances (correlation coefficient, r=0.90-0.97, p<0.05 for all cases). Interestingly, the anodal and cathodal TFs were asymmetrical, indicating the need to measure at least two cumulative TFs to predict RF heating at both electrode ends of a bipolar lead.Discussion
We presented the first results of measured, calibrated, and validated cumulative TFs for predicting RF heating of a CIED with a bipolar epicardial lead. Our results show that the TFs are asymmetrical for predicting RF heating at the anode versus the cathode. There is also a coupling effect between the conductor branches which necessitates the cumulative TF model as the induced current along one branch may be coupled to the other branch as previous studies have suggested4,5. Our results demonstrate good agreement between the experimentally measured and the TF-predicted ΔT across 48 trajectories. Future work includes further investigation of the effect of other separation distances and applying the TFs for predicting RF heating of clinically relevant trajectories in heterogeneous human body models.Acknowledgements
This work was supported by NIH grant R01EB034377.References
1. Balmer C, Gass M, Dave H, et al. Magnetic resonance imaging of patients with epicardial leads: in vitro evaluation of temperature changes at the lead tip. Journal of Interventional Cardiac Electrophysiology 2019;56(3):321-326.
2. Indik JH, Gimbel JR, Abe H, et al. 2017 HRS expert consensus statement on magnetic resonance imaging and radiation exposure in patients with cardiovascular implantable electronic devices. Heart rhythm 2017;14(7):e97-e153.
3. ISO/TS 10974:2018 Assessment of the safety of magnetic resonance imaging for patients with an active implantable medical device. Geneva, Switzerland: International Organization for Standardization; 2018.
4. Kabil J, Felblinger J, Vuissoz PA, et al. Coupled transfer function model for the evaluation of implanted cables safety in MRI. Magn Reson Med. 2020;84:991-999.
5. Hu W, Guo R, Wang Q, et al. RF-induced heating for active implantable medical devices in dual parallel leads configurations at 1.5 T MRI. Magn Reson Med. 2023;90:686-698.
6. Feng S, Qiang R, Kainz W, et al. A technique to evaluate MRI-induced electric fields at the ends of practical implanted lead. IEEE Trans Microw Theory Tech. 2015;63:305–313.
7. Jiang F, Bhusal B, Nguyen B, et al. Modifying the trajectory of epicardial leads can substantially reduce MRI-induced RF heating in pediatric patients with a cardiac implantable electronic device at 1.5T.Magn Reson Med. 2023;90:2510-2523.
Figures