1204
Generic and Robust Quantitative MRI Parameter Estimation using Neural Controlled Differential Equations1Radiology & Nuclear Medicine, Amsterdam University Medical Centers location University of Amsterdam, Amsterdam, Netherlands, 2Imaging and Biomarkers, Cancer Center Amsterdam, Amsterdam, Netherlands, 3Centre for Big Data Research in Health, University of New South Wales Sydney, Sydney, Australia, 4Department of Radiology, C.J. Gorter MRI Center, Leiden University Medical Center, Leiden, Netherlands
Synopsis
Keywords: Analysis/Processing, Quantitative Imaging
Motivation: Tissue properties are estimated from MRI data using bio-physical models that relate MRI signal to underlying tissue properties via quantitative MRI parameters. Deep learning can improve parameter estimation, but needs retraining for different acquisition protocols, hindering implementation.
Goal(s): Implement a deep learning algorithm able to estimate quantitative MRI parameters for multiple quantitative MRI applications, irrespective of acquisition protocol.
Approach: Neural controlled differential equations (NCDEs) overcome this limitation as they are independent of the configuration of input data.
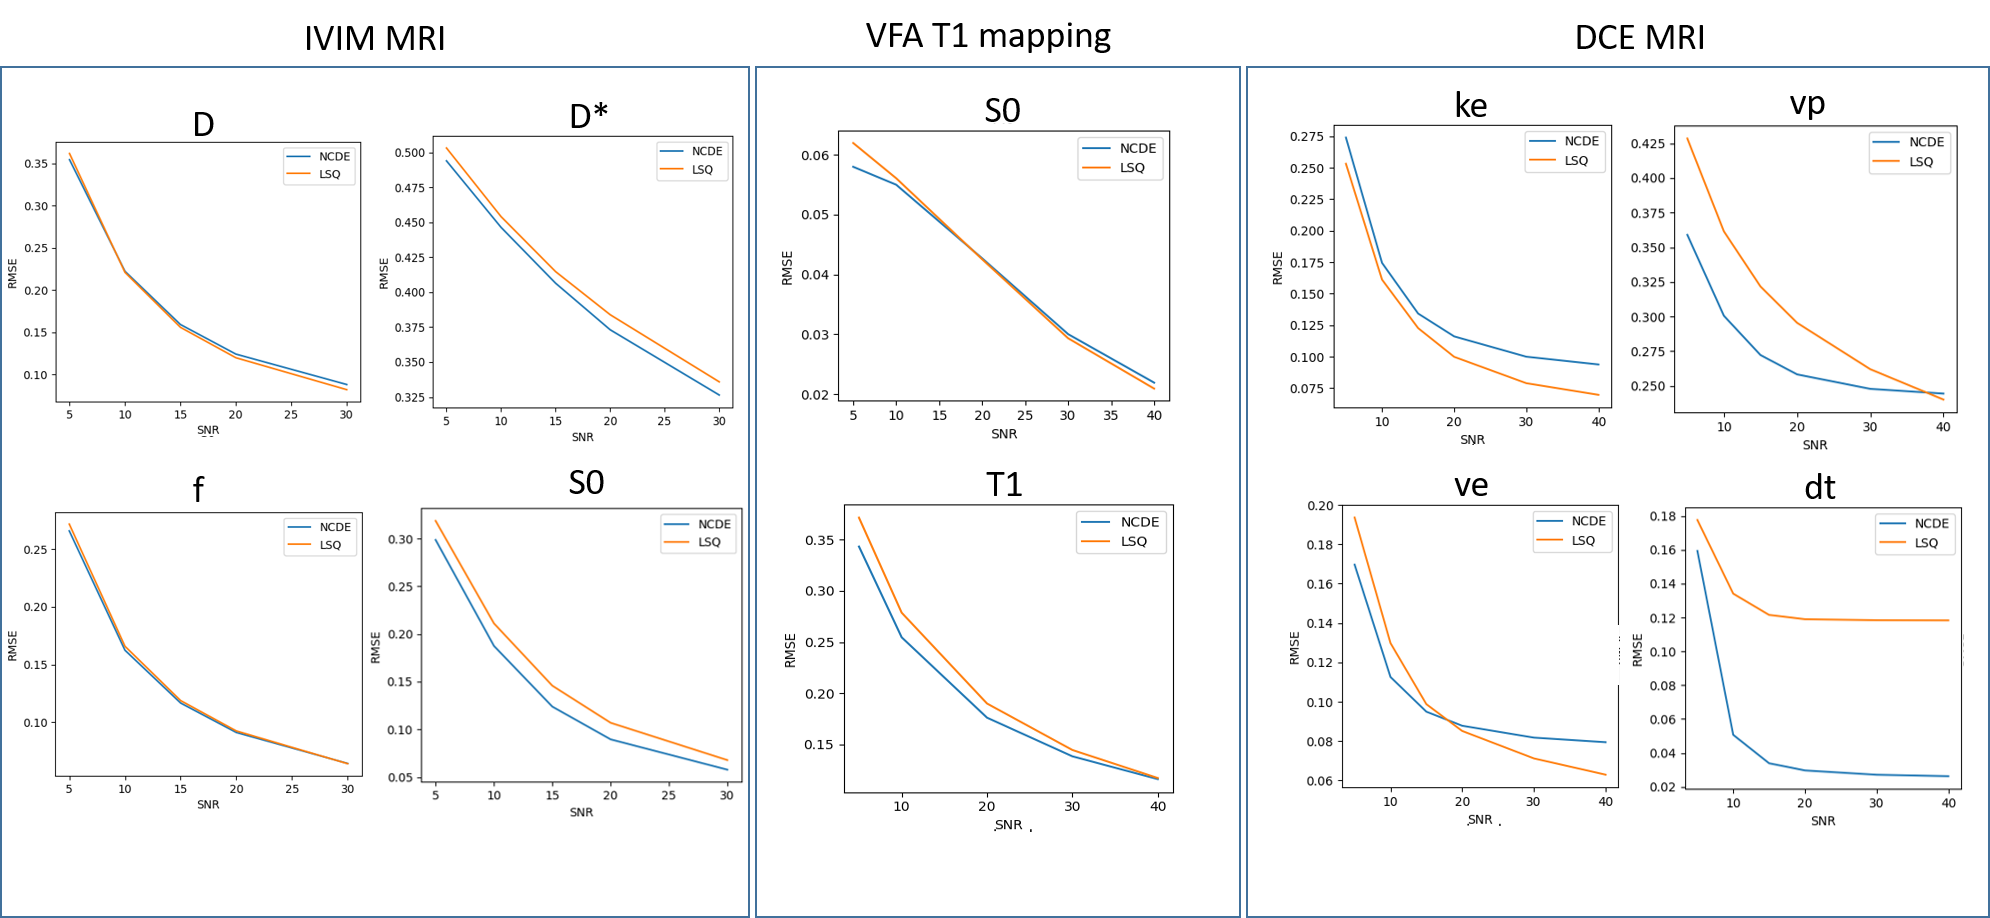
Results: NCDEs have improved performance compared to least squares minimization in estimating quantitative MRI parameters when SNR is low or when the parameter has low sensitivity.
Impact: Neural controlled differential equations are a generic purpose tool for parameter estimation in quantitative MRI that outperform least squares minimization in quantitative MRI parameter estimation, irrespective of acquisition protocol or quantitative MRI application.
Introduction
In quantitative MRI, tissue properties are estimated from MRI data using bio-physical models that relate the MRI signal to the underlying tissue properties via model parameters. Conventionally, such parameter estimation is done using least squares fitting to images with different contrast weightings. However, least squares fitting is strongly affected by imaging noise, either overfitting to the noise, or ending up in local minima. Moreover, parameters with low sensitivity are estimated with poor accuracy. Deep learning for estimating quantitative MRI parameter maps has the potential to be more robust to noise and thus improve the accuracy1-4. These conventional deep learning implementations are not robust to acquisition setting changes, as they are dependent on the input being either a fixed set of input signals (fully connected networks) or a series of regularly sampled signals (recurrent neural networks). Our group was the first to overcome this by using Neural Controlled Differential Equations5,6 for intravoxel incoherent motion (IVIM) MRI7. Here, we implement NCDEs as a generic tool for quantitative MRI parameter estimation. We show its performance on simulated data for IVIM MRI, extended Tofts-Kety dynamic contrast enhanced (DCE) MRI and variable flip angle (VFA) T1-mapping. We further show its performance on in-vivo data for IVIM MRI.Methods
1. Quantitative MRIQuantitative MRI models allow us to assess tissue properties by using biophysical models to describe the MRI signal intensity as a function of a changing variable, e.g. diffusion weighting (b) in IVIM, flip angle (FA) in VFA and time (t) in DCE.
In IVIM MRI, the signal intensity at diffusion weighting $$$b$$$ depends on the diffusion coefficient ($$$D$$$), pseudo diffusion coefficient ($$$D^{*}$$$), perfusion fraction ($$$f$$$) and baseline signal intensity ($$$S0$$$):
$$S(b)=S0((1-f)e^{-bD}+fe^{-bD*})\hspace{10mm}(1)$$
In VFA T1 mapping, the signal intensity at flip angle $$$FA$$$ depends on the longitudinal relaxation time ($$$T1$$$) and signal at maximal longitudinal magnetization ($$$S0$$$):
$$S(FA)=S_{0}\frac{1-e^{\frac{-TR}{T1}}}{1-cos(FA)e^{\frac{-TR}{T1}}}sin(FA)\hspace{10mm}(2)$$
In DCE MRI, the concentration of gadolinium in tissue ($$$C_{t}$$$), at timepoint $$$t$$$ depends on the gadolinium reflux rate ($$$k_{e}$$$), fractional volume of extravascular extracellular space ($$$v_{e}$$$), fractional volume of plasma ($$$v_{p}$$$) and bolus arrival time $$$d\tau$$$:
$$C_{t}(t)=v_{p}C_{p}(t)+k_{e}v_{e}\int{}C_{p}(\tau)e^{-k_{e}(t-\tau)}d\tau\hspace{10mm}(3)$$
2. NCDE model
We trained an NCDE (figure 1) to map the input sequence to an output vector $$$y$$$ [6]. $$$y$$$ contains the coefficients to compute parameters, i.e. for $$$D$$$:
$$D=D_{min}+sigmoid(y[1])(D_{max}-D_{min})\hspace{10mm}(4)$$
Based on the predicted model parameters together with the set of measured values on the x-axis, a signal decay curve $$$S_{pred}$$$ is predicted according to (1-3).
For each quantitative MRI model, a dedicated NCDE is trained by minimizing a physics-informed loss2, comparing the input signal ($$$S_{input}$$$) intensities to ($$$S_{pred}$$$), following:
$$L=\frac{1}{len(S_{input})}\Sigma(S_{input}-S_{pred})^{2}\hspace{10mm}(5)$$
3. Simulations
Per model training, 1,000,000 signal decay curves were simulated based on the respective IVIM, VFA and DCE model as in (1-3) from uniformly sampled combinations of parameters, the ranges of parameter values are described in table 1. Rician noise was added to the generated signal decay curves to make the signal-to-noise ratio (SNR) uniformly distributed between 5 and 50. The signal decay curves were used to train the NCDE model using the loss in (5).
Similarly, 100,000 signal decay curves were generated for evaluation of the NCDE model and non-linear least squares fitting. Performance was measured using parameter-specific normalized root mean square error (nRMSE) as a function of SNR.
4. In-vivo data
In-vivo IVIM data (Table 2) from 7 healthy volunteers are used for training of the NCDE and evaluation of the NCDE and least squares fitting. In 10 healthy volunteers, the NCDE estimation was visually compared to least squares.
Results
1. SimulationsFor high-sensitivity parameters (e.g. $$$D,f,k_{e},v_{e}$$$), the NCDE could infer QMRI parameters from variable length signal decay curves with similar accuracy as least squares minimization. For low-sensitivity parameters (e.g. $$$D^{*},d\tau,v_{p}$$$) and when SNR is low, the NCDEs improved over least squares minimization (Figure 2).
2. In-vivo data
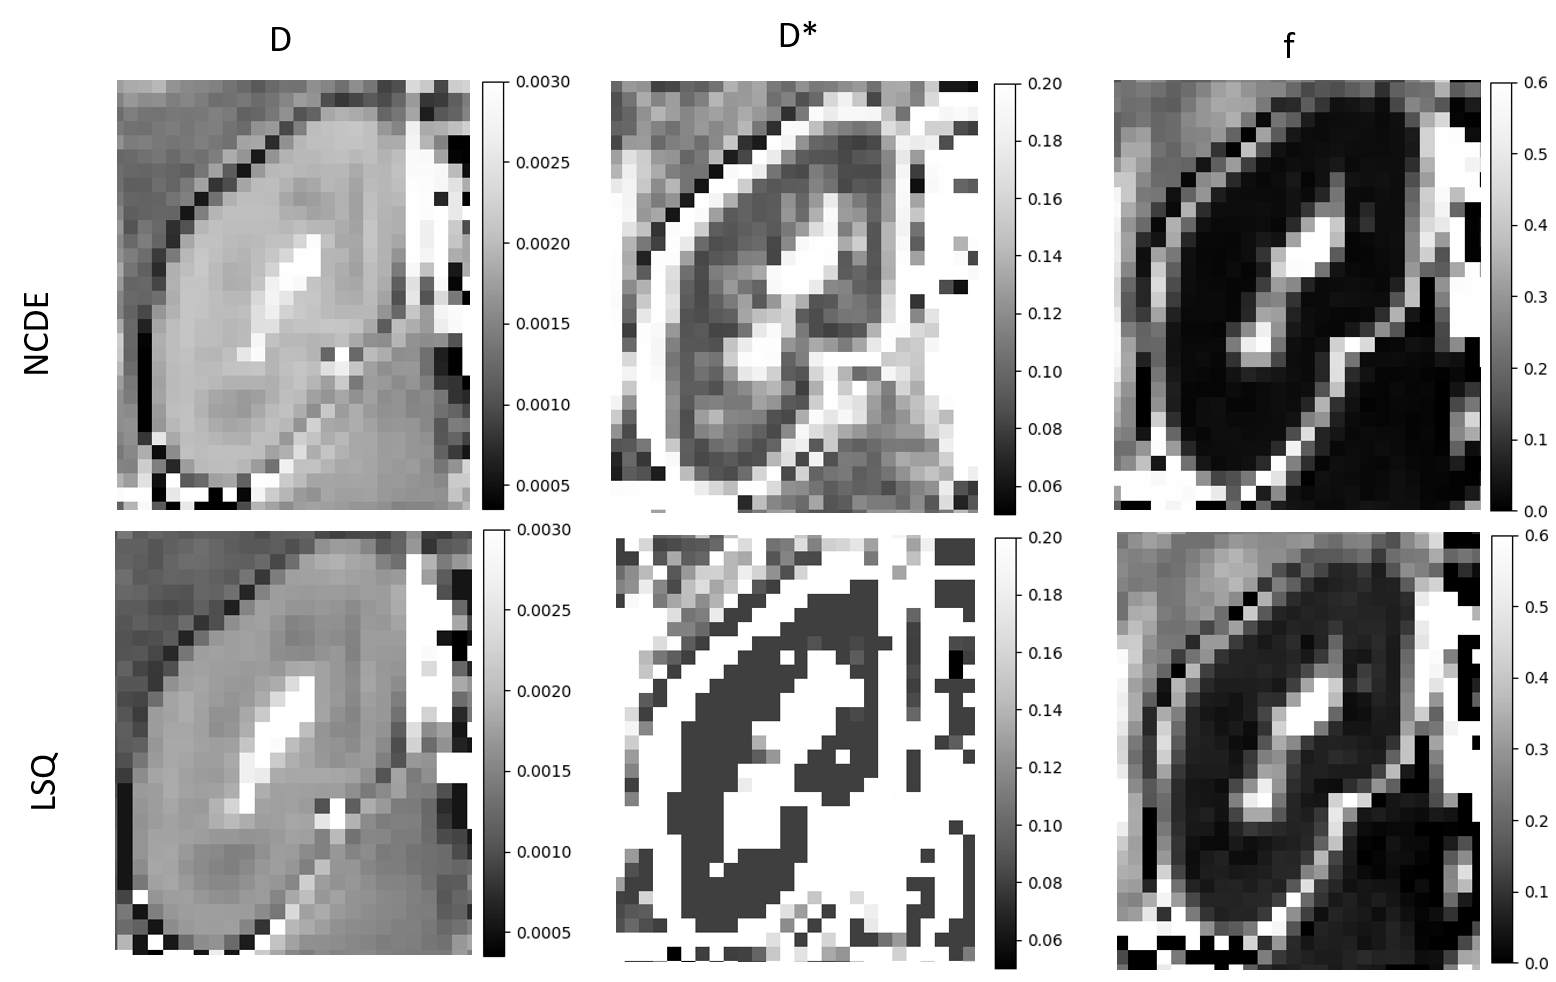
For high-sensitivity parameters (e.g. $$$D$$$), the NCDE estimates parameter maps which are very similar to the LSQ. For low-sensitivity parameters, the NCDE estimates less polarized parameter maps than least squares estimation (figure 3).
Discussion
We are the first to demonstrate the applicability of NCDEs as a generic tool for quantitative MRI parameter estimation by showing that NCDEs have comparable or improved performance to least squares minimization. NCDEs can improve parameter estimation under conditions of higher uncertainty (e.g. low SNR, low-sensitivity parameters).Conclusion
NCDEs can be used as a generic tool for quantitative MRI parameter estimation. NCDEs outperform least squares fitting when SNR is low and in low-sensitivity parameters.Acknowledgements
This work was funded by the KWF Dutch Cancer Society (KWF-UVA 2021.13785, OG-C and DK), the Cancer Center Amsterdam (CCA 2020-7-01, OG-C) and the Swiss National Science Foundation (32003B_176229/1, SB).
References
| [1] O. Gurney-Champion, G. Landry, K. Redalen and D. Thorwarth, "Potential of Deep Learning in Quantitative Magnetic Resonance Imaging for Personalized Radiotherapy," Seminars in Radiation Oncology, pp. 377-388, 2022. |
| [2] S. Barbieri, O. Gurney-Champion, R. Klaassen and H. Thoeny, "Deep learning how to fit an intravoxel incoherent motion model to diffusion-weighted MRI," Magnetic Resonance in Medicine, p. 312– 321, 2020. |
| [3] M. Kaandorp, B. S., R. Klaassen, H. van Laarhoven, H. Crezee, P. T. While, A. Nederveen and O. Gurney-Champion, "Improved unsupervised physics-informed deep learning for intravoxel incoherent motion modeling and evaluation in pancreatic cancer patients," Magnetic Resonance in Medicine, pp. 2250-2265, 2021. |
| [4] T. Ottens, S. Barbieri, M. Orton, R. Klaassen, H. van Laarhoven, H. N. A. Crezee, X. Zhen and O. Gurney-Champion, "Deep learning DCE-MRI parameter estimation: Application in pancreatic cancer.," Medical Image Analysis, 2022. |
| [5] R. Chen, Y. Rubanova, J. Bettencourt and D. Duvenaud, "Neural Ordinary Differential Equations," in Proceedings of the 32nd International Conference on Neural Information Processing Systems, Montreal, Canada, 2018. |
| [6] P. Kidger, J. Morrill, J. Foster and T. Lyons, "Neural Controlled Differential Equations for Irregular Time Series," in Advances in Neural Information Processing Systems, 2020. [7] D. Kuppens, D. van den Berg, S.Barbieri, A. Nederveen and O. Gurney-Champion, “Quantitative MRI Parameter Estimation using Neural Controlled Differential Equations: a Proof-of-Concept in Intravoxel Incoherent Motion MRI,” in Proceedings of the ISMRM Annual Meeting [abstract], 2024 |
Figures
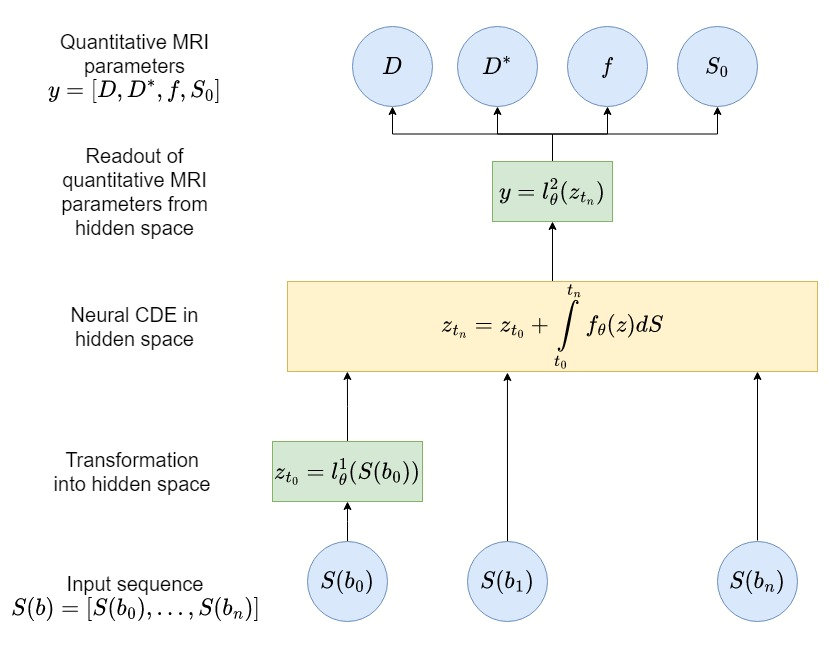
Figure 1: NCDEs learn a map from sequence $$$S$$$ to output $$$y$$$, by learning a neural network, $$$l_{\phi}^{1}$$$, mapping the input to the hidden space, $$$z$$$, as well as a neural network, $$$f_{\phi}$$$, that approximates the differential equation of the hidden space over the sequence, followed by a neural network, $$$l_{\phi}^{2}$$$, that maps the hidden space state to the output. The state of the hidden space at point is obtained by solving the controlled $$$f_{\phi}$$$ over the distance between $$$t$$$ and $$$t_{0}$$$.
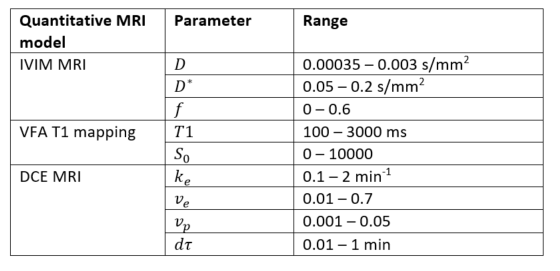
Table 1: description of parameter ranges used in the simulation of data, as well as in the training and evaluation phase. $$$S0$$$ in IVIM MRI does not have a range assigned to it because during simulation it is 1 by definition.
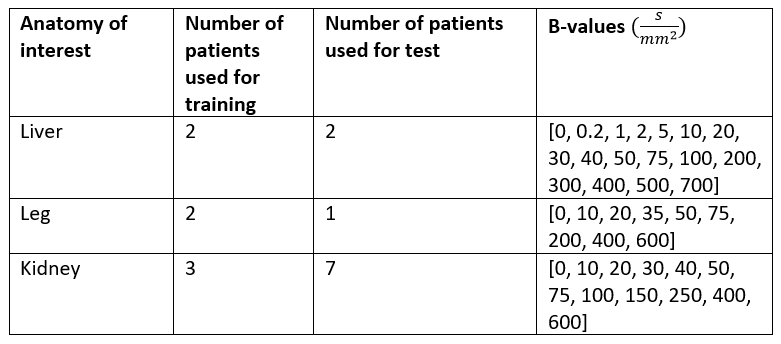
Table 2: description per study of in-vivo data used for training of the NCDE model and evaluation of the NCDE model and least squares fitting. Data originated from different studies performed in our center, all acquired on a Philips Achieva 3.0T.