1201
Graph kernel assisted robust individual and group level functional brain parcellation (GRAFP)1Department of Radiology, Children's Hospital of Philadelphia, Philadelphia, PA, United States, 2Department of Bioengineering, University of Pennsylvania, Philadelphia, PA, United States, 3Department of Radiology, University of Pennsylvania, Philadelphia, PA, United States, 4School of Electronic Information and Communications, Huazhong University of Science and Technology, Wuhan, China
Synopsis
Keywords: Analysis/Processing, fMRI (resting state), Functional Connectivity, Graph Kernel, Brain connectivity, Signal Modeling, Signal Representations
Motivation: Various rs-fMRI studies highlight the need for accurate delineation of different brain functional networks (FNs) to carry out precise therapeutic interventions in the individuals.
Goal(s): To develop a novel zero-shot non-linear graph kernel-assisted approach for enhanced functional brain parcellation at individual and group levels.
Approach: Utilization of Wavelet, Fourier, and Hilbert transformations for feature extraction from BOLD signals, and a propagation attribute graph kernel to capture non-linear temporo-spatial connectivity, using k-means clustering.
Results: The kernel-based approach outperforms static FC matrix parcellations, achieving higher accuracy in network delineation in both individual and group level, as evidenced by Dice and Jaccard scores.
Impact: The study introduced graph kernel-based method for functional brain parcellation, which improved the accuracy of functional network delineation in rs-fMRI data, surpassing traditional static functional connectivity approaches in both individual and group level, as validated by Dice and Jaccard metrics.
Introduction
Resting-state functional MRI (rs-fMRI) studies reveal that spontaneous low-frequency fluctuations in the blood oxygen level-dependent (BOLD) signals exhibit organized temporal correlations across functionally related brain regions1,2. The temporal correlation of the BOLD signals is essential for characterizing the intrinsic brain functional networks3–5. Understanding the distinct variability among the parcellated cortical regions from healthy brains and differences in the parcellated cortical regions across different individuals in diseased brains can facilitate tailored and precise therapeutic interventions6–8.With the advances in graph theory, there have been various algorithms developed for the brain parcellation using averaged static functional connectivity (static fc), with RNcut being one of the best for delineating brain functional regions9–12. However, the aforementioned methods formulate the connectivity as a linear correlation, which does not capture the non-linearity in the temporo-spatial connectivity13. To address this challenge, we developed a novel zero-shot non-linear graph kernel assisted approach to extract features from the BOLD raw signals and perform functional brain parcellation both at individual and group level.Materials and Methods
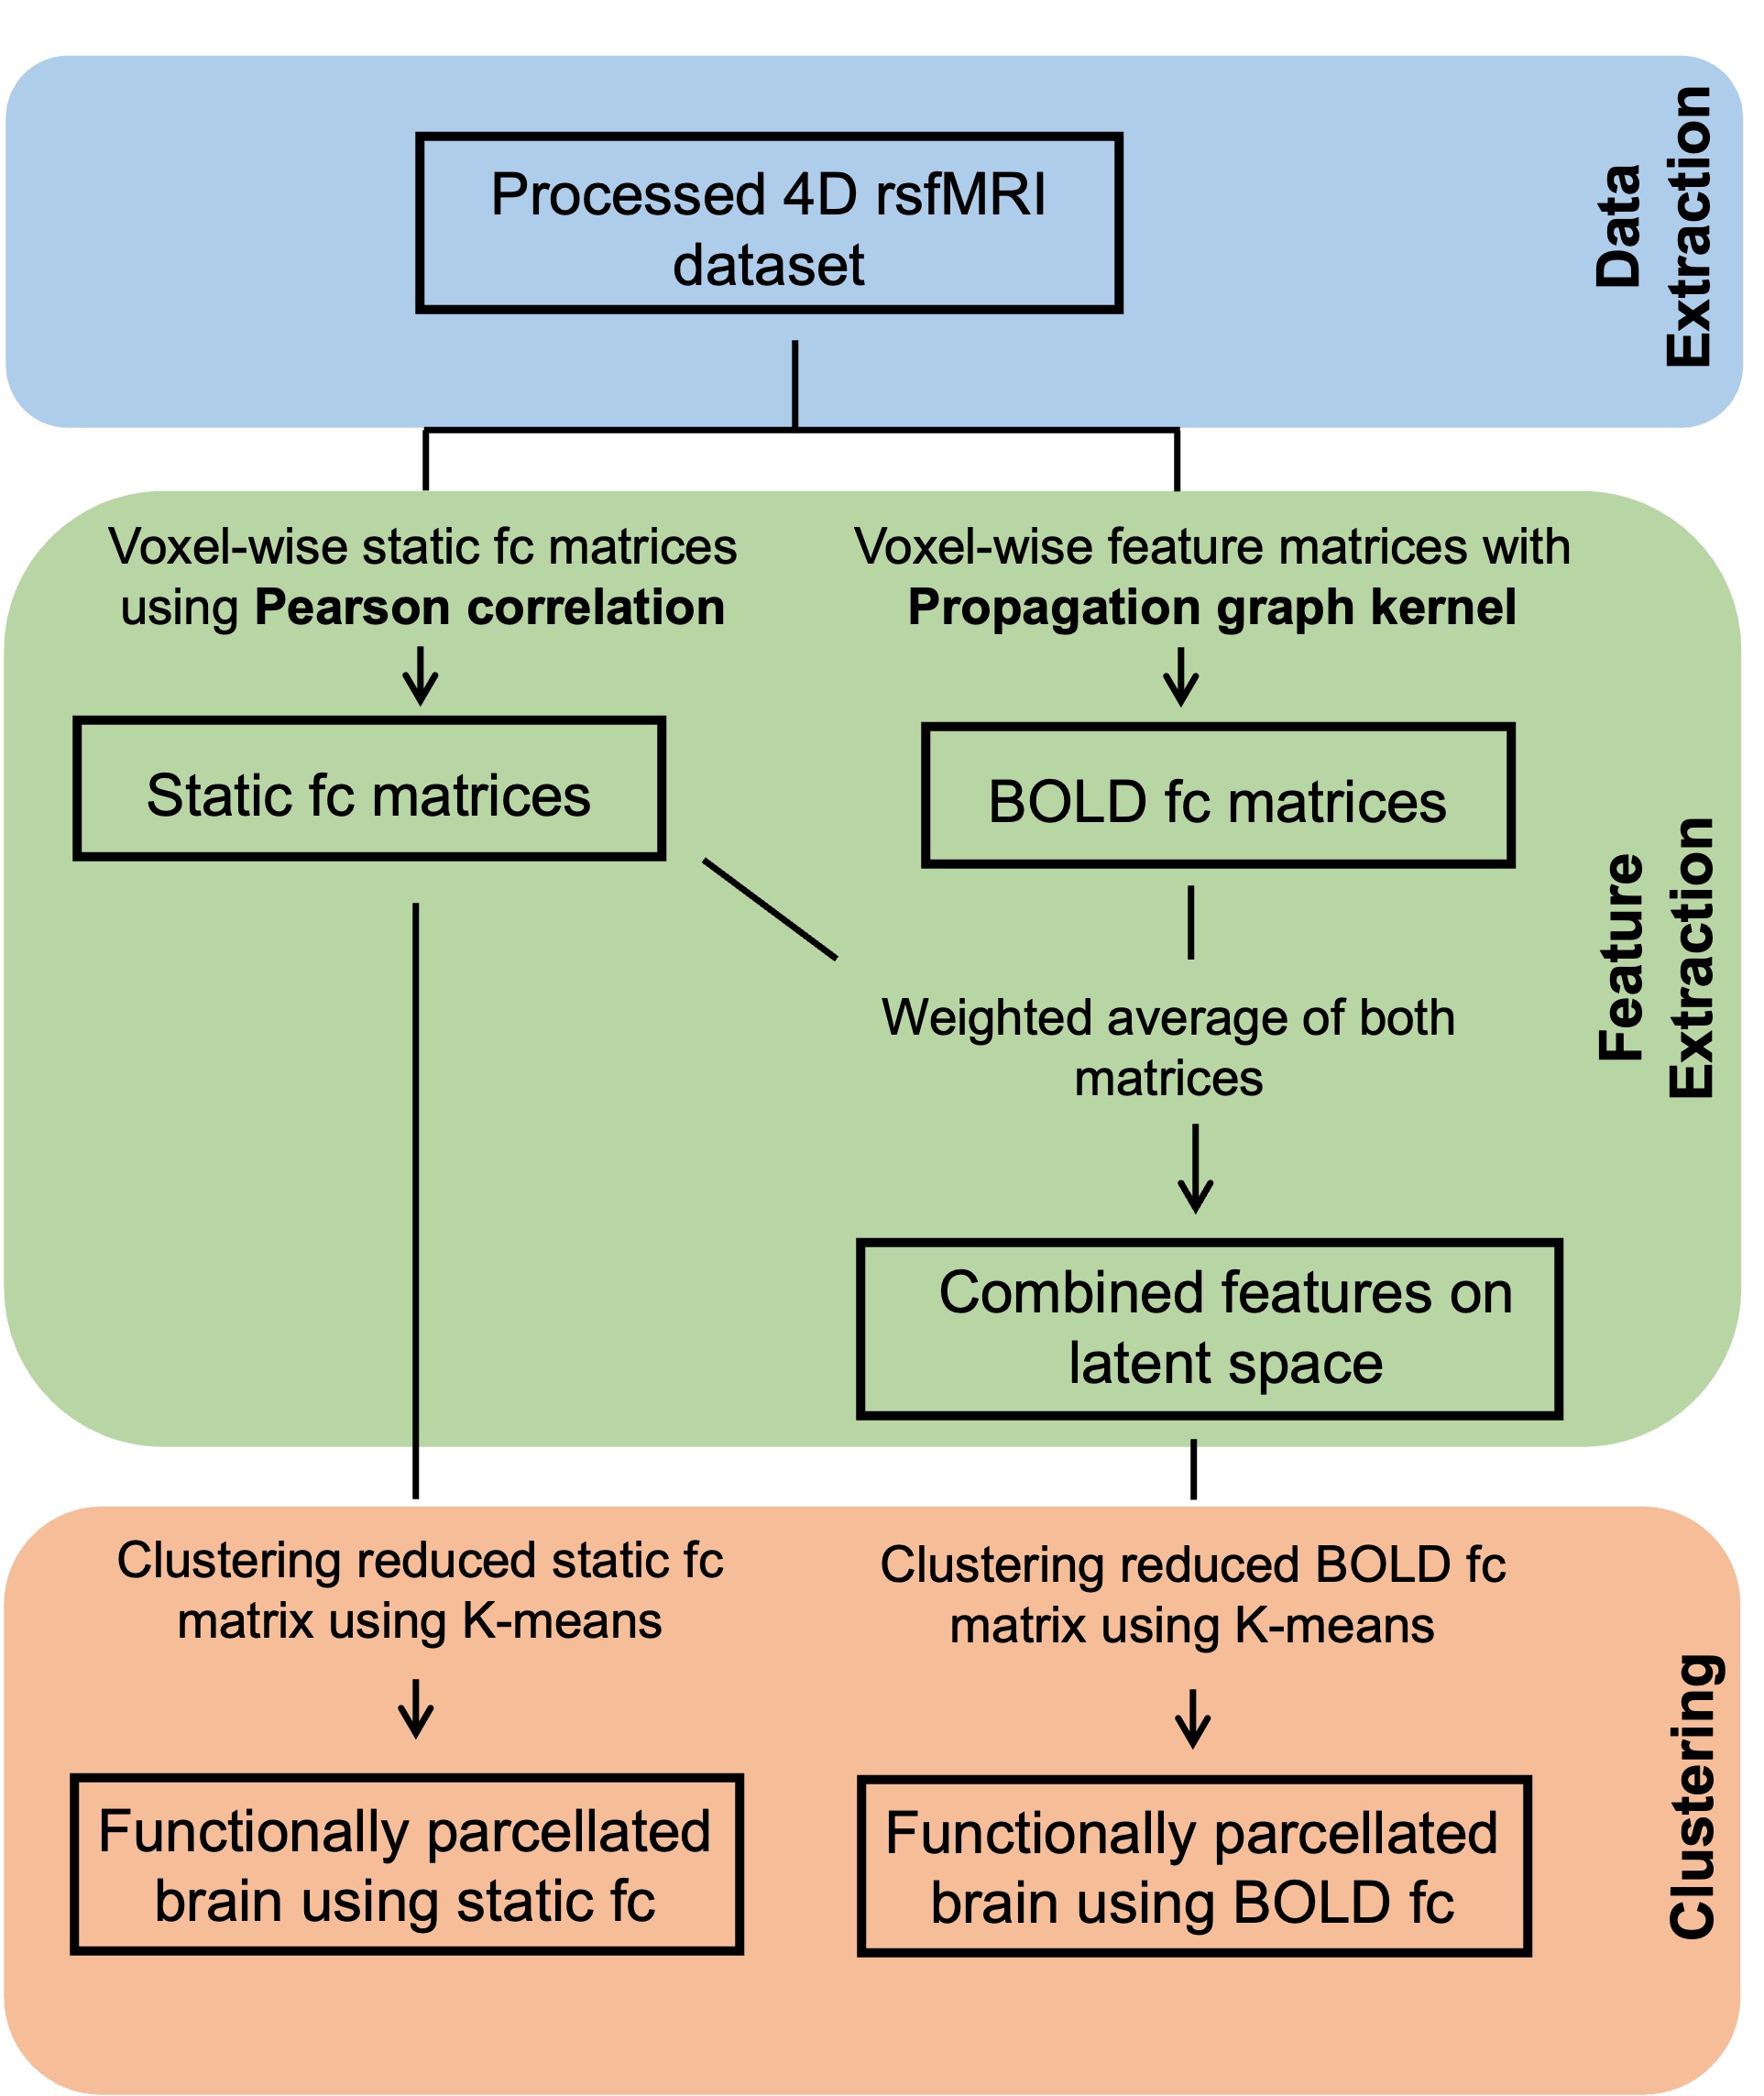
Fig. 1 shows a schematic representation of the entire flowchart.Subject Information
The dataset comprised of 100 participants from the preprocessed HCP Young Adult database (53M/47F and ages at scan: 22-35 years) with each individual contributing two scans resulting in a total of 200 scans14.
Post-processing of acquired data
Each scan was downsampled to the fsaverage4 surface atlas to expedite the estimation of kernel matrices, utilizing commands from the Connectome Workbench toolkit15. This resulted in 2562 voxels for each hemisphere, summing up to 5162 voxels.
Feature extraction from BOLD raw signals
For each voxel, a multi-faceted representation of the signal's temporal and spatial characteristics with thirty-five features was generated using Wavelet, Fourier, and Hilbert transformations. Wavelet features provide a multilevel decomposition of the signal which captures both the frequency and location in time of different signal components16. Fourier features represent the frequency domain characteristics of the signal that helps understanding the signal’s spectral density across different time points17. Hilbert features characterize the signal's amplitude envelope and instantaneous phase, thus enabling the capture of the signal's temporal evolution18. Along with that, the static fc was also calculated using the Pearson correlation.
Propagation attribute based kernel matrix
To construct the kernel matrix, we first represented each voxel, excluding those within the medial wall region, as a separate graph which was populated with thirty-five features from the BOLD raw signals, resulting in 4674 graphs. The equation below represents the voxel to node mapping:
$$ g_i(n_i) = F_i $$
where $$$ g_i $$$ indicates to graph, the node $$$ n_i $$$ is associated with a feature set $$$ F_i $$$ containing thirty-five features.
Subsequently, we employed the propagation attribute graph kernel that iteratively updates the attributes of each graph based on its neighbors, thereby capturing the connectivity patterns within the brain19. This kernel effectively captures the topological resemblances between voxels by minimizing the total variance within the graph structures. After a number of iterations, tmax (200), the refined attributes are used to calculate a similarity kernel matrix K through a dot product. This matrix is unique to each of the 200 individual cerebral scans and facilitates the subsequent clustering process. The mathematical formulation of the propagation attribute graph kernel that we applied is as follows:
$$ K_{i j}=\left\langle X_i^{\left(t_{\max }\right)}, X_j^{\left(t_{\max }\right)}\right\rangle $$
where, $$$ X^{(t+1)}=\arg \min \left\{T V(X)+\frac{1}{2 w} \sum_{v \in G}\left\|x_v-x_v^{(t)}\right\|_2^2\right\} $$$
Clustering algorithm
For clustering, we have employed k-means to showcase the robustness and preciseness of the kernel-guided delineation of functional networks at individual and group level analyses.
Results
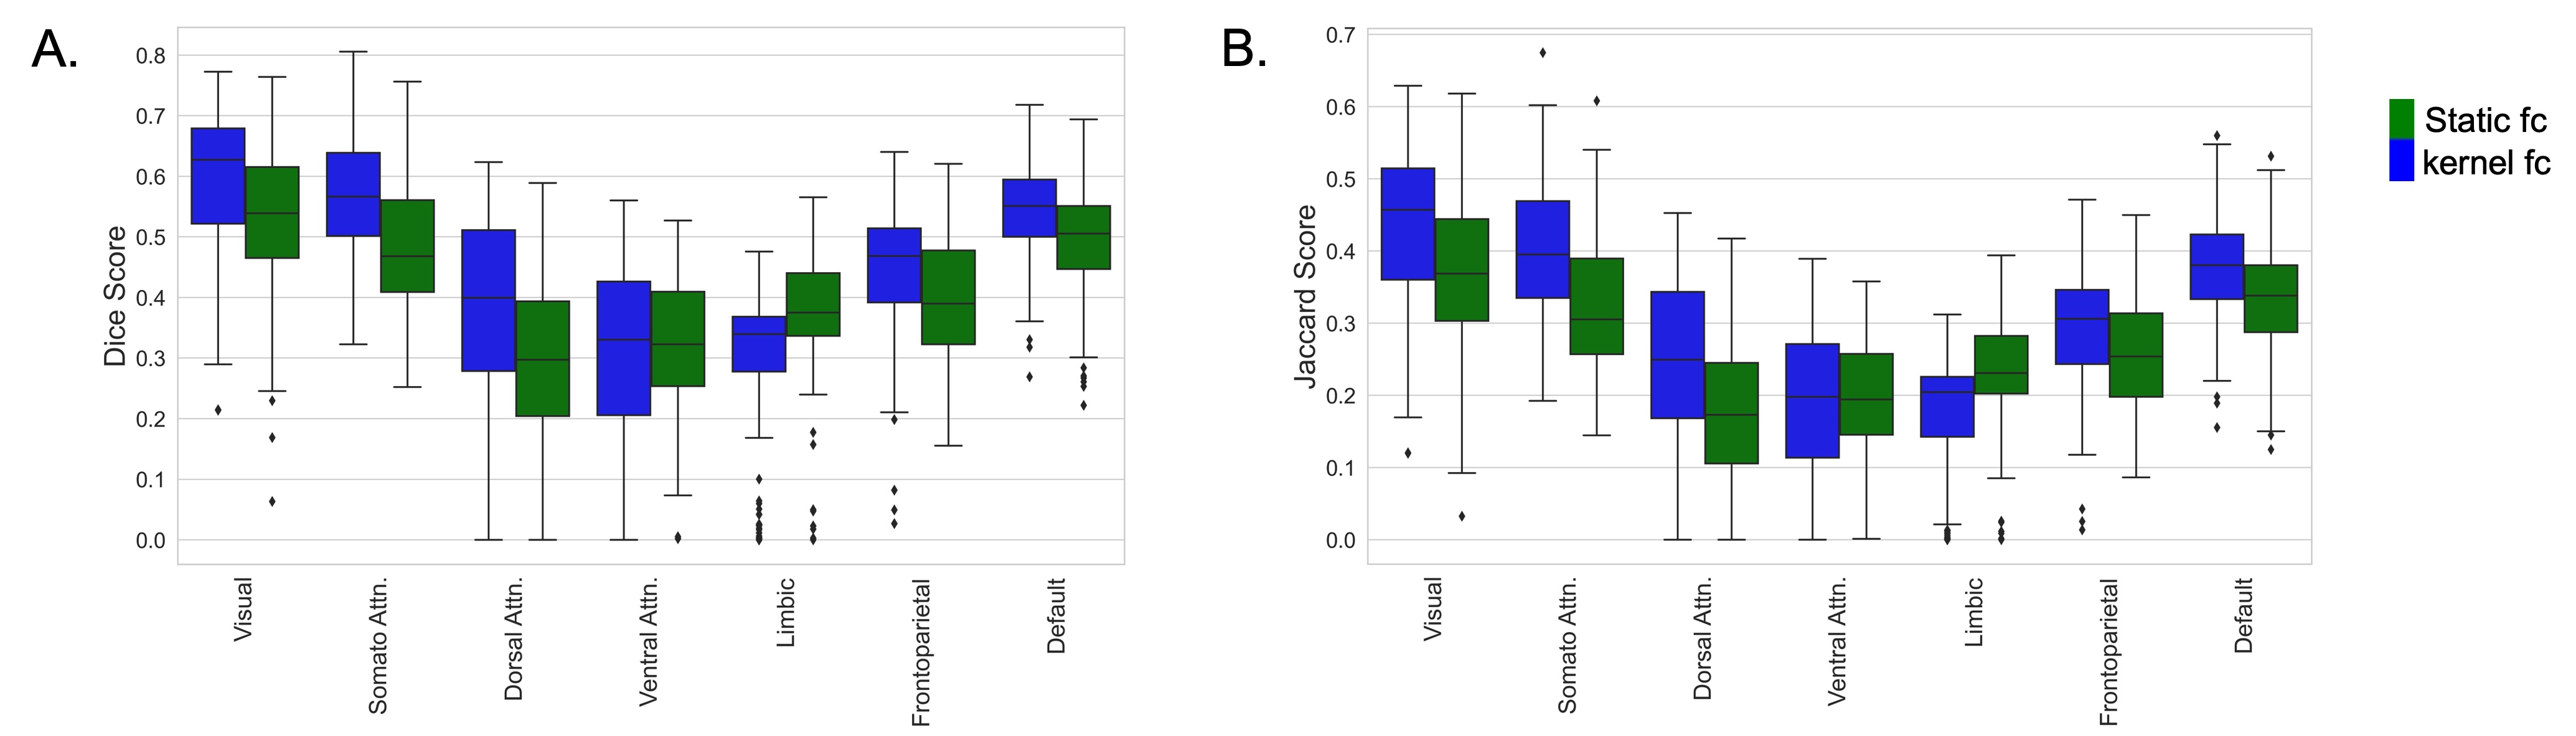
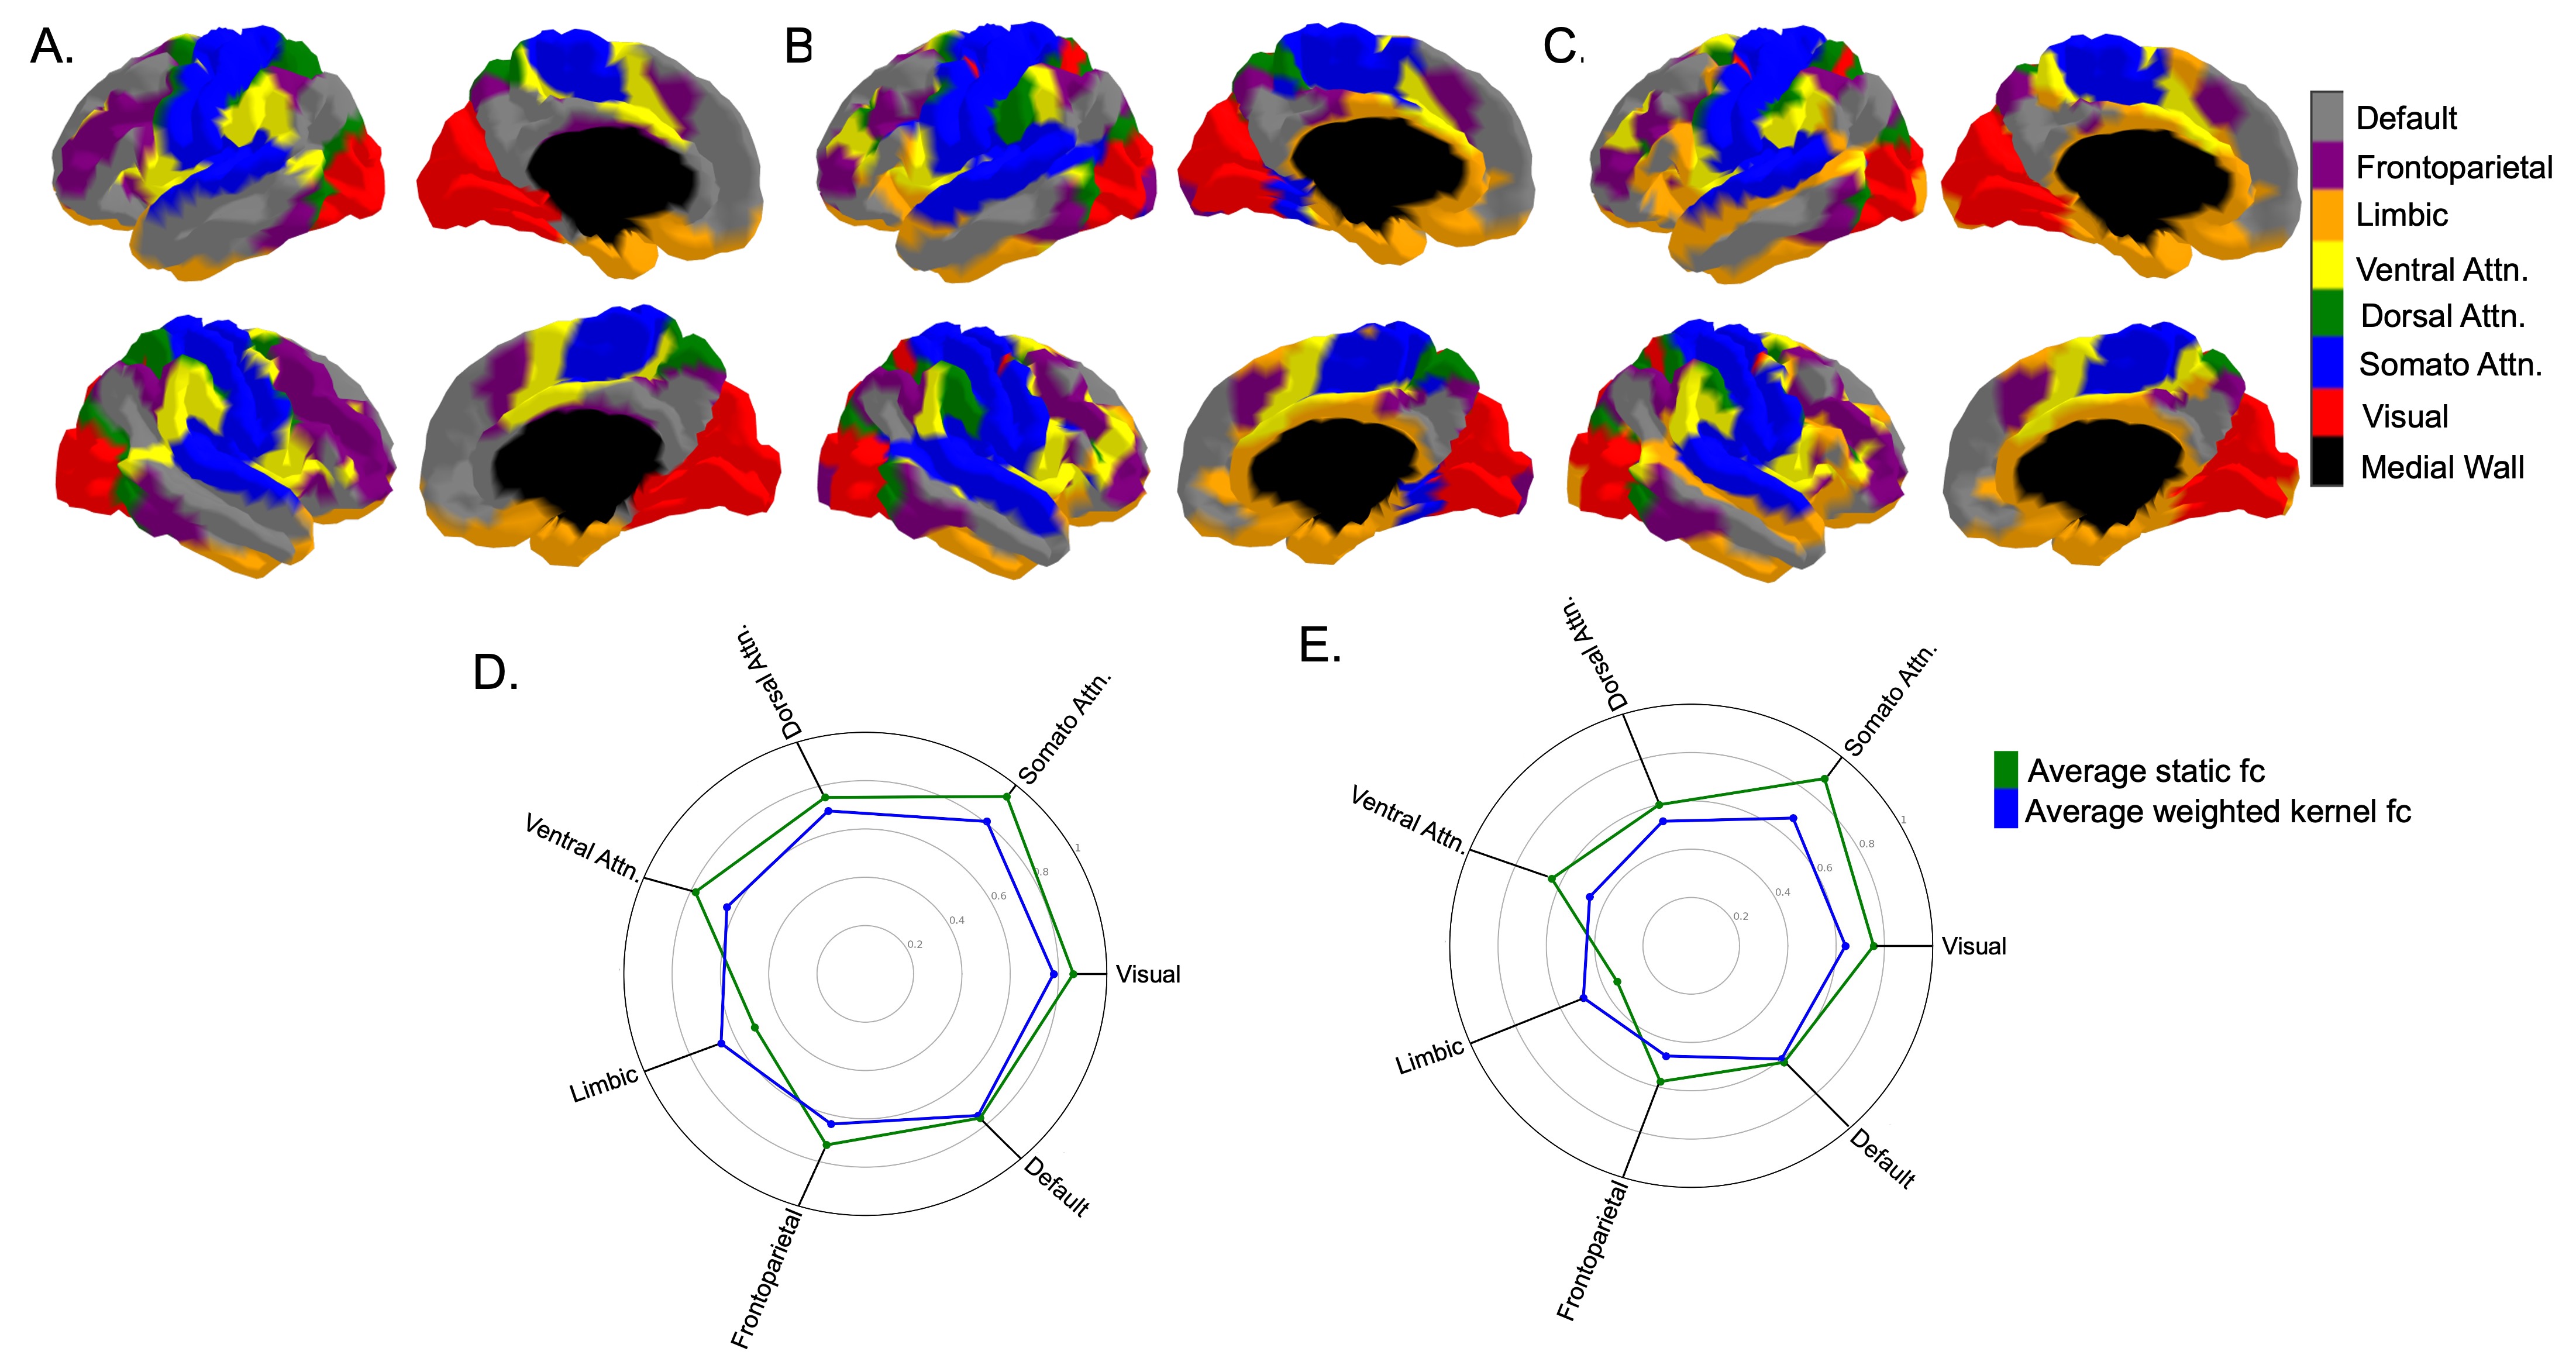
Comparative parcellation at the individual level indicates the kernel-based matrix outperforms static FC when measured against the delineated 7-network functional atlas, with marginal differences in the Limbic network (Dice: 0.0864, Jaccard: 0.0607) (Figure 2). Similarly, the group-level parcellation showcases the kernel-based matrix (Figure 3C) over the averaged static fc (Figure 3B) achieving higher Dice and Jaccard scores for the six networks aforementioned except Limbic. The Limbic network's overprediction in average static fc indicates its high Dice and Jaccard scores (Figure 3B). The kernel-based matrix surpasses the average static fc with a Dice score of 0.81 over 0.71 (Figure 3D), and a Jaccard score of 0.70 compared to 0.55, respectively (Figure 3E).Discussion and Conclusion
We developed a robust kernel-based approach which is capable of delineating functional networks in the brain not only at a group level but also for individual scans and demonstrated that the inclusion of features from the BOLD raw signals significantly improves the clustering of FNs. For future, we aim to optimize the graph kernel and also use RNcut for clustering.Acknowledgements
This study is funded by NIH R01MH092535, R01MH125333, R01EB031284, R01MH129981, R21EB009545, R21MH123930, UM1 MH130991 and P50HD105354.References
1. Friston, K. J. Functional and effective connectivity in neuroimaging: A synthesis. Hum Brain Mapp 2, (1994).
2. Biswal, B., Zerrin Yetkin, F., Haughton, V. M. & Hyde, J. S. Functional connectivity in the motor cortex of resting human brain using echo‐planar mri. Magn Reson Med 34, (1995).
3. Smith, S. M. et al. Correspondence of the brain’s functional architecture during activation and rest. Proc Natl Acad Sci U S A 106, (2009).
4. Bassett, D. S. et al. Hierarchical organization of human cortical networks in health and Schizophrenia. Journal of Neuroscience 28, (2008).
5. Yerys, B. E. et al. Globally weaker and topologically different: Resting-state connectivity in youth with autism. Mol Autism 8, (2017).
6. Mueller, S. et al. Individual Variability in Functional Connectivity Architecture of the Human Brain. Neuron 77, (2013).
7. R.N.DeJ. Epilepsy and the Functional Anatomy of the Human Brain. Neurology 4, (1954).
8. Frost, M. A. & Goebel, R. Measuring structural-functional correspondence: Spatial variability of specialised brain regions after macro-anatomical alignment. Neuroimage 59, (2012).
9. Kim, J. H. et al. Defining functional SMA and pre-SMA subregions in human MFC using resting state fMRI: Functional connectivity-based parcellation method. Neuroimage 49, (2010).
10. Shen, X., Papademetris, X. & Constable, R. T. Graph-theory based parcellation of functional subunits in the brain from resting-state fMRI data. Neuroimage 50, (2010).
11. Shen, X., Tokoglu, F., Papademetris, X. & Constable, R. T. Groupwise whole-brain parcellation from resting-state fMRI data for network node identification. Neuroimage 82, (2013).
12. Peng, Q. et al. Regularized-Ncut: Robust and homogeneous functional parcellation of neonate and adult brain networks. Artif Intell Med 106, (2020).
13. Gollo, L. L., Zalesky, A., Matthew Hutchison, R., Van Den Heuvel, M. & Breakspear, M. Dwelling quietly in the rich club: Brain network determinants of slow cortical fluctuations. Philosophical Transactions of the Royal Society B: Biological Sciences 370, (2015).
14. Smith, S. M. et al. Resting-state fMRI in the Human Connectome Project. Neuroimage 80, (2013).
15. Marcus, D. S. et al. Human Connectome Project informatics: Quality control, database services, and data visualization. Neuroimage 80, (2013).
16. Heil, C. E. & Walnut, D. F. Continuous and discrete wavelet transforms. SIAM Review 31, (1989).
17. Bracewell, R. N. The Fourier Transform and applications. McGraw Hill (2000).
18. Freeman, W. Hilbert transform for brain waves. Scholarpedia 2, (2007).
19. Neumann, M., Garnett, R., Bauckhage, C. & Kersting, K. Propagation kernels: efficient graph kernels from propagated information. Mach Learn 102, (2016).
20. Thomas Yeo, B. T. et al. The organization of the human cerebral cortex estimated by intrinsic functional connectivity. J Neurophysiol 106, (2011).
Figures