1194
Evaluation of an MR Anatomically Guided PET Reconstruction in Characterizing Multiple Sclerosis Lesions1Mallinckrodt Institute of Radiology, Washington University School of Medicine, St. Louis, MO, United States, 2Siemens Medical Solutions, St. Louis, MO, United States, 3Siemens Medical Solutions, New York City, NY, United States, 4Department of Neurological Surgery, Washington University School of Medicine, St. Louis, MO, United States
Synopsis
Keywords: Analysis/Processing, PET/MR, Bowsher CNN
Motivation: Bowsher CNN, an MRI anatomic-guided PET reconstruction method, can provide high-resolution PET images. It is unknown how it may affect lesion characterization in MS patients.
Goal(s): Evaluate PET signal without or with Bowsher CNN in various MS lesions.
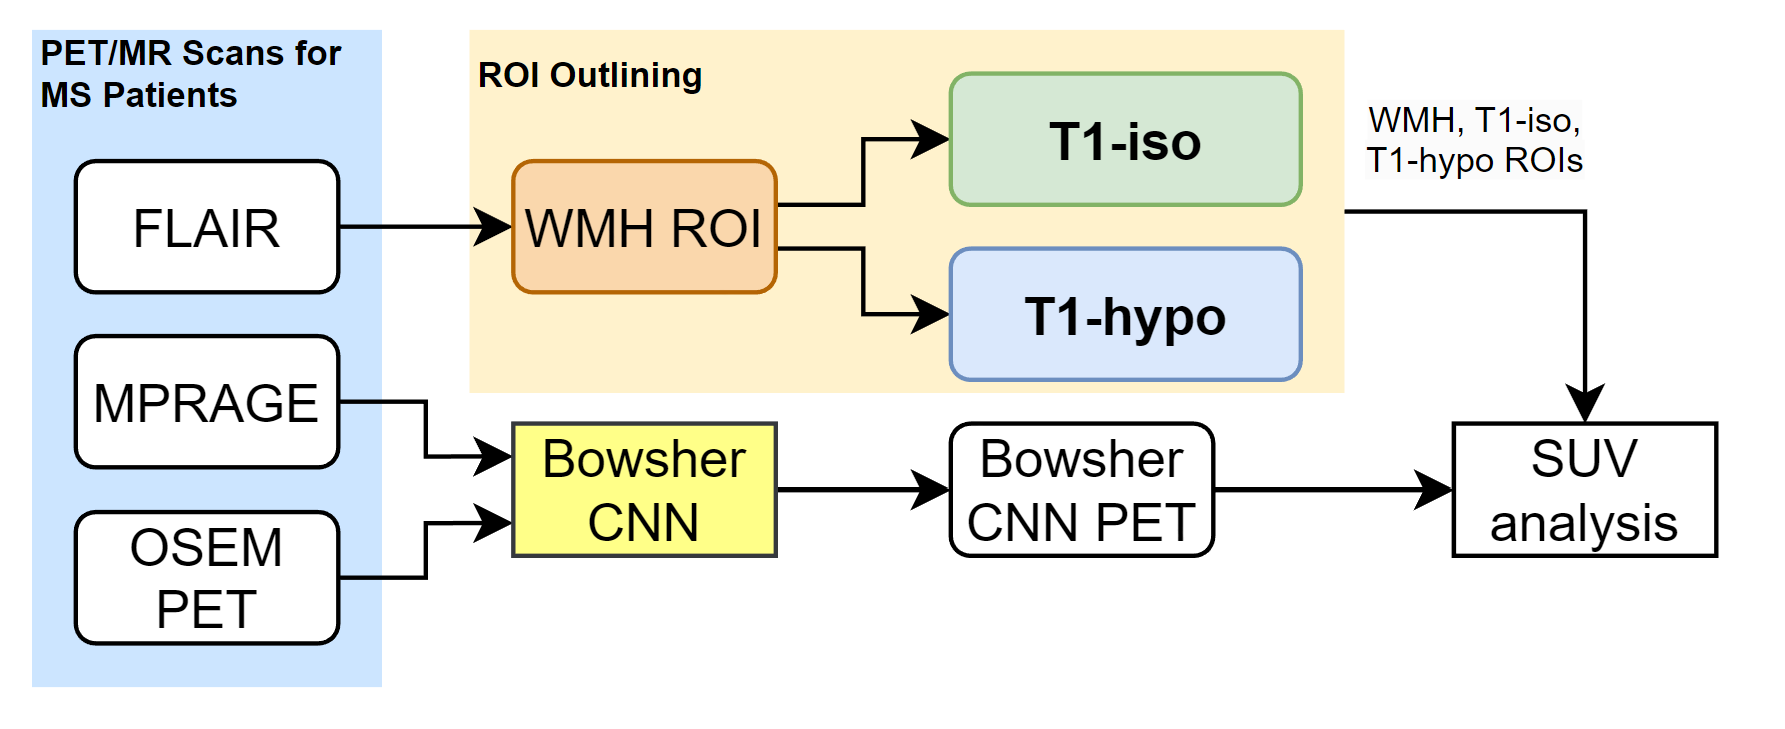
Approach: FLAIR images defined WMH lesions and NAWM. WMH lesions were further separated into “T1-hypo” and “T1-iso” sub-categories based on T1 intensity. 18F-FDG SUVs were obtained from various lesion ROIs.
Results: The SUV differences between WMH and NAWM and between T1-hypo and T1-iso lesions became lower and higher, respectively, after applying Bowsher CNN.
Impact: Bowsher CNN PET reconstruction results in high-resolution PET images. SUV differences between WMH and NAWM became smaller, while the SUV differences between T1-hypo and T1-iso, two WMH subcategories, were larger after applying Bowsher CNN.
INTRODUCTION
PET image suffers from low resolution, which may negatively impact lesion delineation. Anatomically guided PET reconstruction using high-resolution MR images has been proposed to mitigate this limitation. Schramm et al. have proposed a Bowsher convolutional neural network (CNN) to reconstruct high-resolution PET images using a pair of low-resolution PET and high-resolution T1 images as inputs1. Multiple sclerosis (MS) is an inflammatory and degenerative disease. Patients with MS often have white matter hyperintensity (WMH) lesions in FLAIR MR images. These WMH lesions are either hypo-intense or iso-intense on T1w MPRAGE MR images. It is unclear whether glucose metabolism may differ between WMH and normal-appearing white matter (NAWM), and between T1-hypo and T1-iso lesions. This study aimed to evaluate whether Bowsher CNN reconstructed 18F-FDG images may distinguish MS lesions with various MR FLAIR and T1 signatures. We examined the 18F-FDG standardized uptake values (SUV) in WMH, NAWM, T1-iso, and T1-hypo regions.METHODS
11 control and 22 MS patients were studied with approved IRB and written informed consent. All images were acquired on a 3 T PET/MRI system (Siemens Biograph mMR, Siemens Healthineers, Erlangen, Germany). T1w MPRAGE and FLAIR MR images were obtained with a resolution of 1 mm3. An 18F-FDG PET scan was performed with an injection dose ranging from 4.4 to 5.9 mCi. Head motion correction was performed, followed by ordered subset expectation maximization (OSEM) PET reconstruction at a spatial resolution of 2.03 mm3 using 18F-FDG data acquired 55-60 minutes postinjection. OSEM PET was aligned to T1 MPRAGE using a rigid registration by SPM. The aligned OSEM PET and T1 MR were fed into a Bowsher CNN to obtain high-resolution PET images2. The standard uptake values (SUV) were calculated. Tissue segmentation was performed using MPRAGE.In the control group, all subjects are registered to an atlas. Group SUV mean image is calculated. In the patient group, WMH ROIs were manually outlined on FLAIR. K-means is used to further separate WMH lesions into two subcategories: T1-iso and T1-hypo based on the T1MPRAGE signal intensity. SUV mean values are obtained from NAWM, WMH, T1-iso, and T1-hypo lesion ROIs. To improve robustness, data with lesions smaller than 0.1 ml were excluded from SUV analysis. SUV differences between NAWM and WMH, and between T1-hypo and T1-iso were obtained from OSEM and Bowsher CNN reconstructed PET images. The Wilcoxon matched-pairs signed rank test was used for comparison.
RESULTS
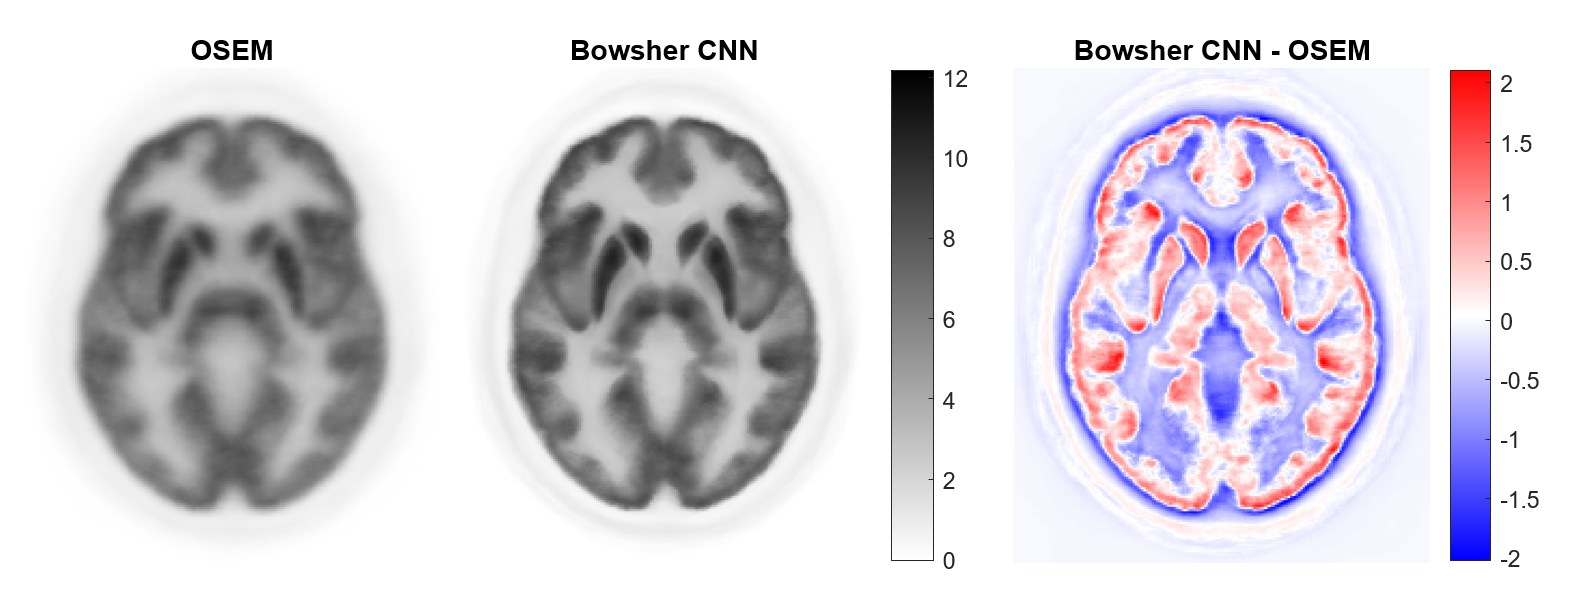
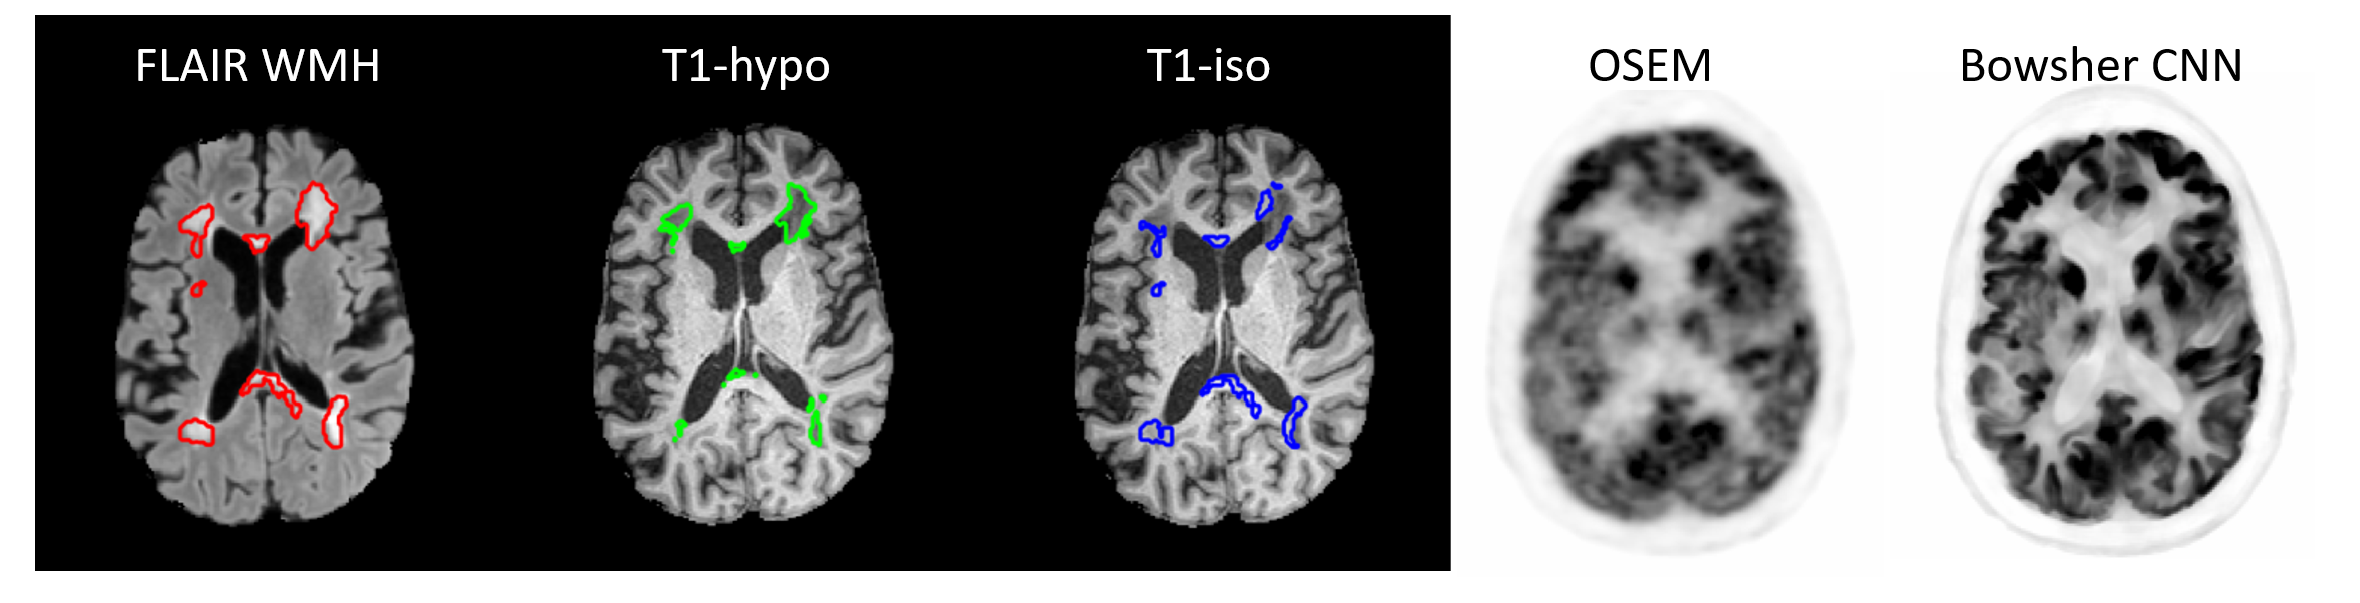
Bowsher CNN reconstructed PET images have higher spatial resolution and greater GM and WM contrast (Fig. 2). Fig.3 illustrates one MS patient as an example, displaying MR-based ROIs (left panel). The PET images on the right panel, with and without Bowsher CNN, demonstrate increased grey and white matter contrast.The median and interquartile range (IQR) of WMH lesions are 1.88 (0.97 4.42) ml. Median (IQR) were 0.45 (0.28 1.43) and 1.34 (0.81 3.16) ml for T1-hypo and T1-hypo lesions, respectively. In the SUV analysis, three data sets were excluded due to small lesion volumes (<0.1 ml).
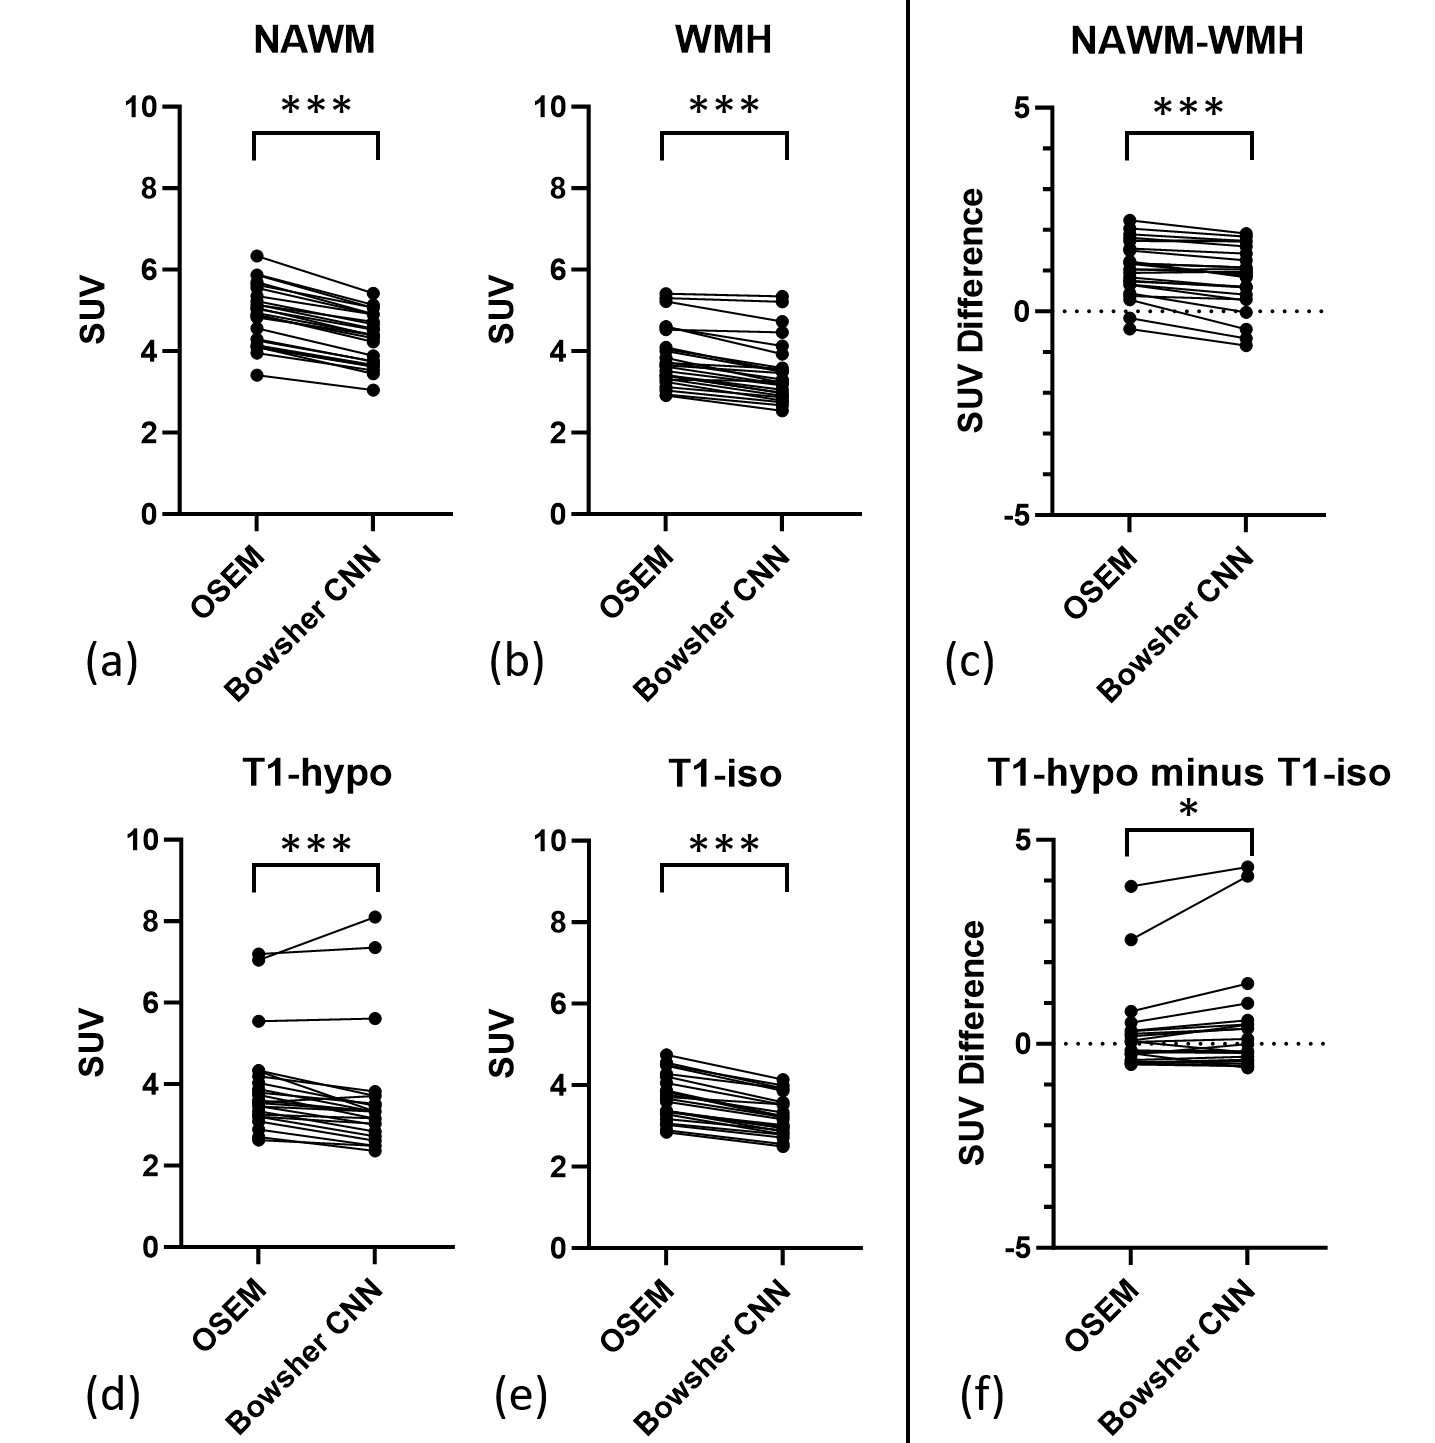
SUVs within WMH, NAWM, T1-hypo, and T1-iso were displayed in Fig 4. Bowsher CNN reduced SUVs in both NAWM and WMH (Fig 4 a and b). The difference between NAWM and WMH became significantly smaller in Bowsher CNN reconstructed PET (Fig 4 c). SUVs in T1-iso and T1-hypo lesions are statistically reduced in Bowsher CNN reconstructed images (Fig 4 d and e). The SUV differences between T1-hypo and T1-iso lesions were significantly greater (Fig 4 f) in Bowsher CNN reconstructed PET.
DISCUSSION
MS lesions are usually manifested as WMH in FLAIR MR images. However, hypo-intense and iso-intense T1w MR signals may co-exist in these WMH lesions. The glucose metabolism profile is not yet known in these two lesion sub-categories (T1-hypo and T1-iso). In this study, we observed higher 18F-FDG SUVs in the majority of T1-hypo lesions compared to T1-iso lesions in OSEM reconstructed PET images. The high glucose metabolism in the T1-hypo lesions may suggest active ongoing neuroinflammation in these lesions. The SUV differences between T1-hypo and T1-iso were further enhanced in the Bowsher CNN reconstructed PET images.CONCLUSION
SUV differences between NAWM and WMH and between T1-hypo and T1-iso lesions in Bowsher CNN reconstructed PET images need to be evaluated in lesion progression in future studies.Acknowledgements
We acknowledge Siemens Healthineers for providing funding to this study.References
1. Schramm, Georg, et al. "Approximating anatomically-guided PET reconstruction in image space using a convolutional neural network." Neuroimage 224 (2021): 117399.
2. Schramm G., GitHub repository, 2013; https://github.com/gschramm/pyapetnet/tree/master. Accessed November 8, 2023.
Figures