1193
Toward Task-Based Reconstruction: Evaluating Relationships Between Reconstruction and Object Detection Performance1Radiology and Biomedical Imaging, University of California, San Francisco, San Francisco, CA, United States, 2University of California, Berkeley, Berkeley, CA, United States
Synopsis
Keywords: Analysis/Processing, Machine Learning/Artificial Intelligence
Motivation: Traditional medical image reconstruction emphasizes standard metrics, potentially overlooking optimization for downstream tasks like segmentation and anomaly detection.
Goal(s): Our study investigates the relationship between standard reconstruction and object detection metrics.
Approach: We trained a Faster R-CNN detector for meniscal anomalies, addressing class imbalance and implementing a custom detection-specific augmentation protocol.
Results: Evaluation on reconstructed datasets revealed that reconstruction quality was associated with true predictions but had a limited impact on overall detection performance, while boxes-based reconstruction metrics showed no correlation with prediction outcomes. These findings underscore the importance of considering associations between standard reconstruction and downstream task metrics when optimizing end-to-end pipelines.
Impact: Evaluation of standard reconstruction metrics, sliced by object detection outcomes, revealed a significant association between reconstruction and detection performance, emphasizing the utility of this approach in assessing task-based reconstruction.
INTRODUCTION
Modern deep learning (DL) algorithms demonstrated remarkable performance in medical image reconstruction1–3. While metrics like normalized root mean square error (nRMSE)4, peak signal-to-noise ratio (PSNR)5, and structural similarity index (SSIM)6 prioritize high-quality images for radiologists, optimizing them may not produce ideal datasets for alternative downstream tasks. Our recent research has revealed that achieving robust reconstruction did not necessarily correspond to strong segmentation performance7. In a separate study, top-performing reconstruction models struggled to preserve small lesions within the meniscal area8. Given these findings, our research investigates whether the quality of reconstruction influences the performance of object detection and whether detection can be used to assess meniscal anomaly retention in reconstructed images.METHODS
Image Acquisition3D fast spin-echo fat-suppressed CUBE images were acquired at a UCSF GE Discovery MR750 scanner using 18-channel knee coil with the following parameters: repetition time (TR)/echo time (TE), 1002/29 msec; field of view (FOV), 15 cm2; acquisition matrix, 256×256×200; slice thickness, 0.6 mm; echo train length, 36; readout bandwidth, ±62.5 kHz; acceleration, 4X ARC9; acquisition time, 4 min 58 sec. Subsequently, an in-house pipeline that leveraged GE Orchestra 1.10 and other post-processing tools were used to reconstruct images from raw scanner data and save multicoil k-space.
Dataset Characteristics
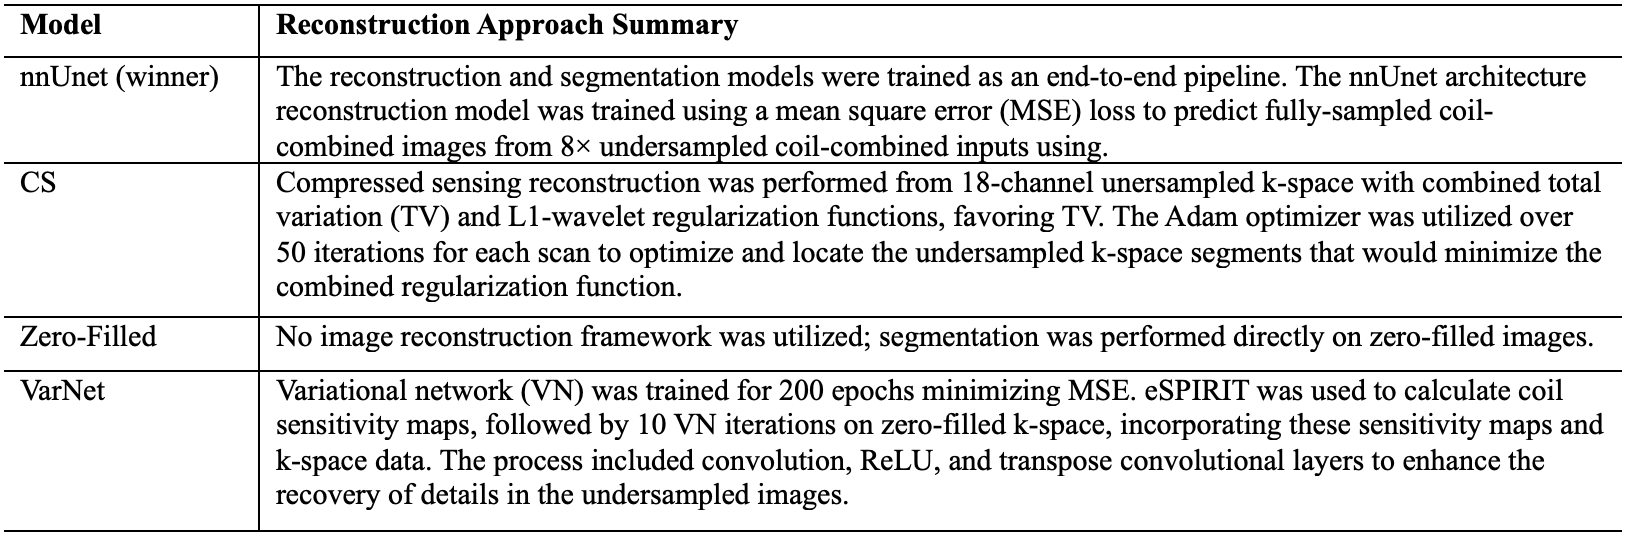
Patients were divided into 761/85 training and validation partitions, with the test set consisting of the same 50 patients used in the K2S challenge7. To assess the detection performance on reconstructed images and compare it to the K2S segmentation performance, we evaluated the reconstruction results from the top four challenge submissions, as summarized in Fig. 1. A total of 18,059 meniscal anomaly boxes were drawn by three clinical radiologists (15,414 for training, 1,638 for validation, and 1,007 for testing). All images underwent normalization based on mean and standard deviation, followed by volume-wise percentile normalization.
Training and Evaluation
A Faster R-CNN model with a ResNet-50-FPN backbone10 was used for detection on 2D image slices. The training set was divided into 20% random slices per epoch using a data fractionation approach. Data augmentation included custom bounding box bidirectional shifts, image shifts/scales/rotations, crops, and cutouts11. The class imbalance in the anomaly class was addressed with bounding box upsampling. The training utilized an SGD optimizer with a learning rate scheduler starting at 0.01 for 30 epochs.
The detection performance was assessed by precision, recall, mean average precision (mAP), and F1 score, defining true positive (TP) predictions as having at least 0.2 Intersection-over-Union (IoU) and a 0.7 confidence score. Reconstruction performance was assessed using standard image-based and boxes-based reconstruction metrics, with nRMSE, PSNR, and SSIM calculated within predicted boxes.
RESULTS
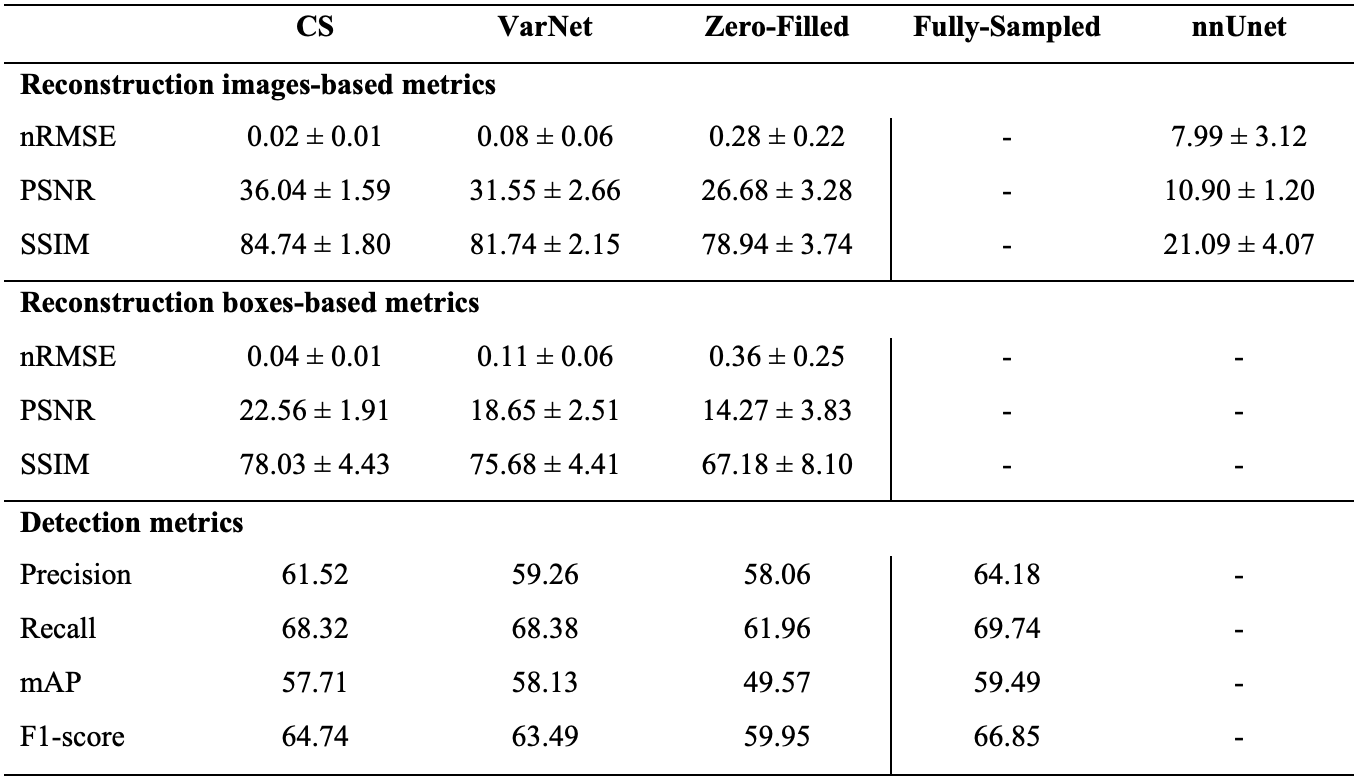
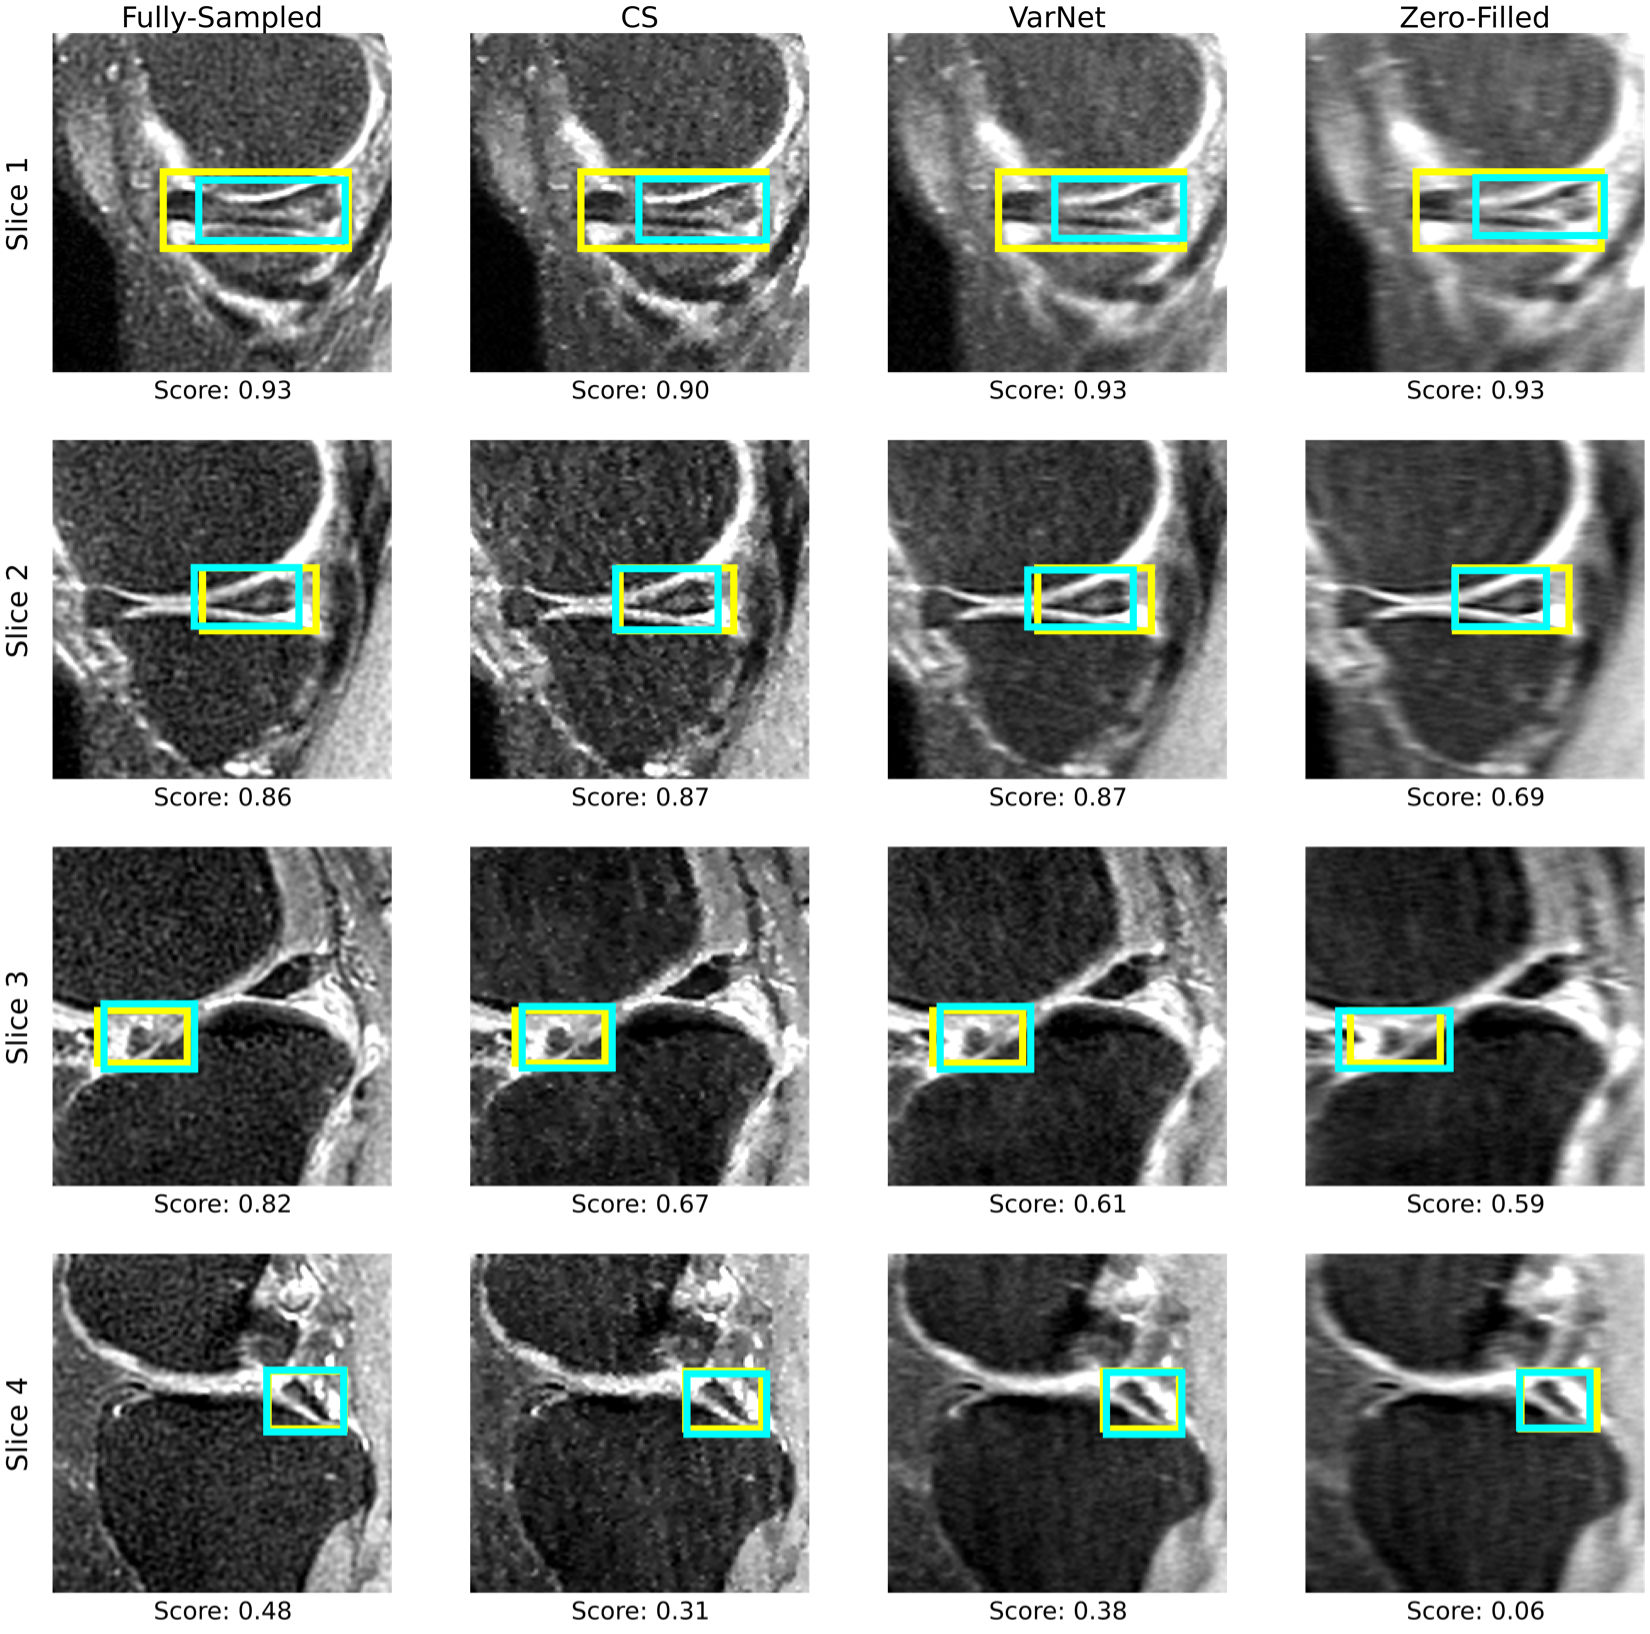
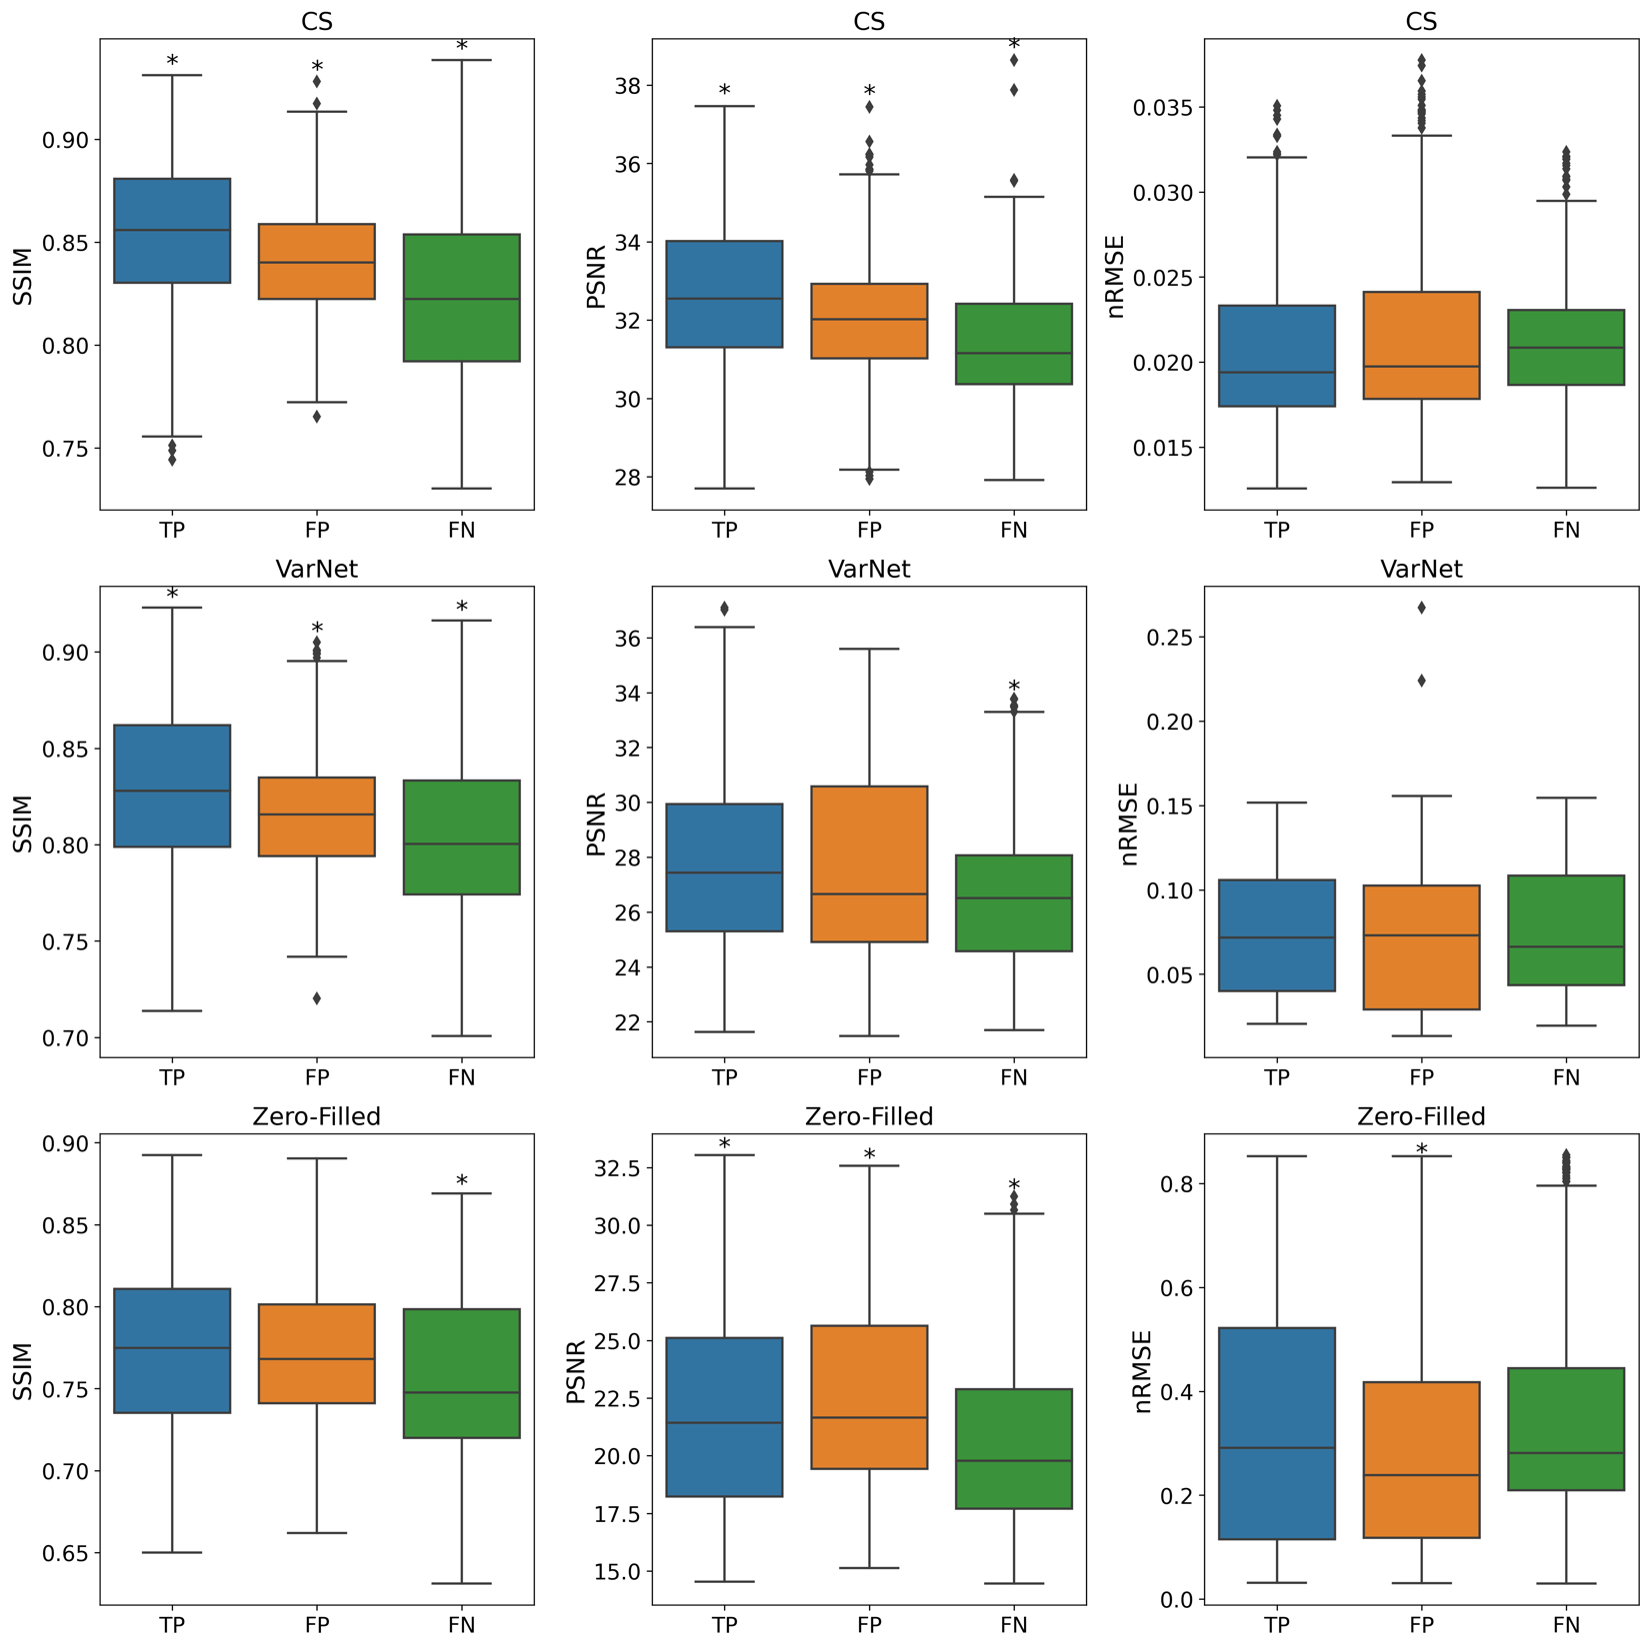
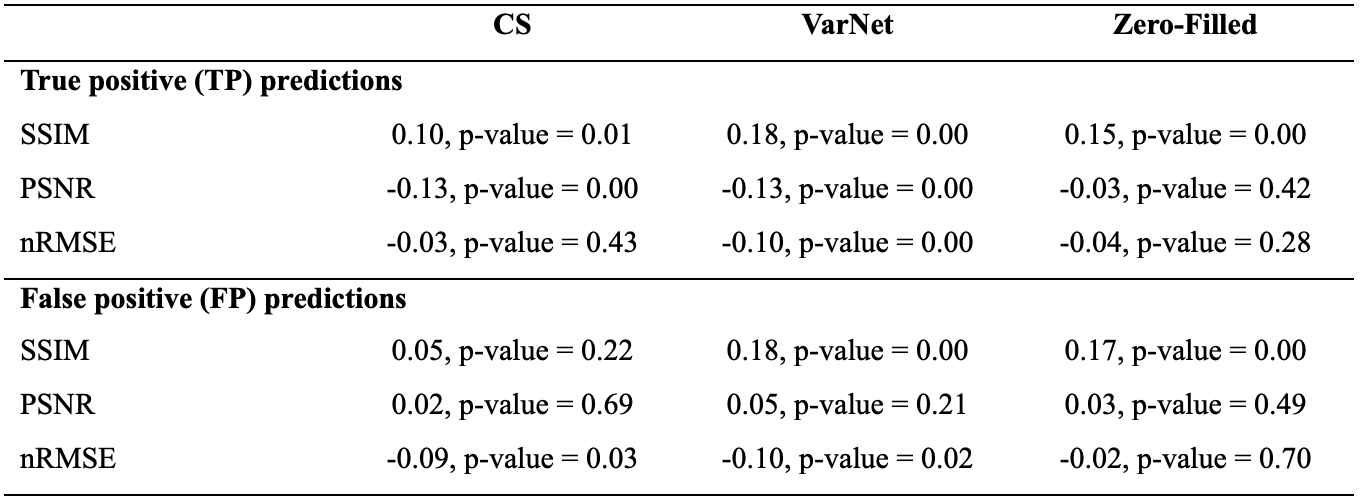
Image-based and boxes-based reconstruction metrics, along with detection metrics for four test sets are in Fig. 2, and an example of reconstructed slices with detected boxes is in Fig. 3. Detection couldn’t be performed on nnUnet results because its reconstructed images served as intermediaries in the two-model cascade training and were not intended for any other downstream tasks. The detection model showed comparable performance on CS and VarNet reconstructed test sets. Detection performance was lower on zero-filled images. Interestingly, for CS and VarNet outputs, the highest mean slice SSIM was associated with TP predictions, while the lowest was linked to FN predictions, as depicted in Fig. 4. Spearman’s correlation coefficients between box-based reconstruction metrics and prediction confidence scores are presented in Fig. 5, with no significant correlations observed.DISCUSSION AND CONCLUSIONS
In this study, we explored the relationship between image reconstruction and object detection within the context of meniscal anomalies. Anomaly detection yielded similar results for the CS and VarNet test sets, despite their respective 2nd and 4th place rankings in the K2S challenge’s segmentation performance. These findings are consistent with our previous research7,12 and underscore that achieving the highest reconstruction quality, as measured by aggregated standard reconstruction metrics, does not necessarily predict performance in downstream tasks like anomaly detection. However, we observed significant variations in the distribution of slice-based classic reconstruction metrics concerning prediction outcomes, particularly true positives and false negatives. This indicates that even though the anomaly detection model performs well across all reconstruction models, the application of metrics like SSIM, which are more sensitive to reconstruction quality, is essential in the task-based image reconstruction domain, and ideally should be considered in association with downstream task metrics.Our findings underscore the importance of end-to-end pipelines, where reconstruction performance is tailored to the specific end task rather than relying solely on standard metrics. This study establishes a foundation for our future direction of developing a fully automated end-to-end reconstruction and anomaly detection pipeline.
Acknowledgements
We want to acknowledge Jan Nikolas Morshuis, Paul Fischer, Matthias Hein, and Christian F. Baumgartner from the Cluster of Excellence Machine Learning, University of Tübingen; Artem Razumov and Dmitry Dylov from the Center for Computational and Data-Intensive Science and Engineering, Skolkovo Institute of Science and Technology; Quintin van Lohuizen and Stefan J. Fransen from the Department of Radiology, University Medical Center Groningen; Xiaoxia Zhang, Radhika Tibrewala, Hector Lise de Moura, Kangning Liu, Marcelo V. W. Zibetti, and Ravinder Regatte from Center for Advanced Imaging Innovation and Research, New York University Grossman School of Medicine for their participation in the K2S challenge and for providing us with the reconstructed test sets. We also acknowledge Aniket Tolpadi and Rupsa Bhattacharjee for organizing and running the challenge, and for mentoring. Finally, we would like to acknowledge our funding source NIH R01AR078762.References
1. Eo T, Jun Y, Kim T, Jang J, Lee HJ, Hwang D. KIKI-net: cross-domain convolutional neural networks for reconstructing undersampled magnetic resonance images. Magn Reson Med. 2018;80(5). doi:10.1002/mrm.27201
2. Hammernik K, Klatzer T, Kobler E, et al. Learning a variational network for reconstruction of accelerated MRI data. Magn Reson Med. 2018;79(6). doi:10.1002/mrm.26977
3. Aggarwal HK, Mani MP, Jacob M. MoDL: Model-Based Deep Learning Architecture for Inverse Problems. IEEE Trans Med Imaging. 2019;38(2). doi:10.1109/TMI.2018.2865356
4. Fienup JR. Invariant error metrics for image reconstruction. Appl Opt. 1997;36(32). doi:10.1364/ao.36.008352
5. Horé A, Ziou D. Is there a relationship between peak-signal-to-noise ratio and structural similarity index measure? IET Image Process. 2013;7(1). doi:10.1049/iet-ipr.2012.0489
6. Wang Z, Bovik AC, Sheikh HR, Simoncelli EP. Image quality assessment: From error visibility to structural similarity. IEEE Transactions on Image Processing. 2004;13(4). doi:10.1109/TIP.2003.819861
7. Tolpadi AA, Bharadwaj U, Gao KT, et al. K2S Challenge: From Undersampled K-Space to Automatic Segmentation. Bioengineering. 2023;10(2). doi:10.3390/bioengineering10020267
8. Knoll F, Murrell T, Sriram A, et al. Advancing machine learning for MR image reconstruction with an open competition: Overview of the 2019 fastMRI challenge. Magn Reson Med. 2020;84(6). doi:10.1002/mrm.28338
9. Brau ACS, Beatty PJ, Skare S, Bammer R. Comparison of reconstruction accuracy and efficiency among autocalibrating data-driven parallel imaging methods. Magn Reson Med. 2008;59(2). doi:10.1002/mrm.21481
10. Ren S, He K, Girshick R, Sun J. Faster R-CNN: Towards Real-Time Object Detection with Region Proposal Networks. IEEE Trans Pattern Anal Mach Intell. 2017;39(6). doi:10.1109/TPAMI.2016.2577031
11. Zoph B, Cubuk ED, Ghiasi G, Lin TY, Shlens J, Le Q V. Learning Data Augmentation Strategies for Object Detection. In: Lecture Notes in Computer Science (Including Subseries Lecture Notes in Artificial Intelligence and Lecture Notes in Bioinformatics). Vol 12372 LNCS. ; 2020. doi:10.1007/978-3-030-58583-9_34
12. Konovalova N, Tolpadi A, Liu F, et al. Towards Integrating DL Reconstruction and Diagnosis: Meniscal Anomaly Detection Shows Similar Performance on Reconstructed and Baseline MRI. In: In Proceedings of the 31st Annual Meeting of ISMRM, Toronto, Ontario, Canada, 2023. 1381.Figures