1188
Simultaneous 4D CSF flowmetry and BOLD fMRI using EPTI for investigation of neural activity evoked CSF flow responses1Athinoula A. Martinos Center for Biomedical Imaging, Massachusetts General Hospital, Charlestown, MA, United States, 2Department of Radiology, Harvard Medical School, Boston, MA, United States, 3Harvard-MIT Division of Health Sciences and Technology, Massachusetts Institute of Technology, Cambridge, MA, United States, 4Department of Electrical Engineering and Computer Science, Massachusetts Institute of Technology, Cambridge, MA, United States
Synopsis
Keywords: Neurofluids, Neurofluids, Data Acquisition, fMRI Acquisition, CSF Flow
Motivation: To investigate brain-wide CSF flow dynamics and how neural activity drives it.
Goal(s): Develop a novel tool to simultaneously map CSF flow and T2*-BOLD fMRI with high sensitivity/specificity and effectively measure neural-activity-evoked CSF flow.
Approach: Single-shot PGSE-EPTI is developed with high sensitivity to slow flow to acquire distortion-free phase-contrast flow velocity and directions, while simultaneously obtaining clean T2*-BOLD, T2, S0 contrasts with improved specificity.
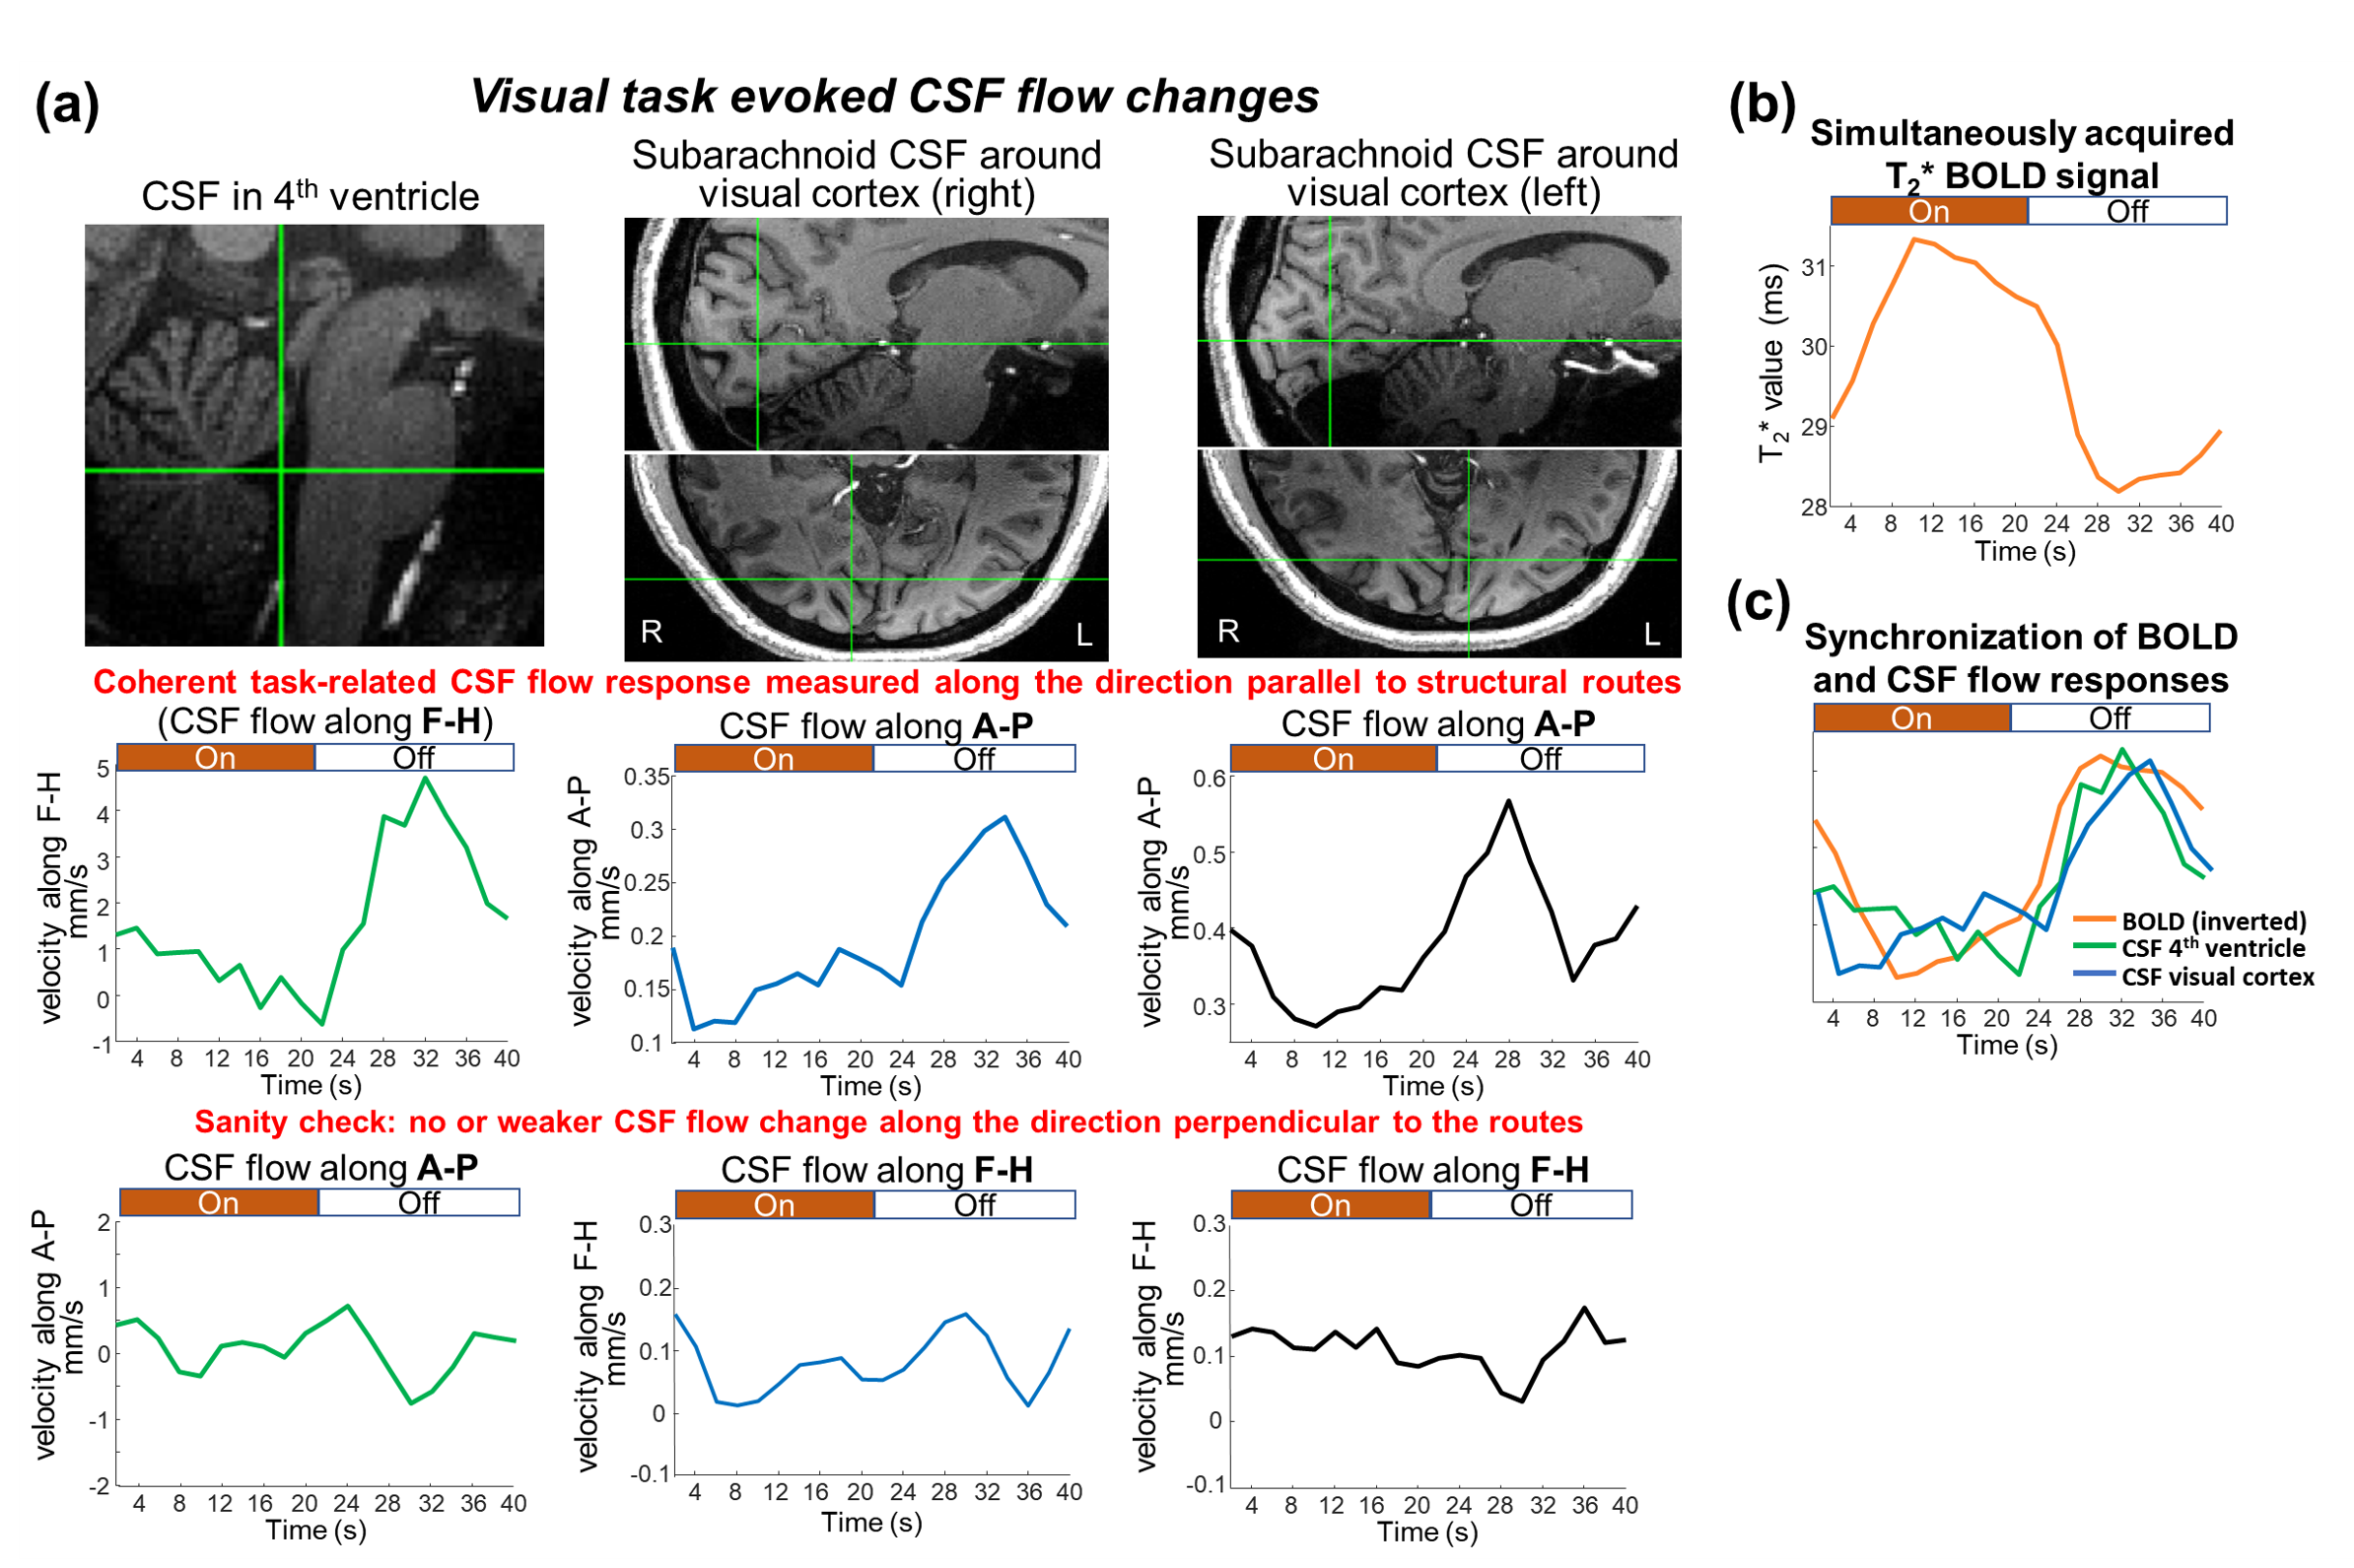
Results: Using the EPTI CSF flowmetry technique, brain-wide CSF dynamics were measured with high spatiotemporal details, and visual-task-evoked CSF flow responses were observed in both ventricles (global-response) and visual cortex subarachnoid space (local-response), synchronized with the simultaneously-acquired T2*-BOLD-fMRI signal.
Impact: We developed a novel EPTI CSF-flowmetry technique to simultaneously map whole-brain CSF flow and T2*-BOLD-fMRI with high sensitivity/specificity for investigation of neural-activity-driven CSF flow. It successfully measured both global and local visual-task-evoked CSF flow responses in ventricles and visual-cortex subarachnoid-space.
Introduction
CSF flow plays a critical role in the brain’s waste clearance system1-6. Identifying the driving factors behind CSF flow can offer valuable insights into the underlying mechanisms governing CSF clearance and aid in designing therapeutic interventions7. Previous studies reported that neural activity is a potential driving force of CSF flow, and CSF dynamic changes in 4th-ventricle during sleep8,9 and tasks10,11. However, our understanding of the CSF flow system is mostly limited to the ventricles, and little is known about the brain-wide CSF in subarachnoid space (SAS) surrounding the cerebrum. Furthermore, how neural activity influences the local SAS CSF flow remains unexplored.To map brain-wide CSF flow, acquisition with high sensitivity to slow flow is needed. Last year, we presented a 4D CSF flow imaging technique12,13 using a phase-contrast14 PGSE15-17 EPI sequence and obtained quantitative CSF flow velocities and directions in both ventricles and subarachnoid-space across the entire brain for the first time. Using this technique, we have shown how CSF flow dynamics change with respiration and cardiac cycles.
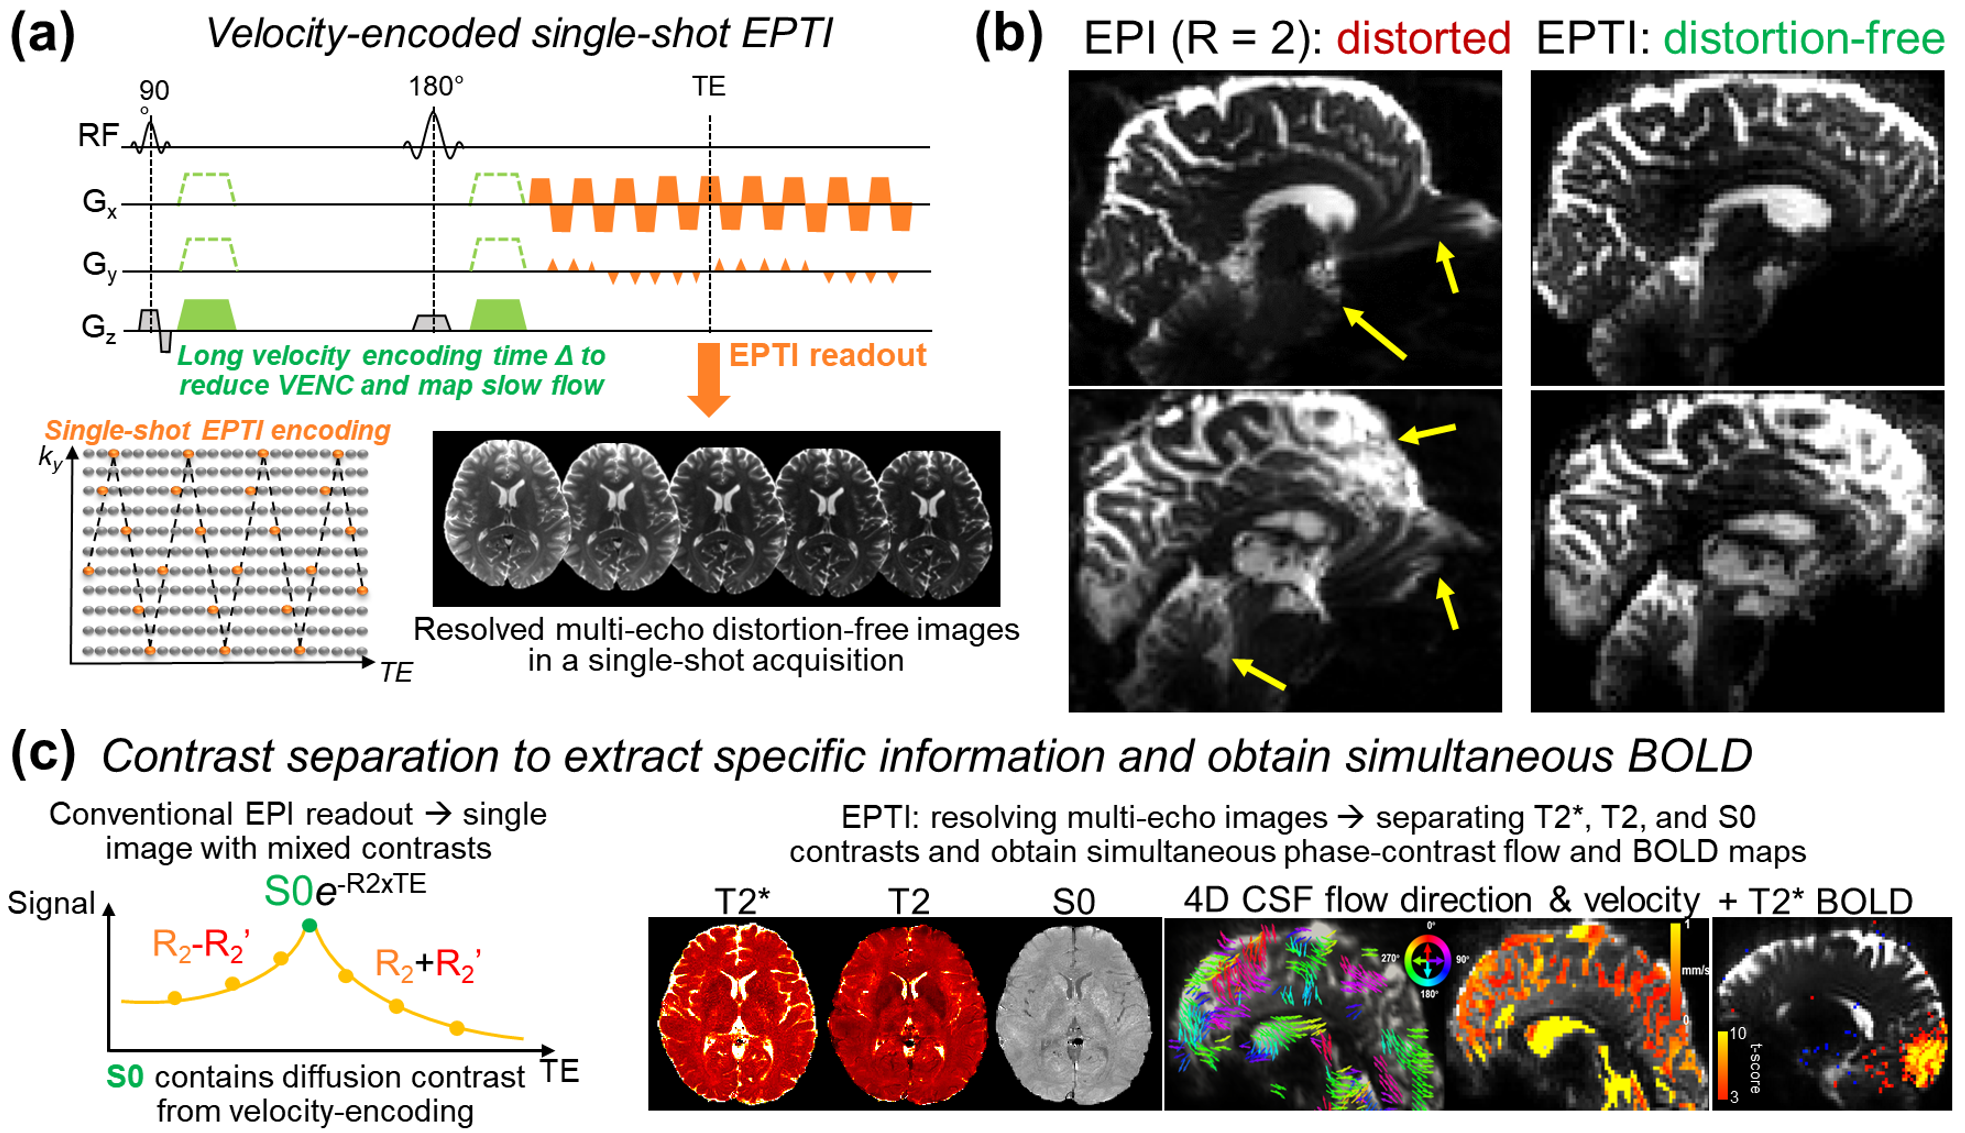
In this work, to further investigate brain-wide CSF flow dynamics and understand the role of neural activity, we developed an EPTI CSF flowmetry technique that can simultaneously acquire i) phase-contrast 4D CSF flow, ii) T2*-BOLD fMRI, and iii) T2- and S0-contrast changes. EPTI18-21 eliminates the distortion/blurring artifacts in EPI, resulting in improved anatomical integrity to study the intricate SAS areas. In addition, it resolves multi-echo images within the readout, allowing for the separation of various contrasts including T2*, T2, and flow-encoded S0. This separation is particularly useful for obtaining clean BOLD-fMRI signals, providing additional improvements over EPI in which different contrasts are intertwined and are challenging to distinguish/interpret. We demonstrated that EPTI CSF flowmetry acquired high-quality whole-brain 4D CSF flow and T2*-BOLD fMRI. We have been able to observe clear visual-task-evoked CSF dynamics in both 4th-ventricle (global flow) and SAS around the visual cortex (local flow), which are synchronized with the timing of BOLD-fMRI signals.
Methods
A PGSE-EPTI sequence was developed with high sensitivity and specificity for slow CSF flow imaging (Fig.1a). A long velocity-encoding time was used to achieve low VENC12,13 (e.g.,1cm/s) and long TE to increase CSF contrast. A single-shot EPTI readout18,21 was used to resolve multi-echo distortion-free images, while providing fast sampling with high robustness to motion and physiological noise (TR=3s whole-brain with 108 echoes). It improves the image quality over EPI by eliminating the distortion/blurring artifacts (Fig.1b). Its multi-echo imaging capability enables the separation of the mixed image contrasts within the readout, so clean T2* (BOLD), T2, and flow-encoded S0 contrasts can be obtained with improved specificity and interpretability. All these magnitude-based contrasts are simultaneously obtained with the phase-contrast for flow measurements.In-vivo experiments with visual tasks were conducted on 7T Siemens-Terra using a custom-built 64-channel-coil22. Whole-brain 2-mm-isotropic resolution PGSE-EPTI data were acquired with different VENCs (1cm/s, 2cm/s) and velocity-encoding directions.
Results
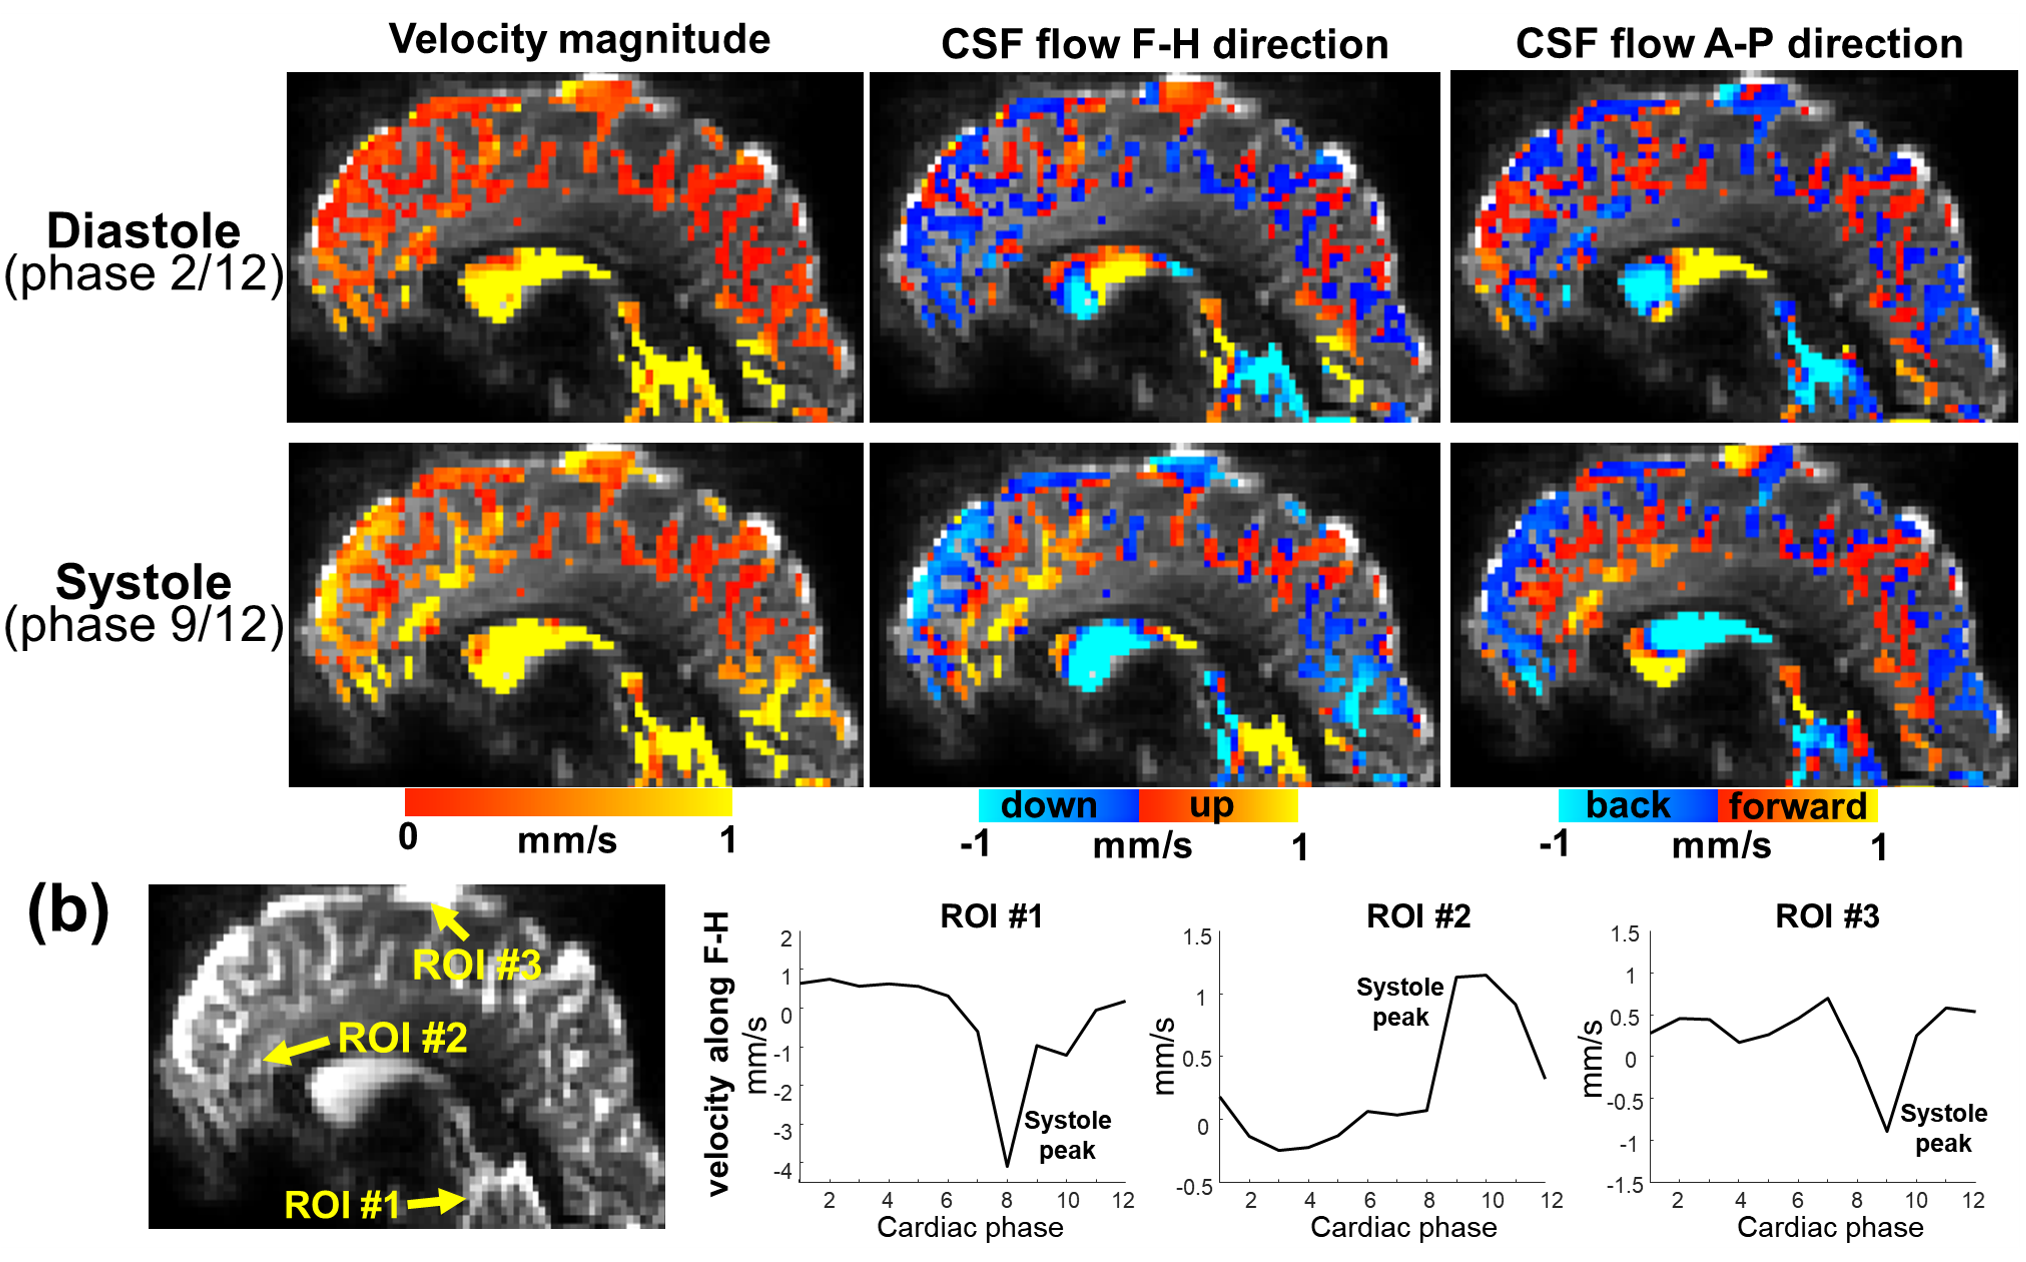
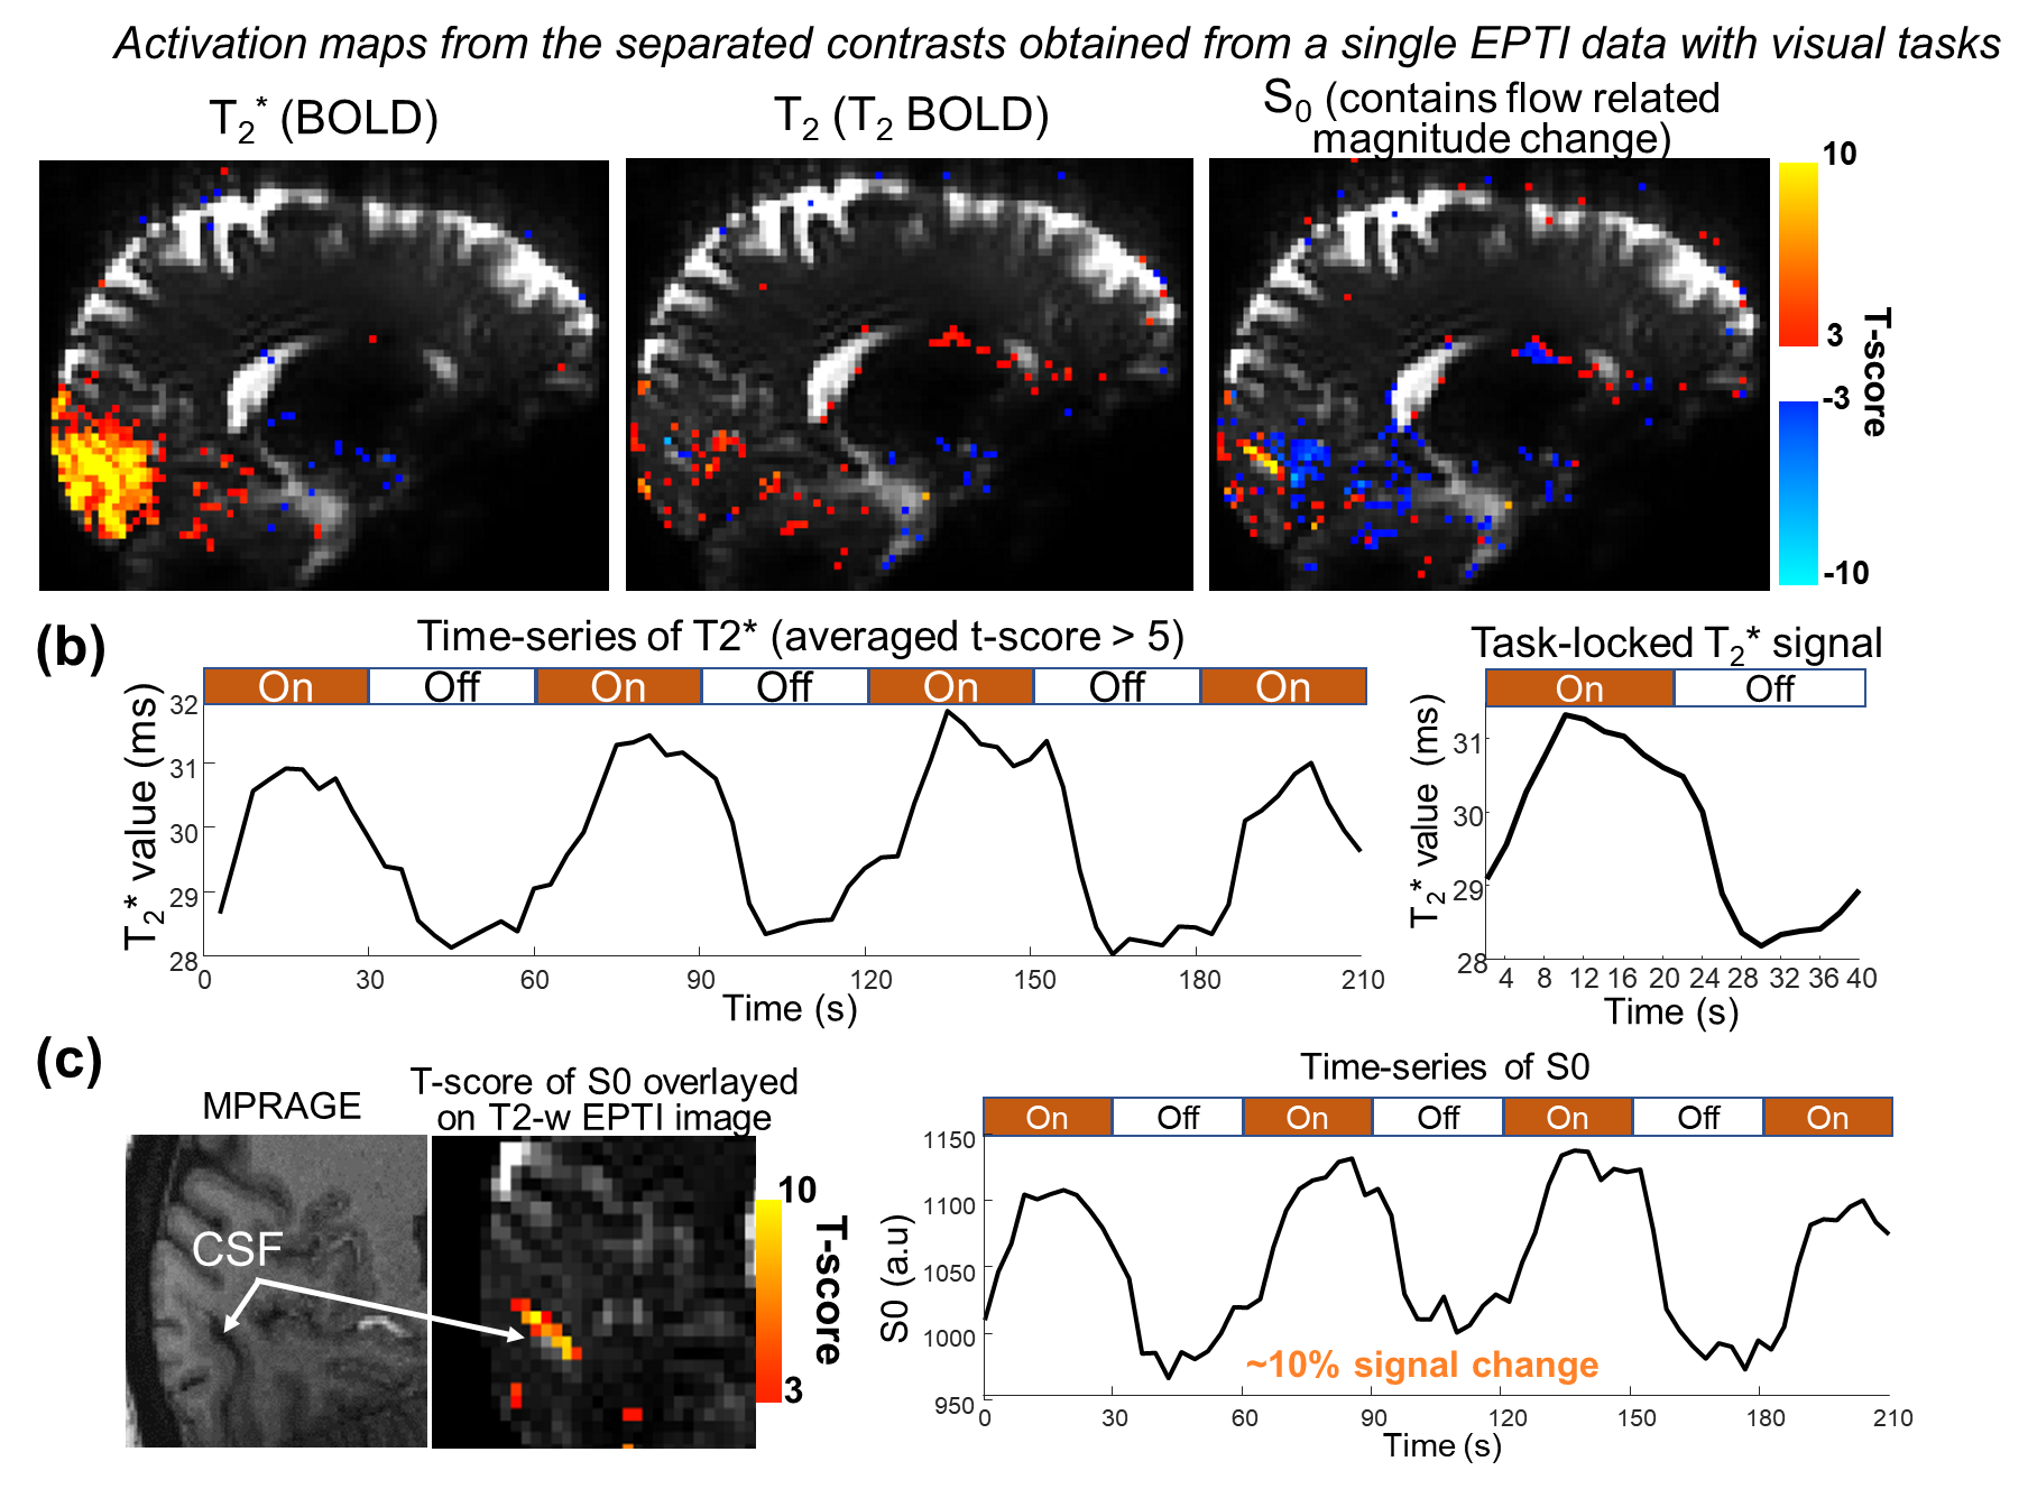
Using EPTI CSF flowmetry, we measured brain-wide CSF flow dynamics and observed that the intensity/directions of CSF flow in both ventricles and SASs changed rapidly across the cardiac phases (Fig.2), and a higher velocity was observed during systole (Fig.2b), consistent with our previous findings using PGSE-EPI. The detailed patterns of the cardiac-related CSF flow are shown in a movie (Fig.3), revealing comprehensive spatiotemporal dynamics of CSF flow across the entire brain. Fig.4 shows the activation maps from the simultaneously acquired T2*(BOLD), T2 and S0. Strong visual cortex activation was observed in T2*, and much less in T2 and S0 as expected. S0 shows a focal activation in SAS CSF with a high percent change of 10%, likely related to CSF volume change23-26 or flow-related diffusion contrast27-28.Finally, we have been able to observe both the global (4th-ventricle) and local (SAS around both sides of the visual cortex) visual-task-evoked CSF flow changes. The observed visual-task-evoked CSF flow changes align with the structure of the CSF routes: stronger flow change along the direction of the structural routes of CSF (F-H in 4th-ventricle, A-P in SAS ROIs), and less in the perpendicular direction as expected. The timing of flow changes synchronized with the T2*-BOLD response (Fig.5c) in accordance with the Monro-Kellie doctrine29.
Discussion and Conclusion
The results demonstrate the capability of EPTI CSF flowmetry for simultaneous brain-wide CSF flow mapping and BOLD fMRI. It enables the study of neural activity evoked local CSF flow changes in the subarachnoid space and the globally-summed response in ventricles. Our preliminary findings suggest visual-task may drive CSF flow both locally and globally, and future work will apply the technique to investigate how resting-state/sleep activities modulate brain-wide CSF flow.Acknowledgements
This work was supported by the NIH (K99AG083056, U24NS129893, U19NS128613, R01AT011429, P41EB030006), and the instrumentation Grants (S10-OD023637).References
[1] Silverberg GD, et al. Alzheimer's disease, normal‐pressure hydrocephalus, and senescent changes in CSF circulatory physiology: a hypothesis. The Lancet Neurology. 2003;2(8):506-11.
[2] Proulx ST. Cerebrospinal fluid outflow: a review of the historical and contemporary evidence for arachnoid villi, perineural routes, and dural lymphatics. Cell Mol Life Sci. 2021;78(6):2429-57.
[3] Brinker T, et al. A new look at cerebrospinal fluid circulation. Fluids Barriers of the CNS. 2014;11(1):1-16.
[4] Iliff JJ, Wang M, Liao Y, Plogg BA, Peng W, Gundersen GA, Benveniste H, Vates GE, Deane R, Goldman SA, A EN, Nedergaard M. A paravascular pathway facilitates CSF flow through the brain parenchyma and the clearance of interstitial solutes, including amyloid β. Science translational medicine. 2012;4(147):147ra11-ra11.
[5] Louveau A, et al. Structural and functional features of central nervous system lymphatic vessels. Nature. 2015;523(7560):337-41.
[6] Rasmussen MK, Mestre H, Nedergaard M. The glymphatic pathway in neurological disorders. The Lancet Neurology. 2018;17(11):1016-24.
[7] Kylkilahti TM, et al. Achieving brain clearance and preventing neurodegenerative diseases—A glymphatic perspective. Journal of Cerebral Blood Flow Metabolism. 2021;41(9):2137-49.
[8] Fultz NE, et al. Coupled electrophysiological, hemodynamic, and cerebrospinal fluid oscillations in human sleep. Science. 2019;366(6465):628-31.
[9] Wang, Y, et al. Cerebrovascular activity is a major factor in the cerebrospinal fluid flow dynamics. Neuroimage 258 (2022): 119362.
[10] Williams, S D., et al. Neural activity induced by sensory stimulation can drive large-scale cerebrospinal fluid flow during wakefulness in humans. PLoS Biology 21.3 (2023): e3002035.
[11] Yang, Ho-Ching, et al. Coupling between cerebrovascular oscillations and CSF flow fluctuations during wakefulness: An fMRI study. Journal of Cerebral Blood Flow & Metabolism 42.6 (2022): 1091-1103.
[12] Dong Z, et al. 4D whole-brain CSF flowmetry: slow flow dynamics in ventricles and subarachnoid space. ISMRM Workshop on Neurofluids, 2022, Italy, Rome.
[13] Dong Z, et al. 4D CSF Flowmetry To Map Brain-Wide Slow CSF Flow Dynamics And Patterns In Subarachnoid Space, 2023 ISMRM.
[14] Moran, P. R. A flow velocity zeugmatographic interlace for NMR imaging in humans. Magn Reson Imaging 1, 197-203, doi:10.1016/0730-725x(82)90170-9 (1982).
[15] Tanner, J. E. & Stejskal, E. O. Restricted self‐diffusion of protons in colloidal systems by the pulsed‐gradient, spin‐echo method. The Journal of Chemical Physics 49, 1768-1777 (1968).
[16] Williamson, N. H., Komlosh, M. E., Benjamini, D. & Basser, P. J. Limits to flow detection in phase contrast MRI. J Magn Reson Open 2-3, doi:10.1016/j.jmro.2020.100004 (2020).
[17] Jansen, I. H. et al. Simultaneous Imaging of Diffusion and Coherent Motion in Slow-Flow Compartments in the Brain. ISMRM 2020.
[18] Wang F, et al. Echo planar time-resolved imaging (EPTI). Magnetic resonance in medicine. 2019;81(6):3599-615.
[19] Dong Z, et al. Echo planar time-resolved imaging with subspace reconstruction and optimized spatiotemporal encoding. Magnetic resonance in medicine. 2020;84(5):2442-55.
[20] Wang F, et al. Simultaneous pure T2 and varying T2'-weighted BOLD fMRI using Echo Planar Time-resolved Imaging for mapping cortical-depth dependent responses. NeuroImage. 2021;245:118641.
[21] Wang F, et al. Improving fMRI acquisition using single-shot EPTI with distortion-free high-SNR high-CNR multi-echo imaging. ISMRM 2022; London.
[22] Mareyam, A., et al. A 64-Channel 7T array coil for accelerated brain MRI. in Proceedings of the International Society for Magnetic Resonance in Medicine (2020).
[23] Piechnik SK, Evans J, Bary LH, Wise RG, Jezzard P. Functional changes in CSF volume estimated using measurement of water T2 relaxation. Magn Reson Med. 2009;61(3):579-586. PMID: 19132756.
[24] Scouten A, Constable RT. VASO-based calculations of CBV change: Accounting for the dynamic CSF volume. Magn Reson Med. 2008;59(2):308-315. PMID: 18228581.
[25] Jin T, Kim SG. Change of the cerebrospinal fluid volume during brain activation investigated by T(1rho)-weighted fMRI. NeuroImage. 2010;51(4):1378-1383. PMID: 20338251.
[26] Donahue MJ, Lu H, Jones CK, Edden RAE, Pekar JJ, van Zijl PCM. Theoretical and experimental investigation of the VASO contrast mechanism. Magn Reson Med. 2006;56(6):1261-1273. PMID: 17075857.
[27] Hirschler, Lydiane, et al. Effects of the cardiac and respiratory cycles on CSF-mobility in human subarachnoid and perivascular spaces. ISMRM 2022.
[28] Bito, Yoshitaka, et al. Low b‐value diffusion tensor imaging for measuring pseudorandom flow of cerebrospinal fluid. Magnetic Resonance in Medicine 86.3 (2021): 1369-1382.
[29] Mokri B. The Monro–Kellie hypothesis: applications in CSF volume depletion. J Neurology. 2001;56(12):1746-8.
Figures