1187
Quantitative phase-contrast CSF-flow interleaved with cortical BOLD to measure glymphatic function via BOLD-CSF coupling1Radiology, Leiden University Medical Center, Leiden, Netherlands, 2Equal contribution, ., Netherlands
Synopsis
Keywords: Neurofluids, Neurofluids, Glymphatics
Motivation: CSF-mediated brain waste clearance is implicated in proteinopathies such as Alzheimer’s disease. A better understanding of clearance mechanics is needed to understand pathological processes.
Goal(s): To quantify flow- and pulsatility dynamics of CSF-motion in the 4th-ventricle using real-time phase contrast (rtPC) with interleaved BOLD-imaging while manipulating flow.
Approach: rtPC is first interleaved with inflow-sensitized EPI to prove the same CSF-fluctuations are captured. Then, we show BOLD-CSF coupling between rtPC and cortical BOLD as well as between inflow-EPI and cortical BOLD during breathing and visual-stimulation paradigms.
Results: rtPC improves characterization of CSF-flow in the 4th-ventricle compared to traditional BOLD-sequences, showing more coherent BOLD-CSF coupling.
Impact: Clinical MR studies are increasingly looking at changes in BOLD-CSF coupling in patient populations as a measure of brain clearance efficiency. By interleaving phase contrast acquisitions with BOLD, we quantify CSF flow dynamics and obtain more robust BOLD-CSF measurements.
Introduction
Recently, a direct link between cerebrospinal fluid (CSF) fluctuations in the 4th-ventricle with low-frequency hemodynamic oscillations in the cortex was found using an accelerated resting-state fMRI sequence1,2. This MRI-technique is based on fresh CSF inflow (feet-head) into the bottom slice of the imaging volume. It therefore cannot capture CSF outflow dynamics nor measure flow quantitatively. Quantifying CSF flow in real-time could elucidate CSF flow dynamics and potentially provide a better picture of the interaction between CSF and BOLD fluctuations coupling. Hence, we accelerated a real-time phase contrast (rtPC)3 sequence planned on the 4th-ventricle and interleaved each dynamic with cortical BOLD echo-planar imaging (EPI). We show that rtPC and inflow-sensitized EPI scans in the 4th-ventricle measure similar CSF dynamics and compare the BOLD-CSF coupling of both approaches.Methods
Five healthy volunteers (age= 27±4y, 2 female) signed informed consent and laid supine in a 7 Tesla Philips (Best, The Netherlands) MR scanner (dual-transmit, 32-channel receive coil (Nova Medical Inc.)). Respiration signal, pulse plethysmography and a full-brain anatomical scan were acquired. We first interleaved rtPC with an inflow-sensitized EPI, both positioned on the 4th-ventricle for direct method comparison (experiment 1, Fig.1). Subsequently, the following sets of sequence combinations were used during a breathing task (experiment 2), a visual stimulation (experiment 3) and at rest (experiment 4):- rtPC positioned on the 4th-ventricle interleaved with a BOLD scan positioned on the cortex for capturing cortical hemodynamic fluctuations
- a standard inflow-sensitized EPI for BOLD-CSF coupling for comparison.
500 dynamics (+10 dummies) were acquired for each scan (2.58 min per scan). All inflow-sensitized EPI scans (TR/TE=348/22ms, FA=30°, resolution=2.5x2.5x3mm3, FOV=190x230x63mm3, 21 slices, EPI-factor=45, SENSE=2, multiband-factor=3) were aligned perpendicular to the midsection of the 4th-ventricle. rtPC-BOLD interleaved scans were acquired with a 10mm 2D rtPC slab centered on the 4th-ventricle coinciding with the lowest inflow-EPI slice (VencFH=5cm/s, TR/TE=7.8/5.7ms, Tdyn=202ms, FA=4°, FOV=110x110mm, resolution=2x2mm, SENSE=3, partial-Fourier=70%). The interleaved BOLD-EPI volumes were centered on the visual cortex (parameters: TR/TE=146/22ms, FA=30°, resolution=2.5x2.5x3mm voxels, FOV=190x230x27mm, 9 slices, EPI-factor=31, SENSE=3, multiband-factor=3). The combined dynamic scan time of the interleaved sequences matched the inflow-sensitized EPI TR.
Paced breathing drives CSF dynamics, as seen on rtPC3, so we visually guided paced breathing (5s in, 5s out) to drive respiratory-linked CSF fluctuations. Additionally, as BOLD-CSF coupling is shown to be manipulated by visual stimulation1, an 8Hz-flickering checkerboard was shown to induce visual cortex functional hyperemia (10s-ON, 10s-OFF) using PsychoPy4.
Cortex ribbon and visual area were segmented (FreeSurfer5). BOLD-EPI (pre)-processing included motion-correction (SPM12), demeaning and detrending, filtering (if indicated), and negative temporal derivative estimation (-ΔBOLD/dt). Negative values in -ΔBOLD/dt were set to zero before cross-correlation with inflow-EPI, but not for rtPC since the latter allows measurement of flow in both directions. 4th-ventricle masks were delineated on the time-averaged lowest slice of the inflow-EPI and PC magnitude image. Spectral analysis was performed using five-taper2 Fourier transform (Chronux toolbox6).
Results and Discussion
By directly interleaving rtPC and inflow-EPI at the 4th-ventricle level during a paced breathing paradigm, we show that both methods can capture similar signal patterns, including cardiac pulsations, respiratory and low-frequency oscillations (Fig.2A&B). rtPC CSF signal is mainly cardiac driven, as expected from previous research3. In separate paced breathing inflow-EPI and rtPC scans, signal correspondence remains high between CSF measurements (Fig.2D) but with a slight time lag of the inflow-EPI (Fig.2C).Paced breathing modulated CSF dynamics and lead to changes in BOLD during inspiration (Fig.3), as dictated by the Monroe-Kelly doctrine. During this paradigm, rtPC provided stronger and more coherent BOLD-CSF coupling across participants (Fig.3B) than inflow-EPI (Fig.3D). The “bimodal” CSF peaks across blocks as observed in inflow-EPI scans could be explained by tissue shifting following inspiration.
During visual stimulation, cardiac signals dominate the unfiltered BOLD timeseries in the visual cortex (Fig.4A&B). Nonetheless, coupling to CSF-flow in the 4th-ventricle and -ΔBOLD/dt could be observed, indicating an effect of neurovascular coupling on CSF flow.
Paced breathing did not directly improve BOLD-CSF coupling compared to rest, possibly due to increased tissue motion that made extracted signals from the static cortical and 4th-ventricle masks more variable.
Conclusion
We demonstrated that real-time phase contrast (rtPC) MRI can be interleaved with inflow-EPI, and showed that both methods acquire similar CSF pulsation patterns in the 4th-ventrivbe. The quantitative nature and the insensitivity to B0 fluctuations of rtPC is an important advantage when studying BOLD-CSF coupling. In multiple experiments, rtPC captured BOLD-CSF coupling better than inflow-sensitized EPI, overcoming the inflow-pulse limitations of EPI to reliably show signal correspondence between BOLD and CSF during in- and out-flow dynamics.Acknowledgements
This project was made possible by grants from the Dutch research council (NWO), the joint program neurodegenerative diseases (JPND-program human brain clearance imaging) and Alzheimer Netherlands.References
1. Williams, S. D. et al. Neural activity induced by sensory stimulation can drive large-scale cerebrospinal fluid flow during wakefulness in humans. PLoS Biol 21, (2023).
2. Fultz, N. E. et al. Coupled electrophysiological, hemodynamic, and cerebrospinal fluid oscillations in human sleep. Science 366, 628-63 (2019).
3. Yildiz, S. et al. Quantifying the influence of respiration and cardiac pulsations on cerebrospinal fluid dynamics using real-time phase-contrast MRI. J Magn Reson Imaging 46, 431–439 (2017).
4. Peirce, J. et al. PsychoPy2: Experiments in behavior made easy. Behav Res Methods 51, 195–203 (2019).
5. Fischl, B. FreeSurfer. NeuroImage 62, 774–781 (2012).
6. Bokil, H., Andrews, P., Kulkarni, J. E., Mehta, S. & Mitra, P. P. Chronux: A platform for analyzing neural signals. J Neurosci Methods 192, 146–151 (2010).
Figures
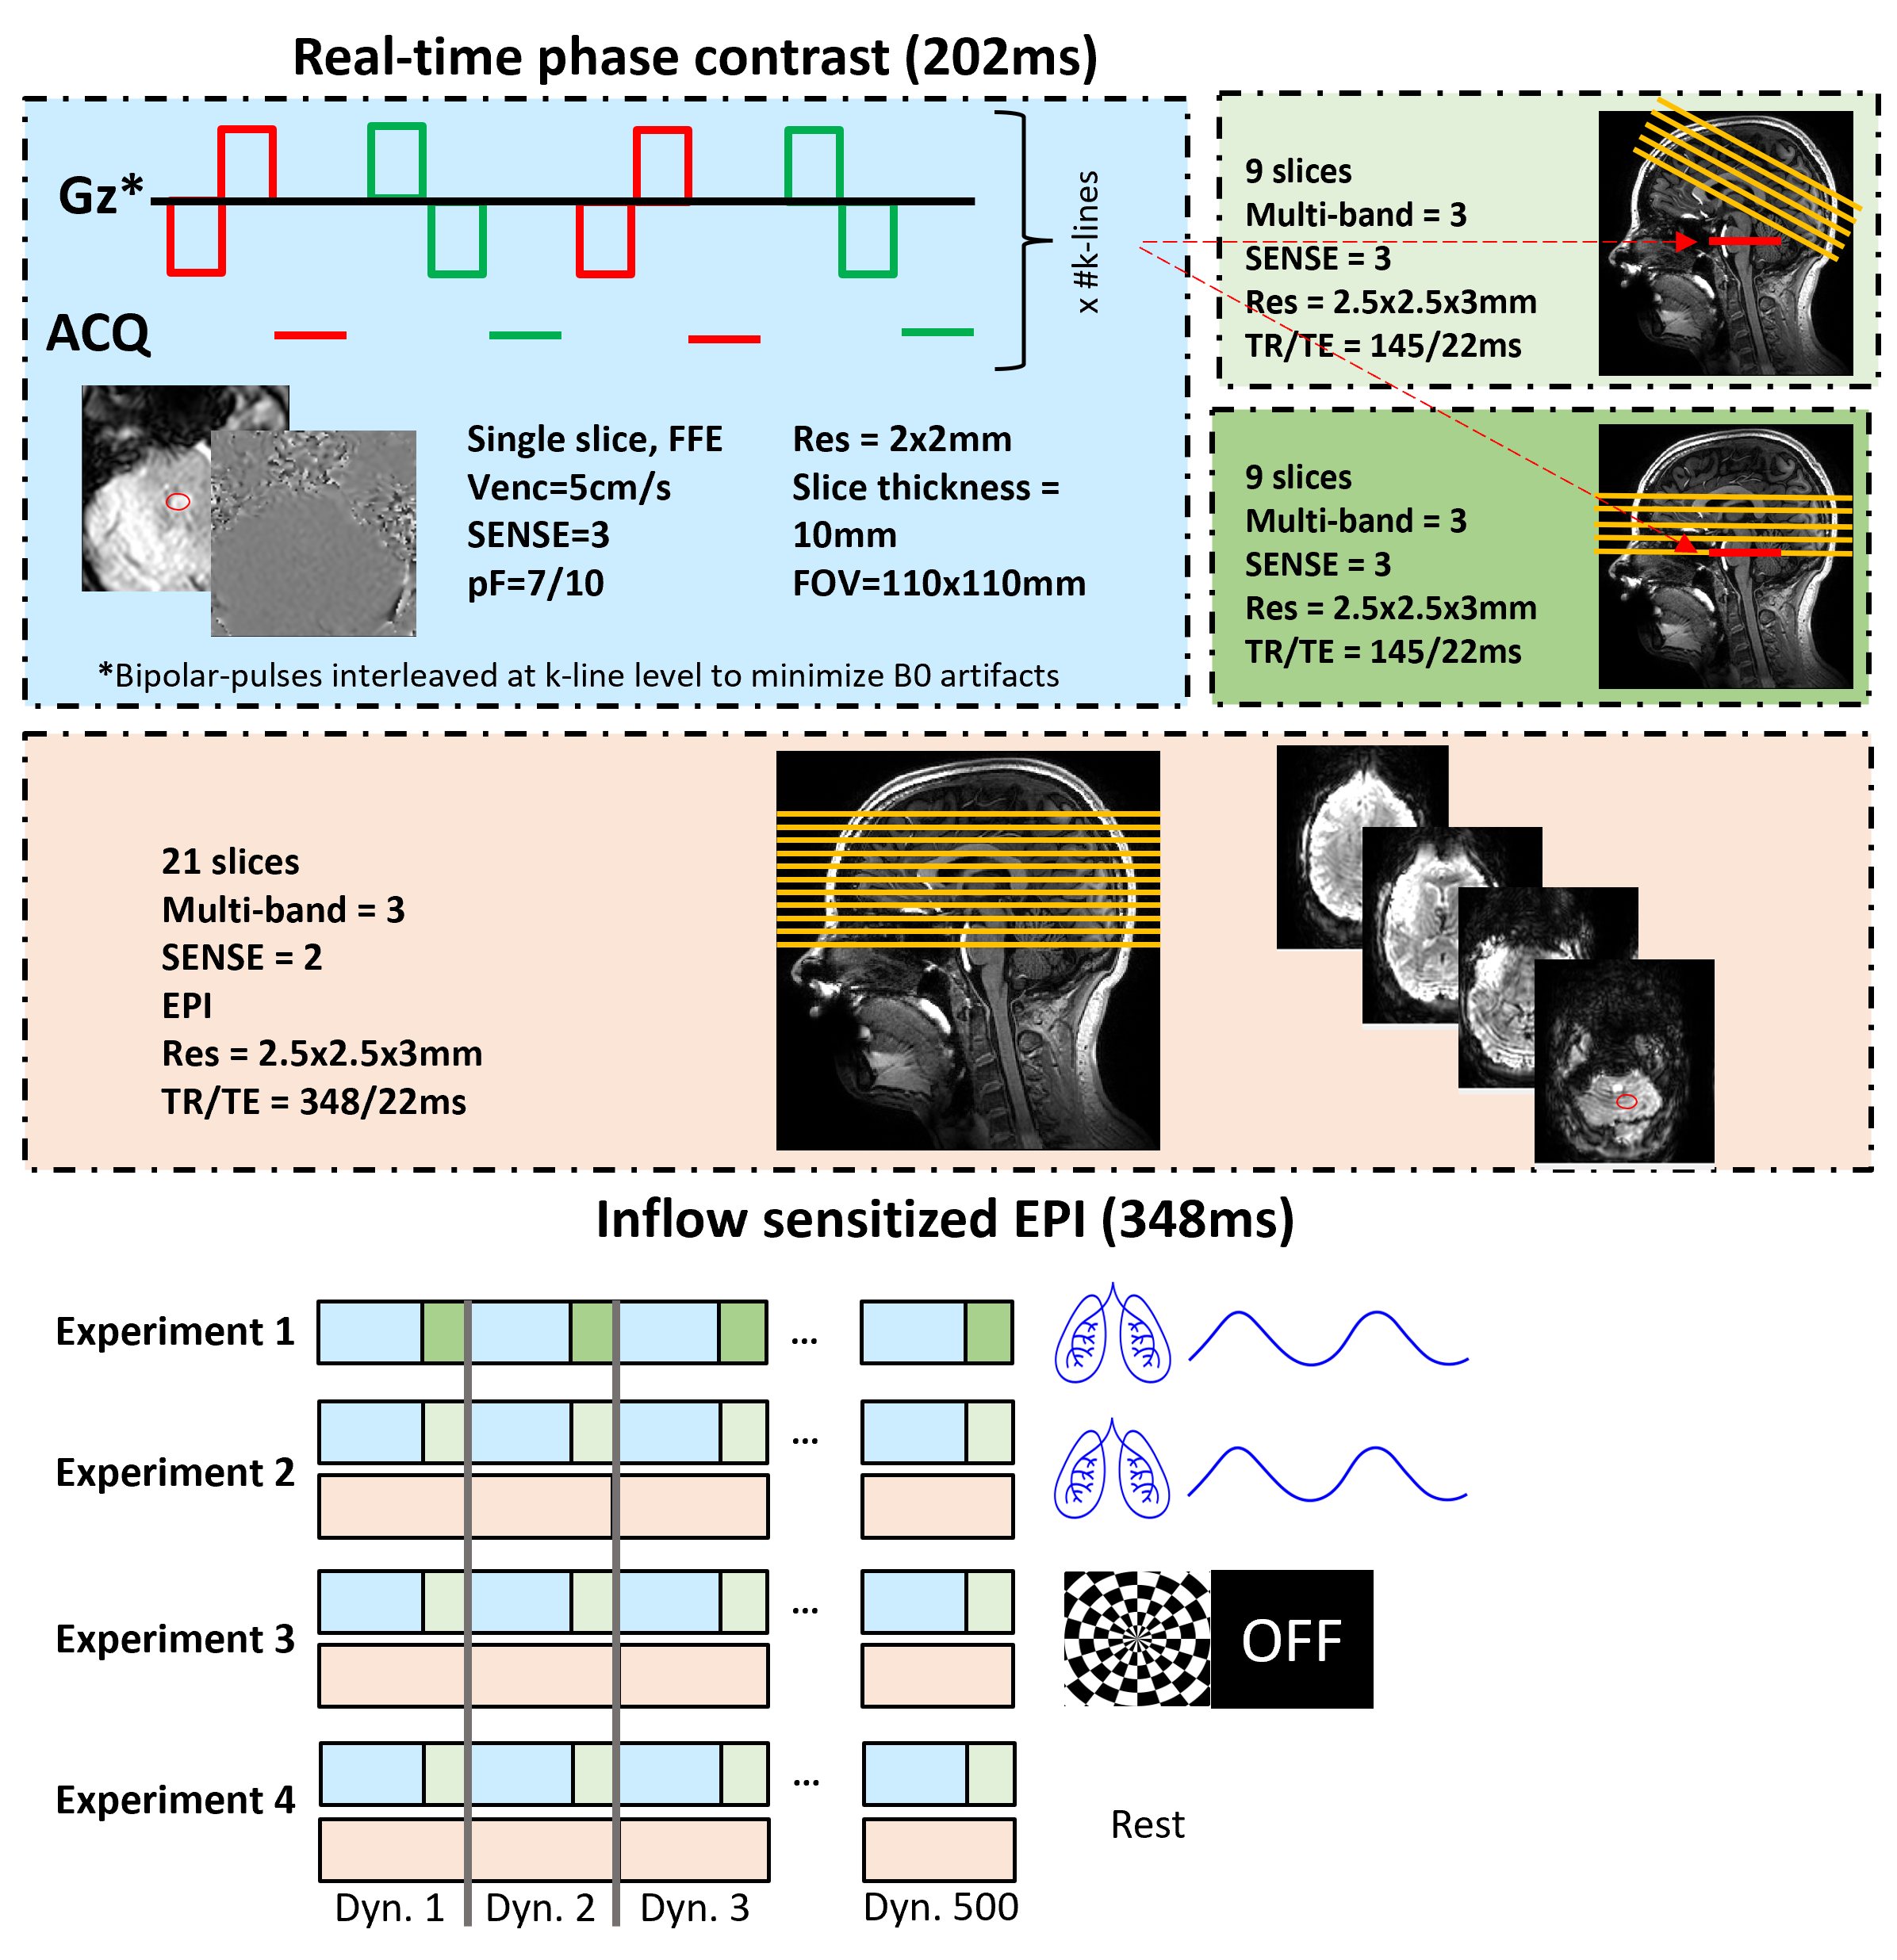
Figure 1. Schematic of the sequence diagram, timings and experiment setup. Experiment 1 used an interleaved real-time phase contrast (rtPC, light-blue) and inflow-EPI sequence (dark-green) to compare CSF measurements at the 4th-ventricle level. Experiments 2-4 used both interleaved rtPC & cortical BOLD and inflow-sensitized EPI & cortical BOLD acquisitions to measure BOLD-CSF coupling during paced breathing and visual stimulation paradigms. Gradient-echo rtPC was chosen over an EPI readout to minimize aliasing artefacts from SENSE, and partial Fourier factors.
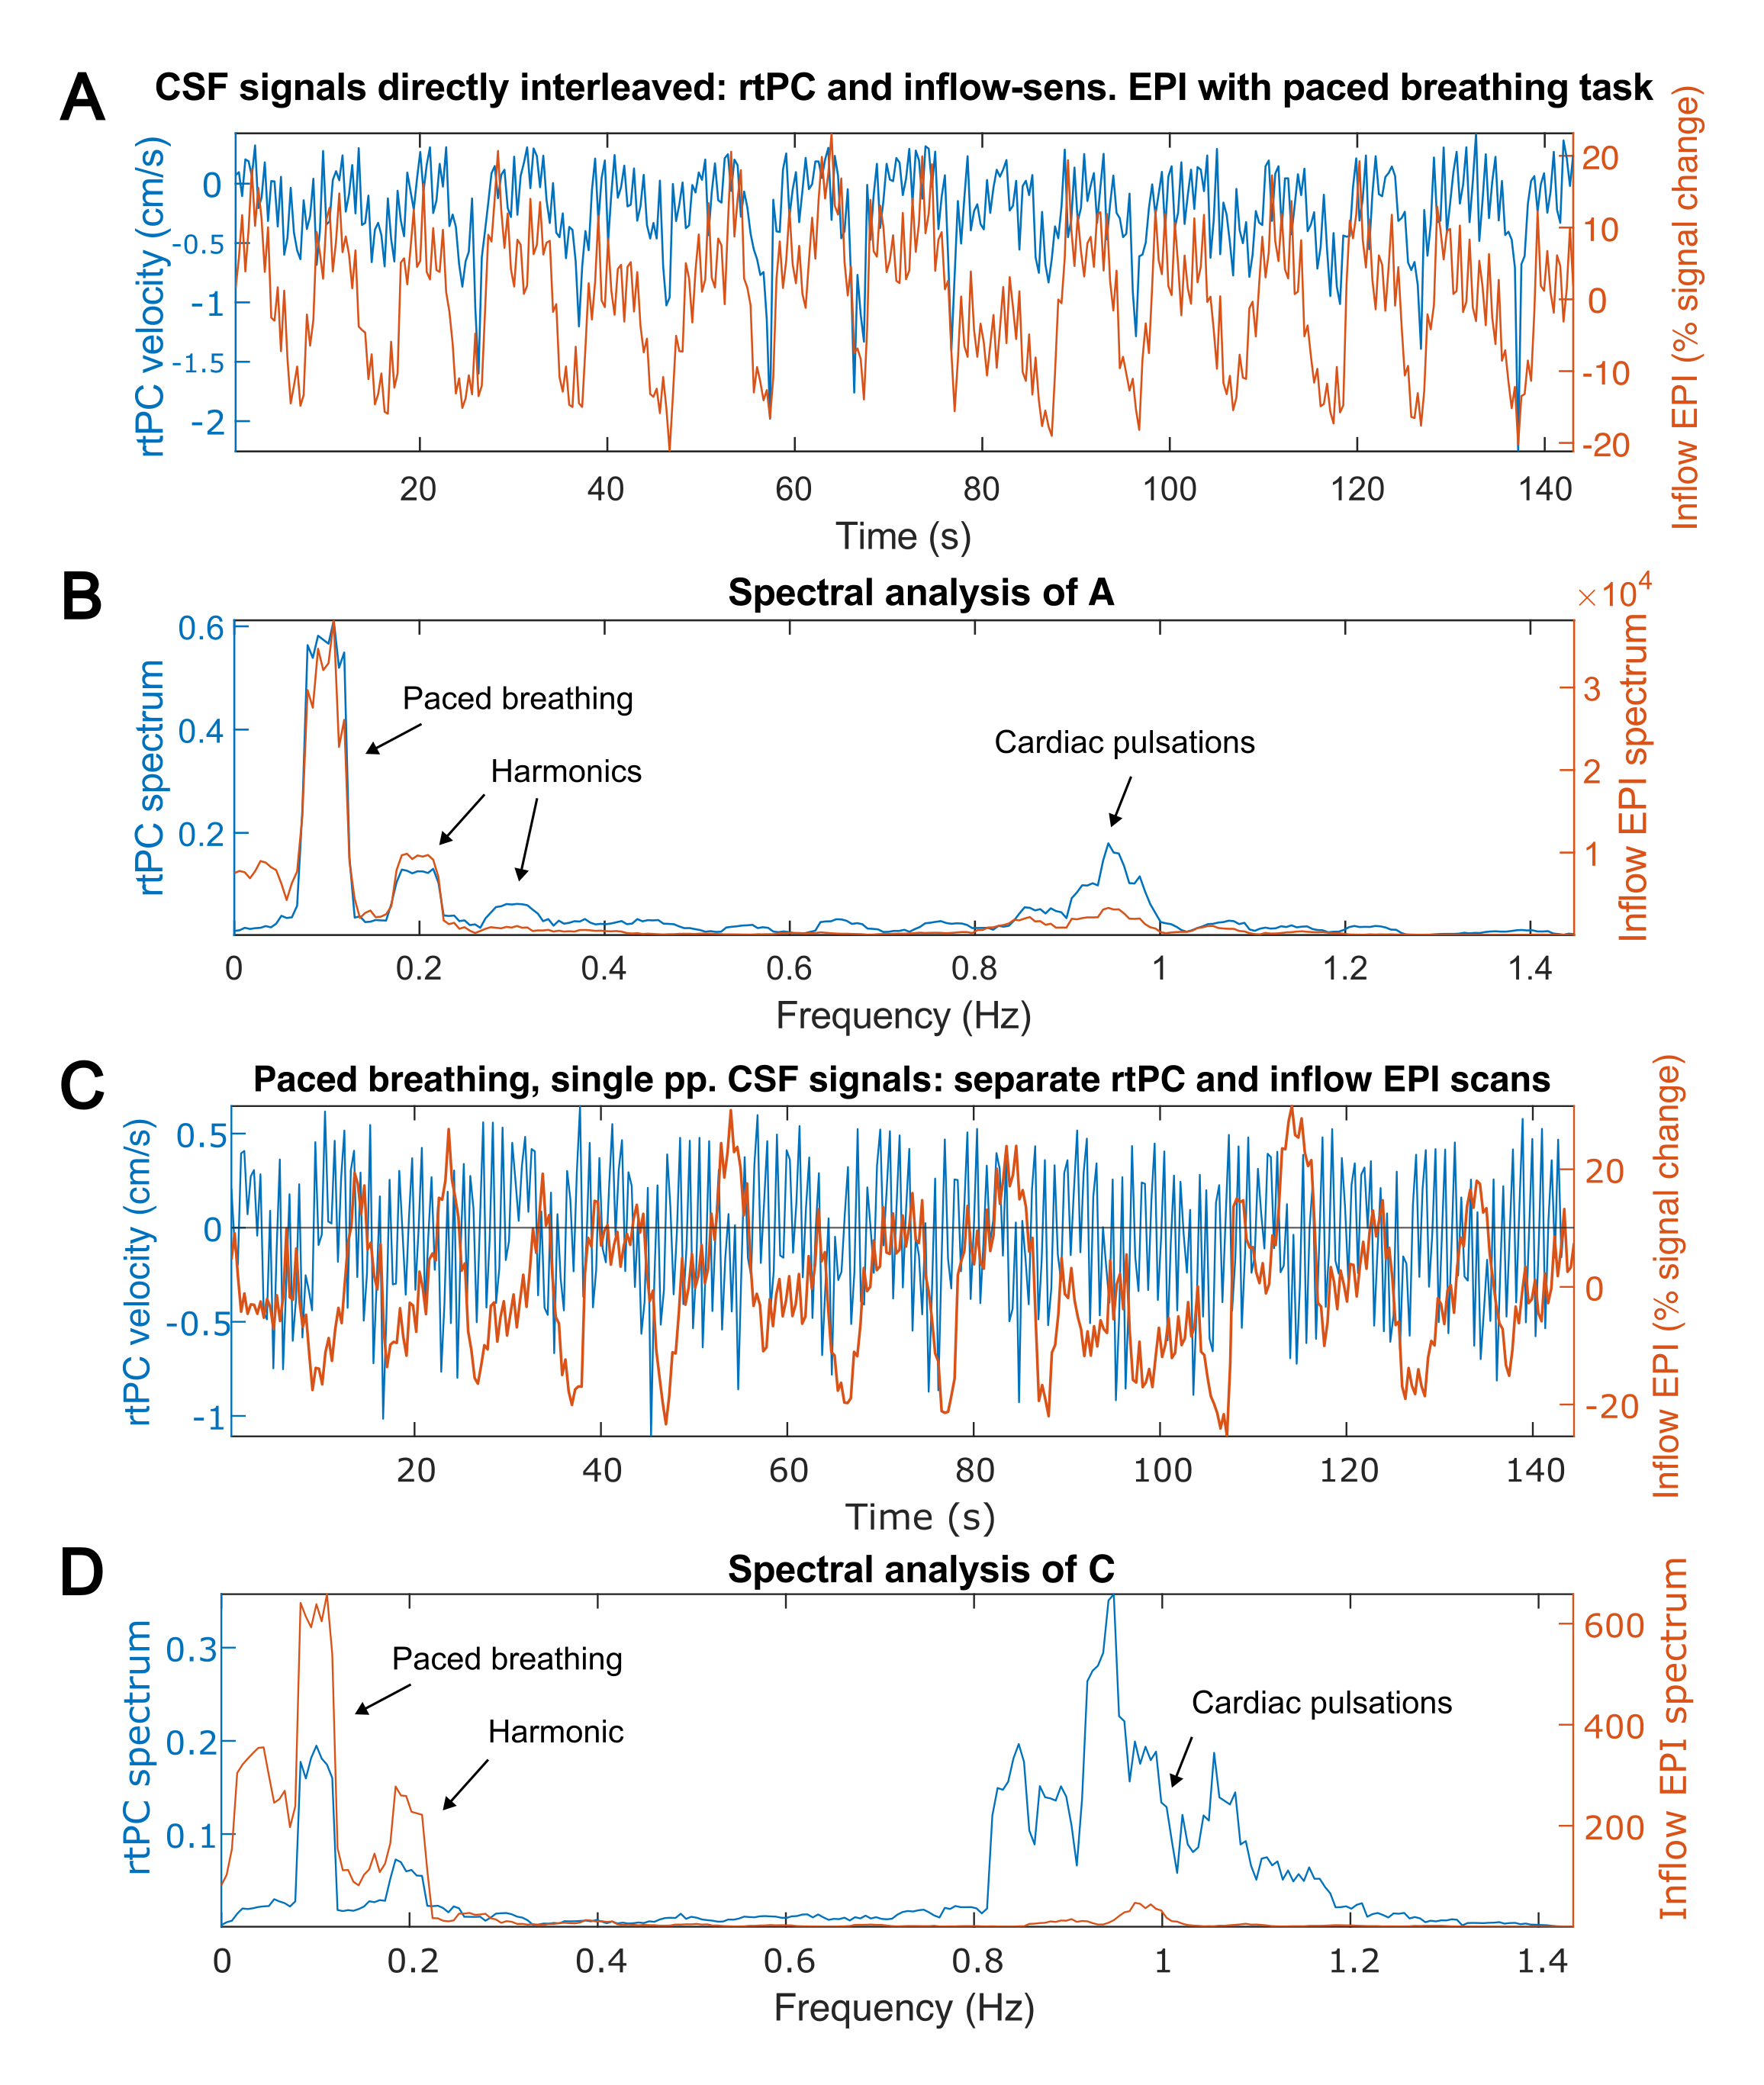
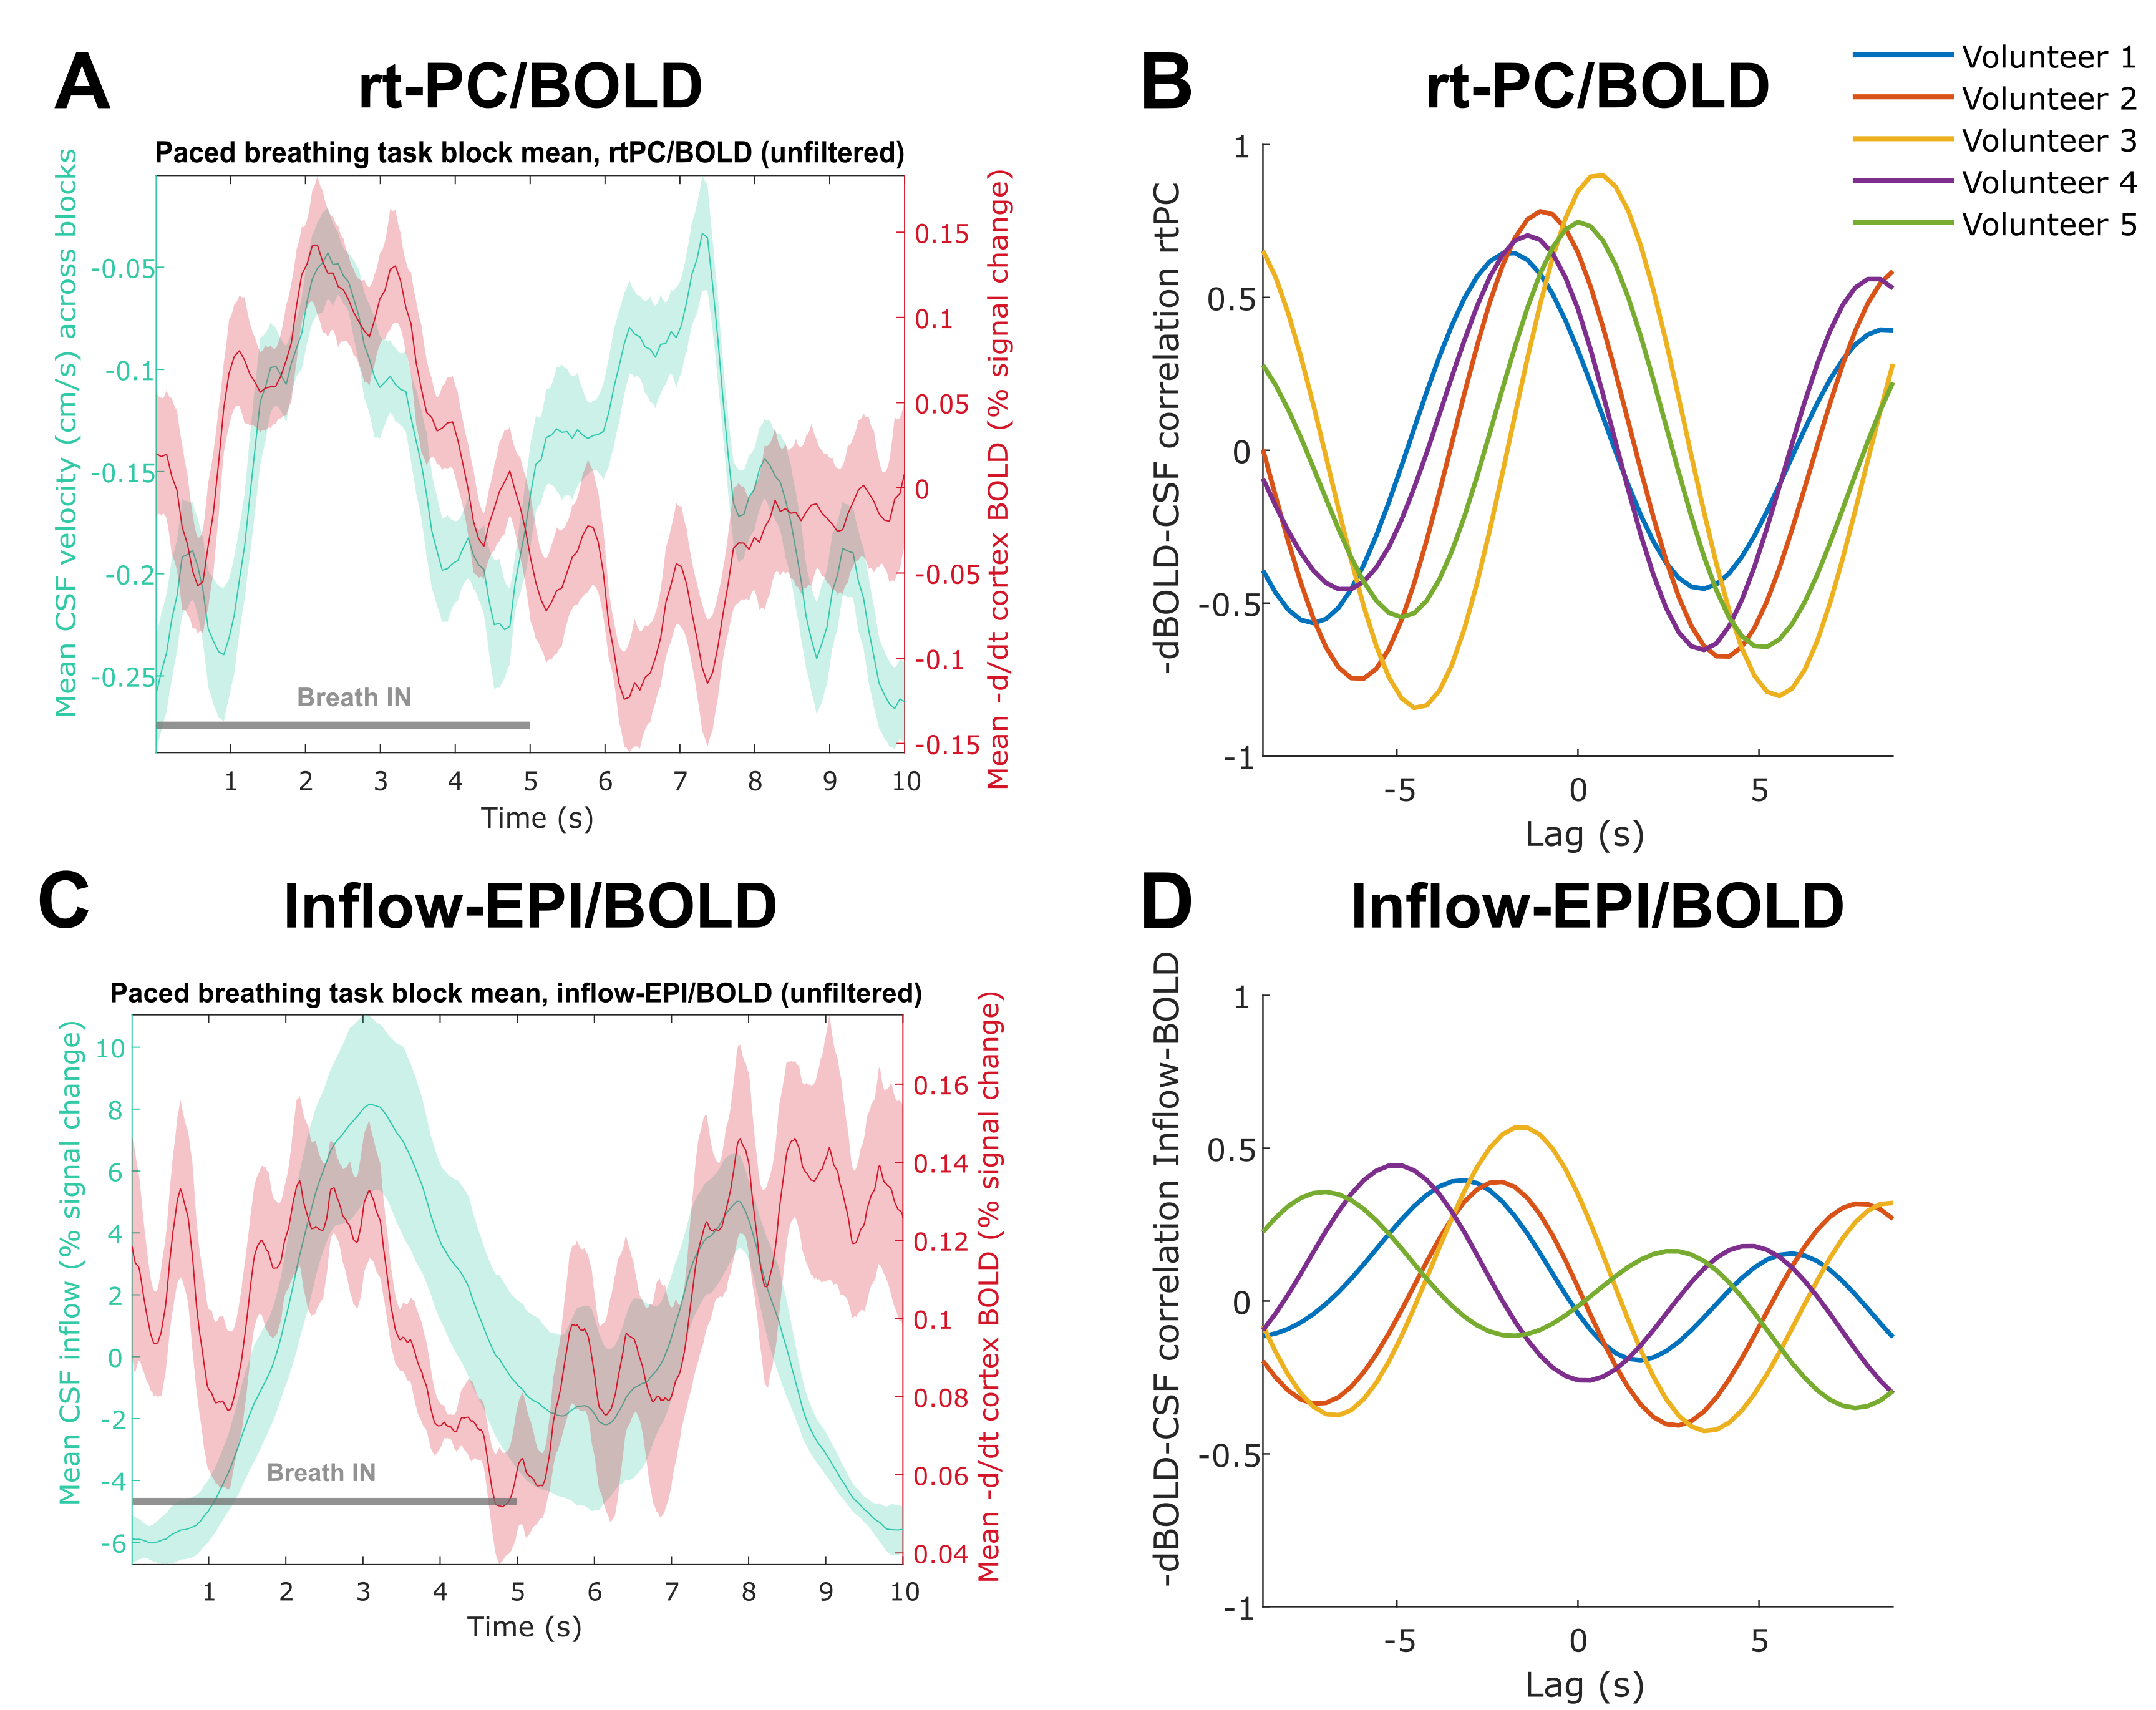
Figure 3. CSF (cyan) and negative derivative of cortical BOLD (-ΔBOLD/dt, magenta) signals averaged over breathing paradigms and participants (n=5) measured using (A) rtPC/BOLD and (C) inflow-EPI/BOLD. Coupling between CSF and -ΔBOLD/dt in individual volunteers measured with (B) rtPC/BOLD and (D) Inflow-EPI/BOLD, colors indicate different participants. rtPC provides improved characterization of CSF-flow in the 4th-ventricle compared to traditional inflow-BOLD, as shown by stronger coupling and a lower spread between volunteers in the BOLD-CSF coupling.
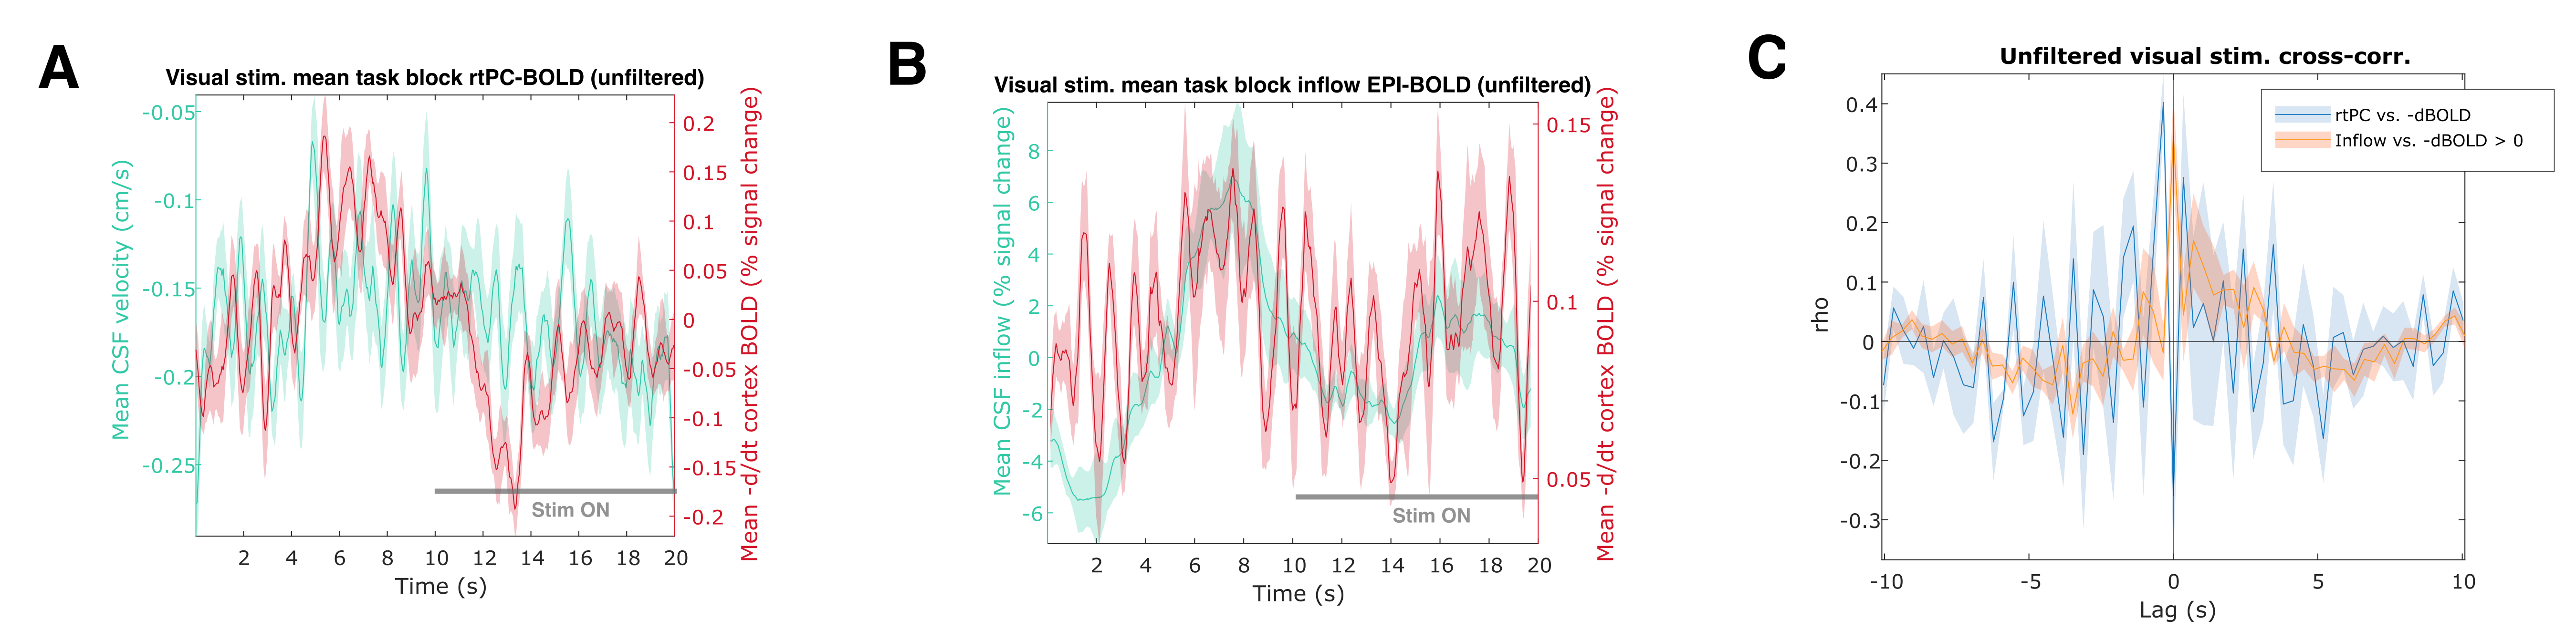
Figure 4. Signal averages across visual task blocks and participants (n=5). Visual stimulation paradigm was 10s ON, 10s OFF, providing a 20-second window of alternating CSF and cortical BOLD flow patterns. A: Block average for the rt-PC (cyan) and interleaved -ΔBOLD/dt (red). B: Block average for inflow-sensitized EPI (cyan) and cortical BOLD (red). C: 20s cross-correlation window showing more coherent BOLD-CSF coupling for rtPC-BOLD interleaving (blue, r=0.4, lag=-0.35s) than for inflow-sensitized EPI BOLD (orange, r=0.35, lag=0s).
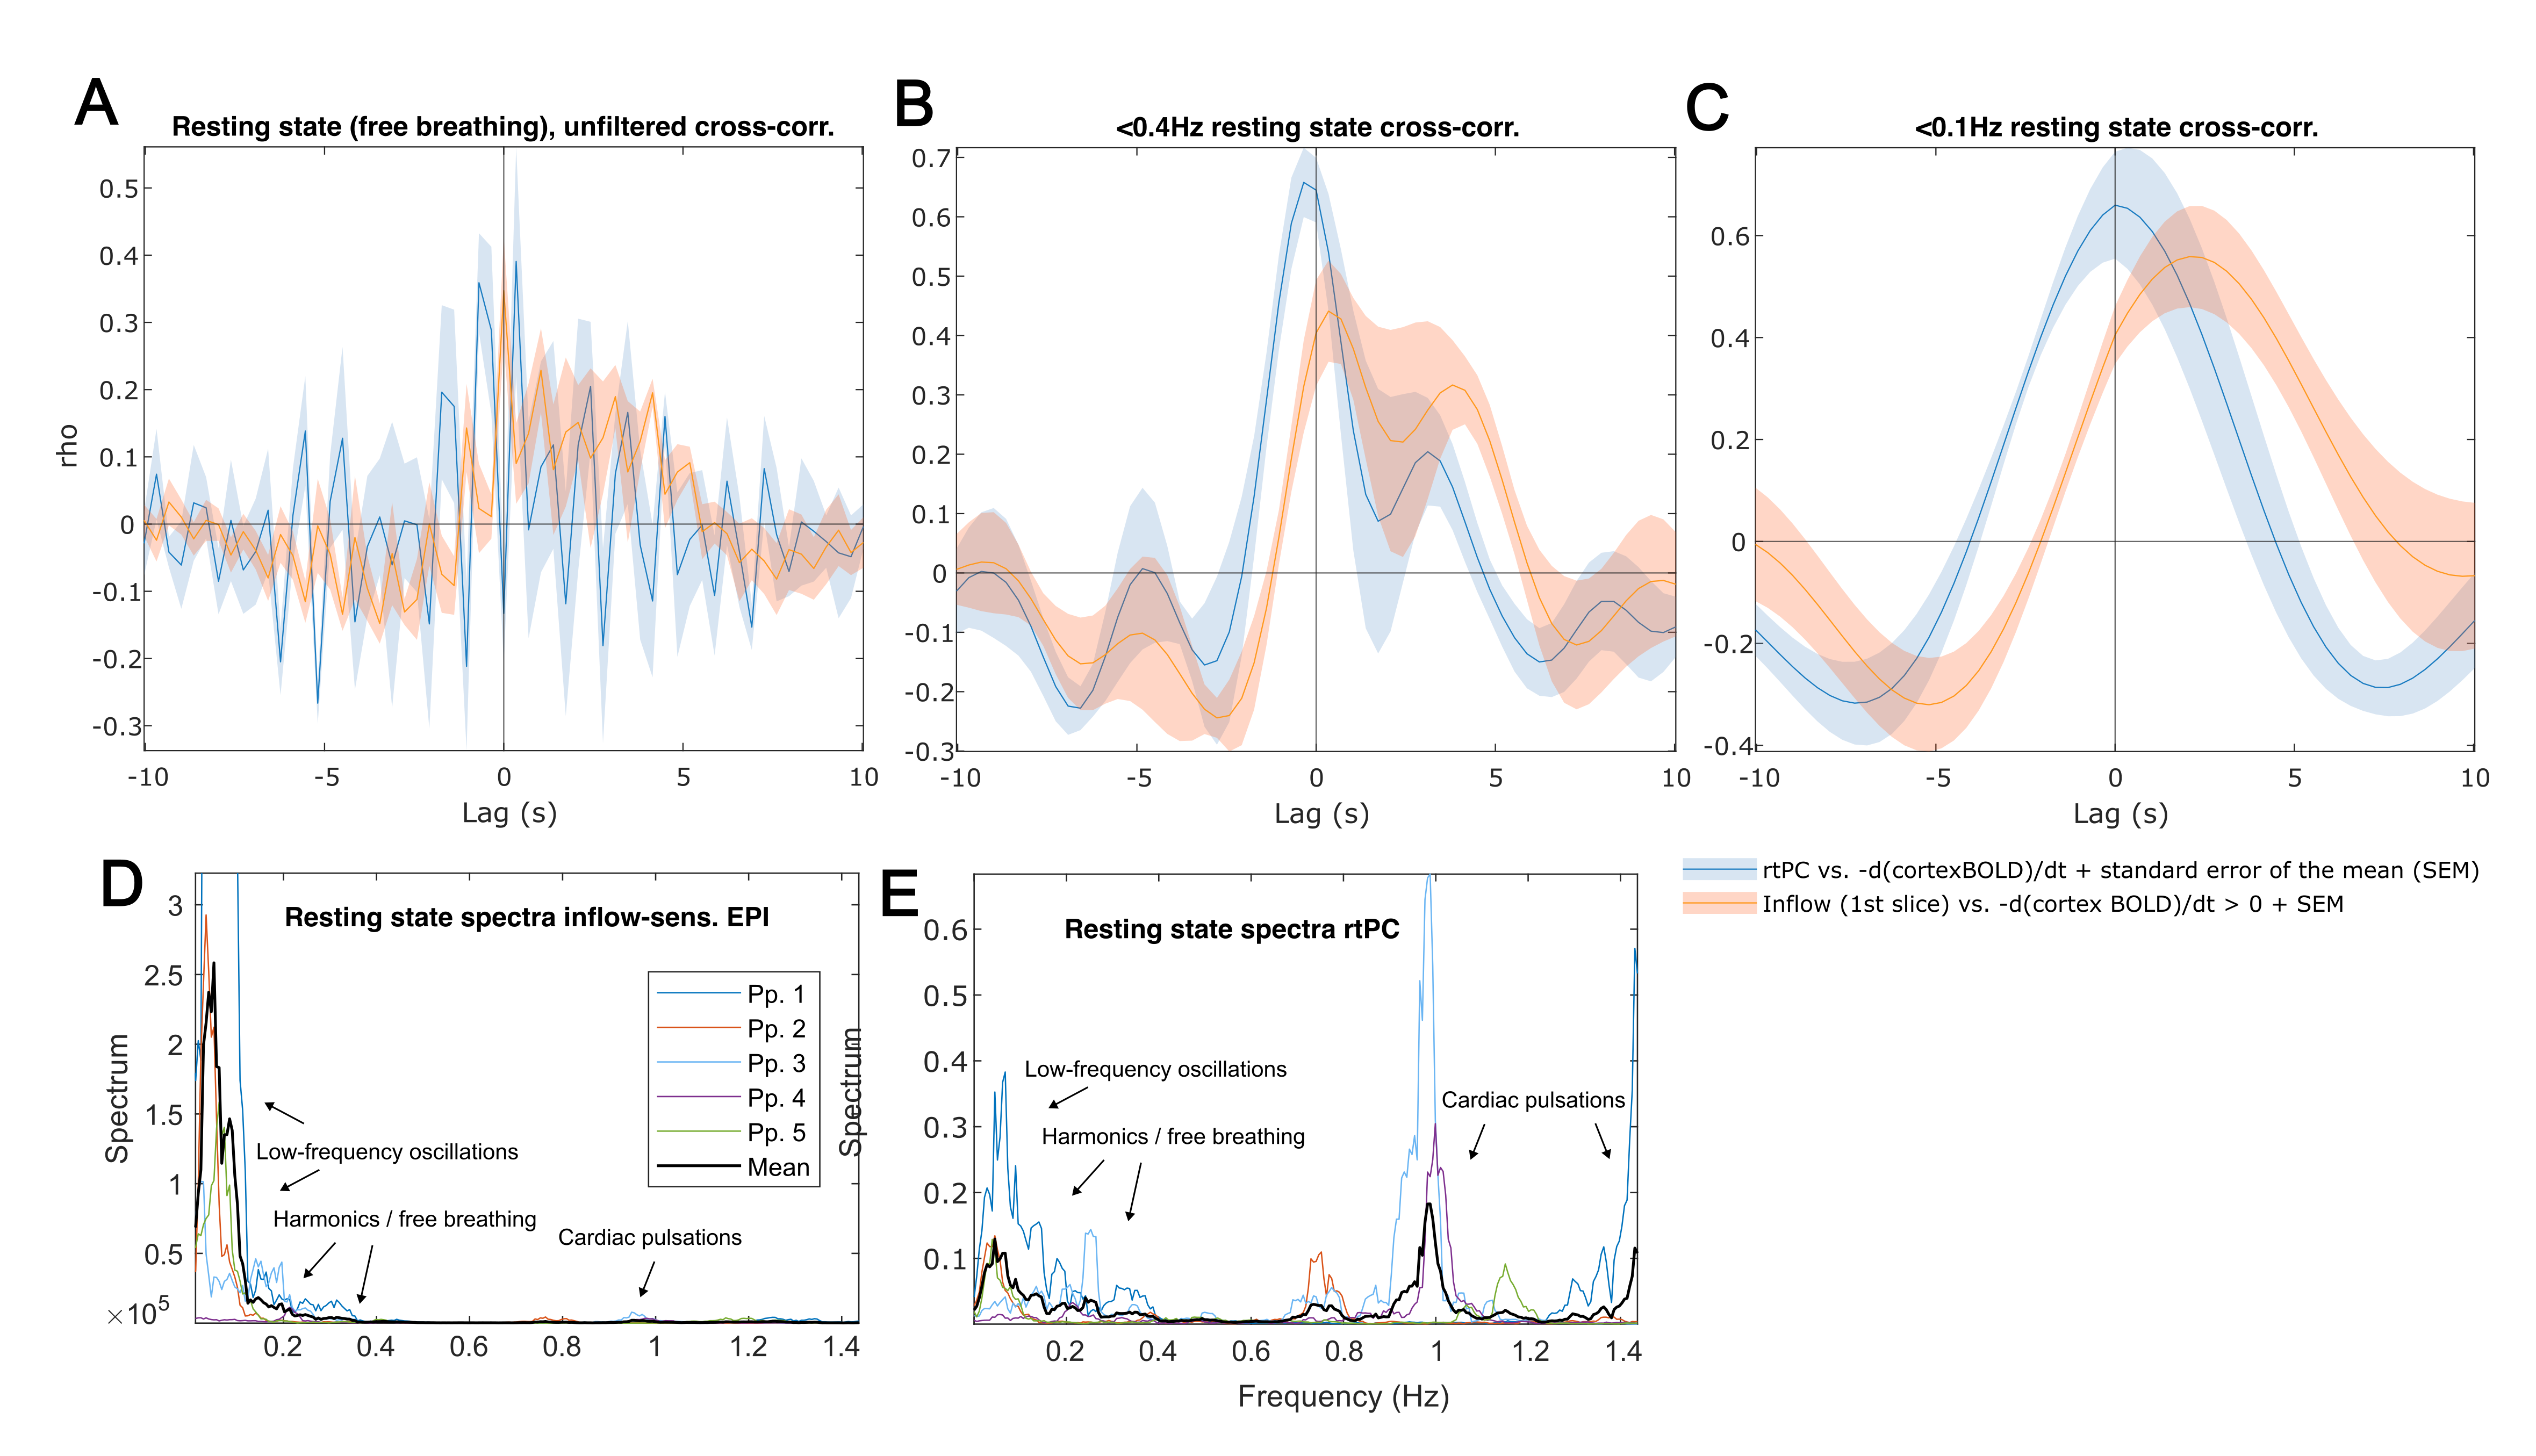
Figure 5. Resting state BOLD-CSF coupling coherence. A: Averaged (n=5) rtPC time-shifted cross-correlations with interleaved cortical BOLD compared to inflow-EPI and -ΔBOLD/dt. As shown in Fig. 2, CSF signals and especially rtPC are mostly cardiac-driven (FH flow: 0.6 to -1.3 cm/s). B: Signals were <0.4Hz low-pass filtered to aid between-scan comparability. C: <0.1Hz filters for low-frequency oscillations show similar max-peaks but higher between-scan lags (2.1s). Note that max-rho lags between scan types seems to increase as a function of the lower filter threshold.