1185
Impact of jugular vein ligation on cerebrospinal fluid clearance from G-lymphatic system in mice1Institut du Cerveau – Paris Brain Institute - ICM, Sorbonne Université, INSERM, CNRS, Paris, France, 2Centre de NeuroImagerie de Recherche – CENIR, Paris, France, 3Department of Neurology, Yale University School of Medicine, New Haven, CT, United States, 4Department of Neuroradiology, AP-HP, Pitié-Salpetrière, Paris, France
Synopsis
Keywords: Neurofluids, Neurofluids
Motivation: Cerebral venous outflow abnormalities have been linked to various neurological disorders, necessitating a detailed understanding of their impact on brain and lymphatic perfusion. This study aimed to investigate the G-lymphatic system change following bilateral jugular vein ligation (JVL) in mice.
Goal(s): Deeper understanding of the venous system's role in CNS fluid homeostasis.
Approach: JVL was performed in mice. 2D-TOF, DCE-FLASH and 3D-MGE imaging were acquired at baseline, 2, 7 and 14-days post-surgery. Quantitative analysis was used to assess changes in lymphatic flow, brain volumetry.
Results: JVL induced hypertension, bigger brain and veinous system. The permeability in the brain reduced before returning to baseline.
Impact: Our study demonstrated progressive alterations in cerebral blood flow in mice following jugular vein ligation, highlighting the utility of MRI for studying the G-lymphatic system in brain. These findings contribute to a better understanding of cerebrovascular changes in living conditions.
Introduction
Meningeal vessels (MLVs) are small vascular channels located in the perisinus, a specific region of the cranial dura mater surrounding the dural venous sinuses. The perisinus has recently been identified as a neuro-immune interface1,2 where waste fluids from the brain, immune cells from the bone marrow, circulating blood, and cerebrospinal fluid (CSF) converge. The collected waste fluids and blood are then drained into the systemic circulation by dural lymphatic and dural venous sinuses.Despite recent advances in understanding the vascular-perivascular coupling in the G-lymphatic system in the brain, the relationship between venous circulation and CSF outflow in the dura mater remains poorly understood. To gain a deeper understanding of the venous system's role in CNS fluid homeostasis, our research aims to investigate how cerebral venous outflow obstruction impacts blood-CSF barriers and CNS fluid circulation in mice.
Materials and Methods
Jugular vein ligation (JVL): 20 C57/BL6 female mice aged between 2 and 4 months under general anesthesia received bilateral internal and external JVL to induce intracranial hypertension3.MRI Acquisition: Mice were imaged using an 11.7T MRI system (Bruker, Germany) equipped with a 1H transmit-receive-surface cryoprobeTM. Seven mice were imaged at baseline and 7-days after surgery and 6 were imaged at 2 and 14-days after surgery. Imaging consisted in 2D time-of-flight (TOF), 2D dynamic contrast enhancement (DCE-FLASH) and 3D Multigradient echo (MGE).
TOF images were acquired with TR/TE=24.40/3.13ms, FA=80°, BW=125kHz, 80 interlaced slices with 100µm slice gap, slice thickness=300µm, flow saturation band of 300µm placed outside the brain at 1 mm behind the FOV on sagittal orientation, FOV=15.36*15.36mm2, in-plane resolution=60*60µm2, 2 repetitions, acquisition time=17min.
T1w perfusion sequence was optimized to get better spatial resolution while keeping the best temporal resolution with TR/TE=38.0/1.2ms, temporal resolution=2.8s , FA=15°, BW=125kHz, 10 slices with 1mm slice gap, slice thickness=800µm, FOV=12.8*14.8mm2, Matrix size=64*74, in-plane spatial resolution=200*200µm2, 250 repetitions, acquisition time=12min. Perfusion was achieved by injecting intravenously 400μL of Gadobutrol (0.5mmol/ml) with an infusion rate of 50μL/s.
3D Multi gradient echo (MGE): TR/TE=40/1.75 ms, TE1/ΔTE/TE6=1.75/1.8/10.75ms, FA=15°, BW=200kHz, FOV=19.2*14.4*9.6mm3, Matrix size=192*144*96, 100µm isotropic spatial resolution, acquisition time=9min.
MRI analyses : Manual segmentations were performed to delineate venous system (2D-TOF), brain and ventricles (T2*w-MGE) using 3D-Slicer. The signal intensity of the T1w images in different brain areas was fitted to the Toft’s and Kermode4 model to estimate Ktrans.
Intracranial pressure measurement (ICP) and immunofluorescence: ICP was measured on a different cohort with sham and 7, 14 and 28-days after JVL by inserting a pressure sensor catheter perpendicularly into the cortex. After ovalbumin (OVA) injection into mice’s cisterna magma5, the skullcaps were co-incubated with anti-LYVES1 and anti-podocalyxin.
Results
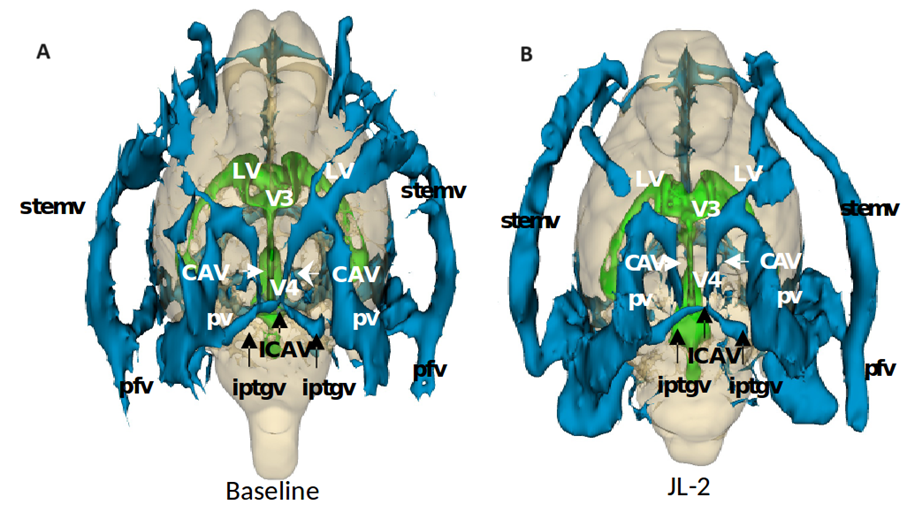
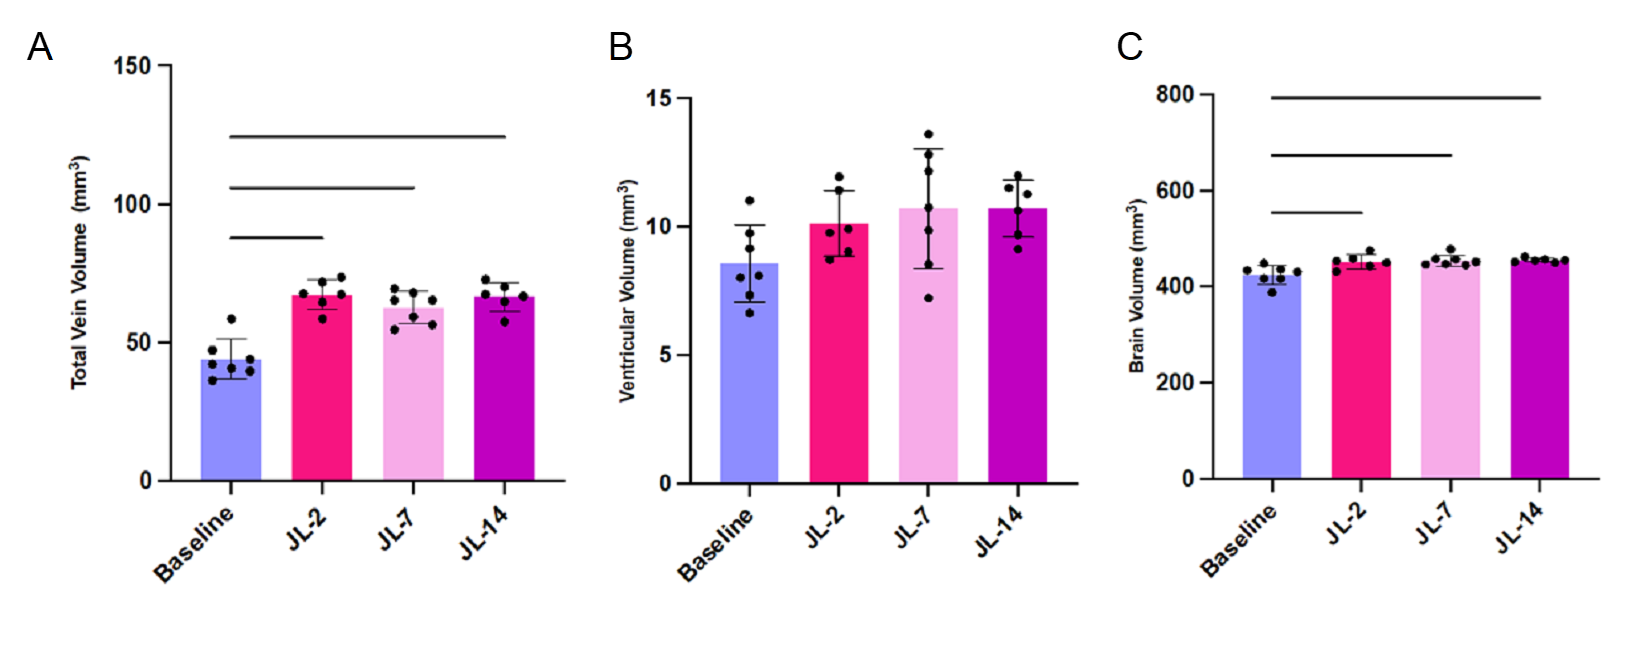
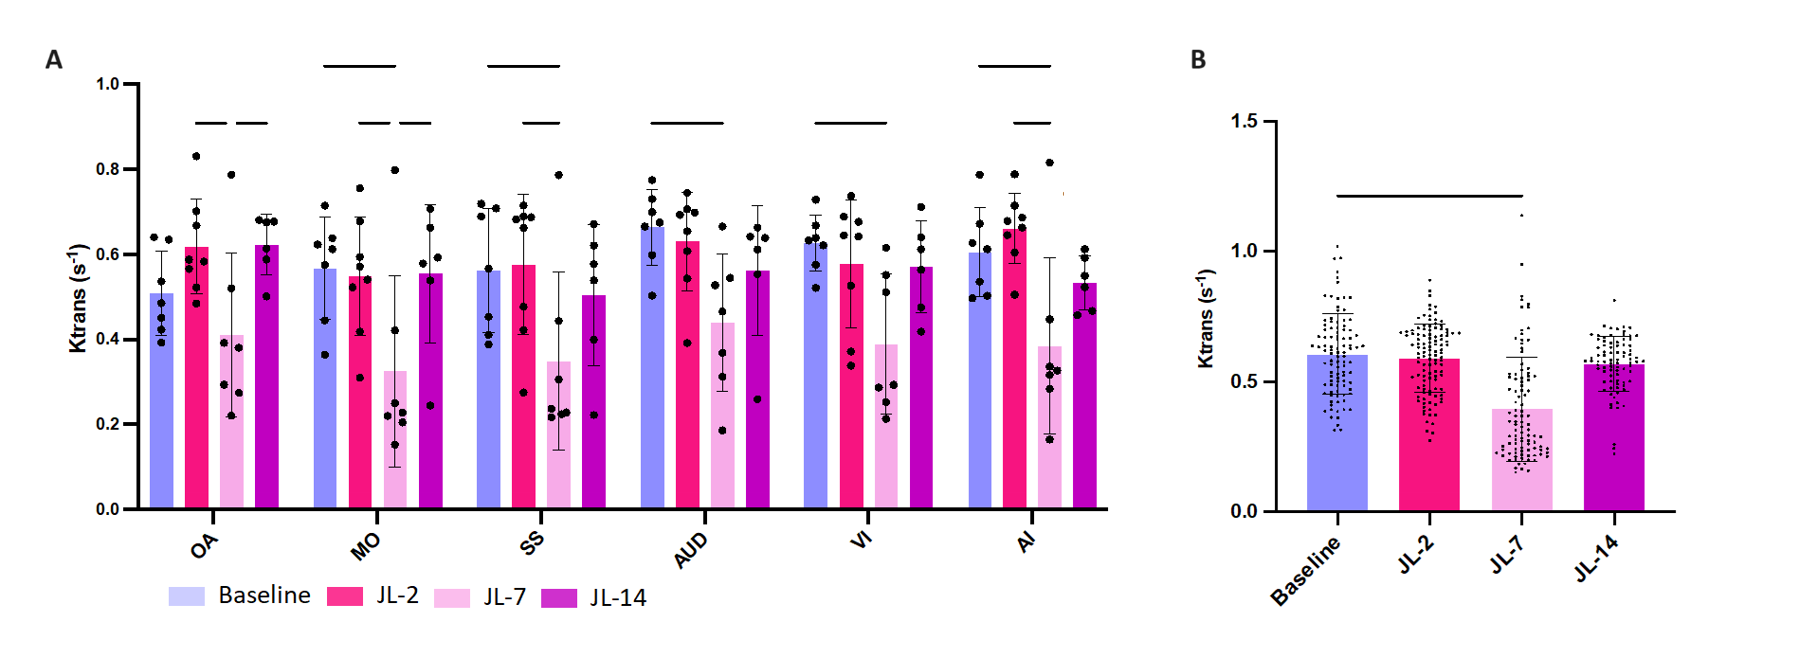
Venous, brain and ventricular volumes: Following the ligation, the venous volume in the head significantly increased and remained elevated until day 14 (Fig 1). The brain volume, including brain tissue, perivascular spaces and intrinsic vasculature significantly increased from day 2 to day 14 post-surgery (Fig 2.A). Conversely, the volume of the ventricles remained unchanged (Fig 2.B).Arterial blood-CSF barrier permeability: The Ktrans value significantly decreased on day 7 post-ligature, indicating a reduced inflow of CSF into the G-lymphatic system (Fig 3) and returned to baseline on day 14.
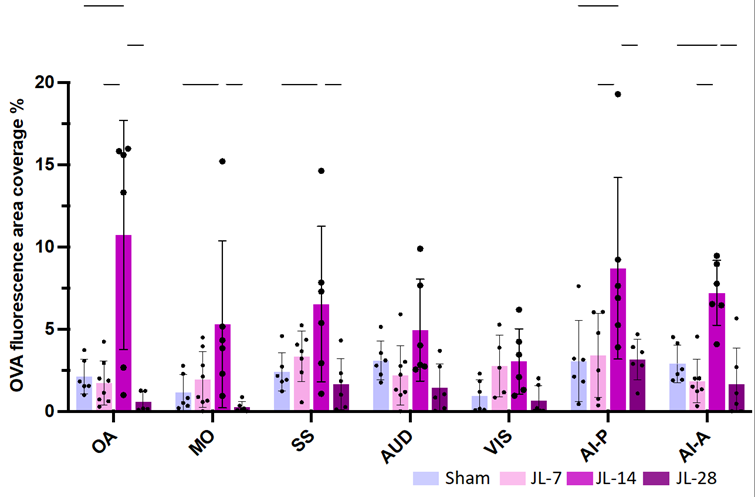
Lymphatic function: Immunofluorescence staining demonstrated a reduced lymphatic coverage of MLVs on day 7 post-ligature, which subsequently returned to baseline by day 14 (Fig 4).
Discussion and Conclusions
The results are in line with the hypothesis that venous system permit to collect the waste fluids and blood. Jugular obstruction induced an intracranial hypertension with a bigger brain and a bigger venous system. These increases stopped 2 days post-ligature showing a reorganization of the venous system. JVL induced first a loss of permeability. While Ktrans returns to normal, the area covered by OVA increases suggesting a recovery of the lymphatic system.This study combines MRI and immunofluorescence approaches to investigate the lymphatic system in mice and higlights a dependency of the lymphatic system to the MLVs. A reorganization of the venous system occurs in case of vein obstruction6 associated with a hypertension in the brain with a bigger venous system while the CSF outflow is reduced.Moreover, MRI imaging will soon be conducted to assess volumetric changes at a later time point (28 days). Venous remodeling will also be evaluated through Doppler ultrasound to obtain dynamic flow values, which are more likely to align with venous remodeling than vessel volume alone. This approach will aid in determining the point at which dural venous flow normalizes after JVL.
Acknowledgements
This work was supported by Investissements d'Avenir, IAIHU-06 (Paris Institute of Neurosciences – IHU),
References
1. Rustenhoven J, Drieu A et al. Functional characterization of the dural sinuses as a neuroimmune interface. Cell. 2021 Feb 18;184(4):1000-1016.e27
2. Louveau A, Herz J et al. CNS lymphatic drainage and neuroinflammation are regulated by meningeal lymphatic vasculature. Nat Neurosci. 2018 Oct;21(10):1380-1391.
3. Nyul-Toth A, Fulop GA et al. Cerebral venous congestion exacerbates cerebral microhemorrhages in mice. Geroscience. 2022 Apr;44(2):805-816
4. Tofts PS, Kermode AG. Measurement of the bloodbrain barrier permeability and leakage space using dynamic MR imaging. 1. Fundamental concepts. Magn Reson Med. 1991;17(2):357-67
5. Jacob L, de Brito Neto J et al. Conserved meningeal lymphatic drainage circuits in mice and humans. J Exp Med. 2022 Aug 1;219(8):e20220035.
6. Atkinson W, Forghani R et al. Ligation of the jugular veins does not result in brain inflammation or demyelination in mice. PLoS One. 2012;7(3):e33671
Figures