1183
Distribution of intravenous Gadolinium-based contrast agents (GBCA) in human olfactory regions in healthy subjects1F.M. Kirby Research Center for Functional Brain Imaging, Kennedy Krieger Institute, Baltimore, MD, United States, 2Neurosection, Division of MRI Research, Russell H. Morgan Department of Radiology and Radiological Science, Johns Hopkins University School of Medicine, Baltimore, MD, United States, 3Department of Biomedical Engineering, Johns Hopkins University, Baltimore, MD, United States, 4Division of Neuroradiology, Russell H. Morgan Department of Radiology and Radiological Science, Johns Hopkins University School of Medicine, Baltimore, MD, United States, 5Department of Neurology, Johns Hopkins University School of Medicine, Baltimore, MD, United States, 6Department of Psychiatry and Behavioral Sciences, Johns Hopkins University School of Medicine, Baltimore, MD, United States, 7Department of Otolaryngology - Head and Neck Surgery, Johns Hopkins University School of Medicine, Baltimore, MD, United States
Synopsis
Keywords: Neurofluids, Neurofluids, olfactory, DSC/DCE perfusion
Motivation: Animal studies show that the olfactory pathway is a primary CSF clearance route. However, human studies using intrathecal-GBCA show that the olfactory route may be less involved in CSF clearance in humans. As most GBCA-enhanced MRI exams are still performed using intravenous-GBCA, it is essential to investigate GBCA dis-tribution in human olfactory regions after intravenous GBCA administration.
Goal(s): To measure intravenous-GBCA-induced signal changes in olfactory regions.
Approach: Dynamic-susceptibility-contrast-in-the-CSF (cDSC) MRI was performed in 25 healthy subjects.
Results: Significant MR signal changes were detected in the olfactory regions following intravenous-GBCA. Extracranial regions showed more significant GBCA-induced changes than intracranial regions.
Impact: GBCA-induced cDSC signal changes were detected in olfactory regions of healthy subjects following intravenous GBCA administration. Extracranial regions showed more significant changes than intracranial regions, stressing the importance of separating these areas when studying GBCA distribution using intravenous injection.
INTRODUCTION
Animal studies have provided strong evidence that the olfactory pathway is one of the primary routes for CSF clearance from the brain1-5. However, in human studies using intrathecal Gadolinium-based contrast agents (GBCA) administration, the regions around the cribriform plate show less enhancement compared to the superior sagittal sinus, indicating that the olfactory route may be of less importance for CSF clearance in the human brain6,7. As most GBCA-enhanced MRI exams are still performed using intravenous GBCA, it is essential to investigate GBCA distribution in the olfactory regions in the human brain after intravenous GBCA administration8. Compared to intrathecal GBCA injection, one important consideration when studying GBCA distribution after intravenous GBCA administration is that GBCAs can come from both intracranial and extracranial (peripheral) routes. This is particularly relevant to the olfactory pathway, as the regions inferior to the cribriform plate are considered extracranial regions that may receive GBCAs from the external carotid artery. It is therefore critical to measure GBCA-induced signal changes in intracranial and extracranial areas separately when studying the olfactory pathway. Moreover, the MRI approaches employed in most existing studies have significant signal contributions from both blood and CSF, which is particularly problematic for intravenous GBCA as the intravascular GBCA concentration can be substantially greater than that from CSF. In this study, we applied the recently developed dynamic-susceptibility-contrast-in-the-CSF (cDSC) MRI9 approach to measure GBCA-induced signal changes in the olfactory regions after intravenous GBCA administration in healthy subjects. The cDSC-MRI method was developed to track dynamic CSF signal changes with a temporal resolution of <10s, a sub-millimeter spatial resolution, and whole brain coverage. With a long TE (1312ms), tissue and blood signals are effectively suppressed (i.e. it is in the noise range, not significantly different from the background, and therefore is effectively zero)9 in cDSC-MRI, and thus, a purer CSF signal with minimal partial-volume effects from the blood is provided.METHODS
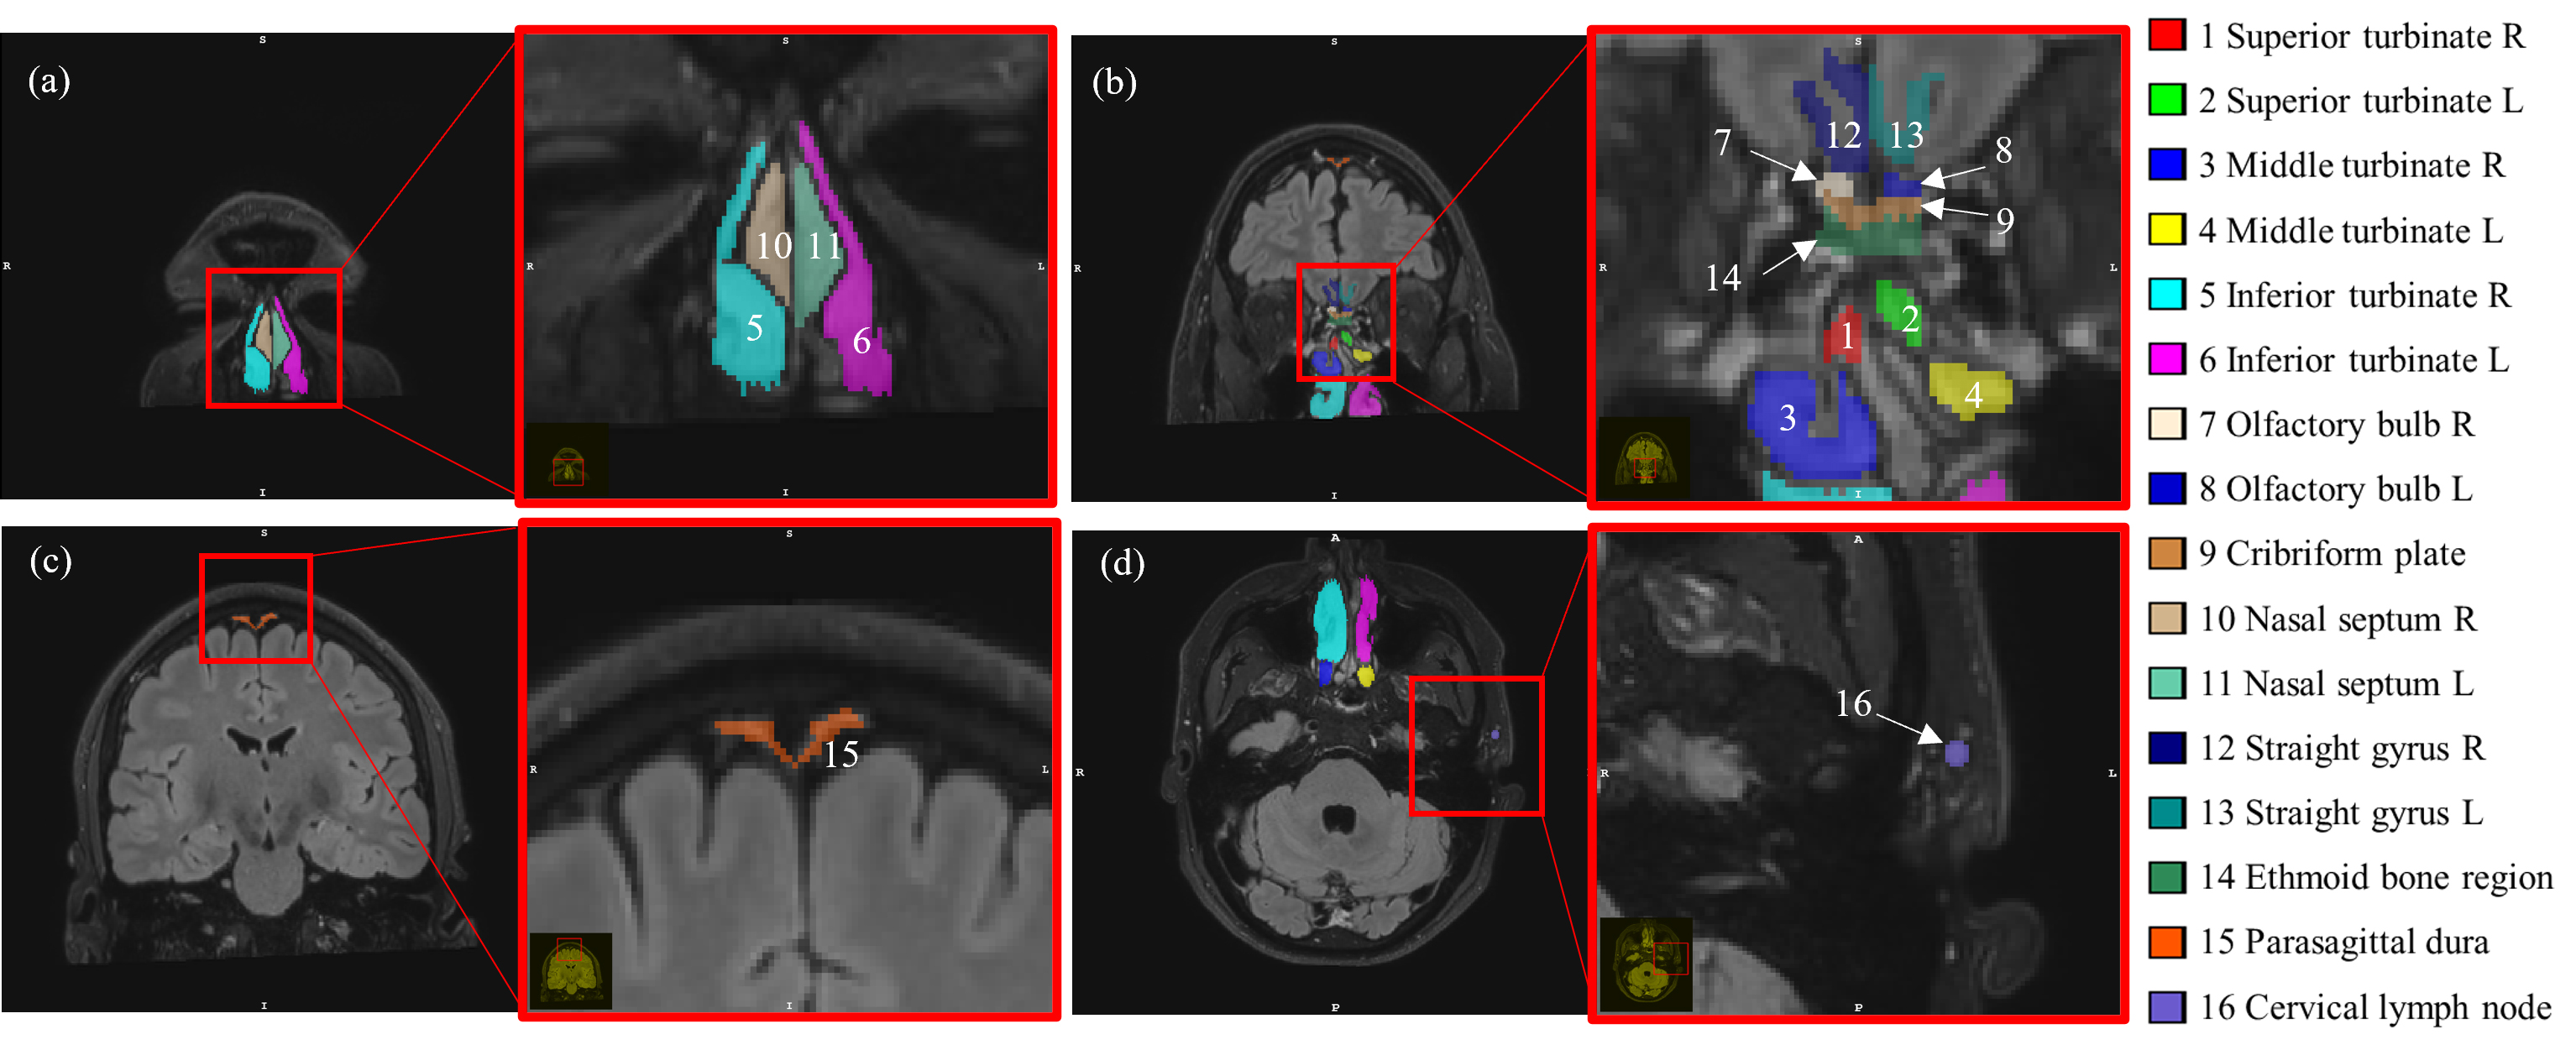
25 healthy volunteers (48.9±19.5yr, 20-85yr, 14females) were studied. MRI experiments were performed on a 3T Philips Elition RX. GBCA (Gadoteridol) was administered intravenously (0.1 mmol/kg). The following scans were performed for each subject: a) pre-GBCA FLAIR: 0.8mm iso; b) cDSC MRI continuously before and after GBCA injection: 0.8mm iso, 3D TSE, TR/TE=10s/1312ms, 60volumes; c) post-GBCA FLAIR. Data analysis: cDSC images were motion corrected using SPM. FLAIR images were co-registered to cDSC images. Sixteen ROIs were manually delineated on post-GBCA FLAIR images (Fig.1). The olfactory regions were separated into intracranial (superior to) and extracranial (inferior to) regions by the cribriform plate. As the exact location of the cribriform plate is difficult to locate on FLAIR, the cribriform plate ROI was drawn to include regions on both sides. In addition, the parasagittal dura, straight gyrus, and a facial lymph node were used as intracranial and extracranial reference regions, respectively. Relative-signal-change (∆S/S) and GBCA concentration ([Gd]) were calculated from cDSC images using established methods9. Voxels with significant GBCA-induced signal changes in cDSC images in each ROI were identified using a contrast-to-noise ratio (CNR) threshold9 and a two-sample t-test.RESULTS
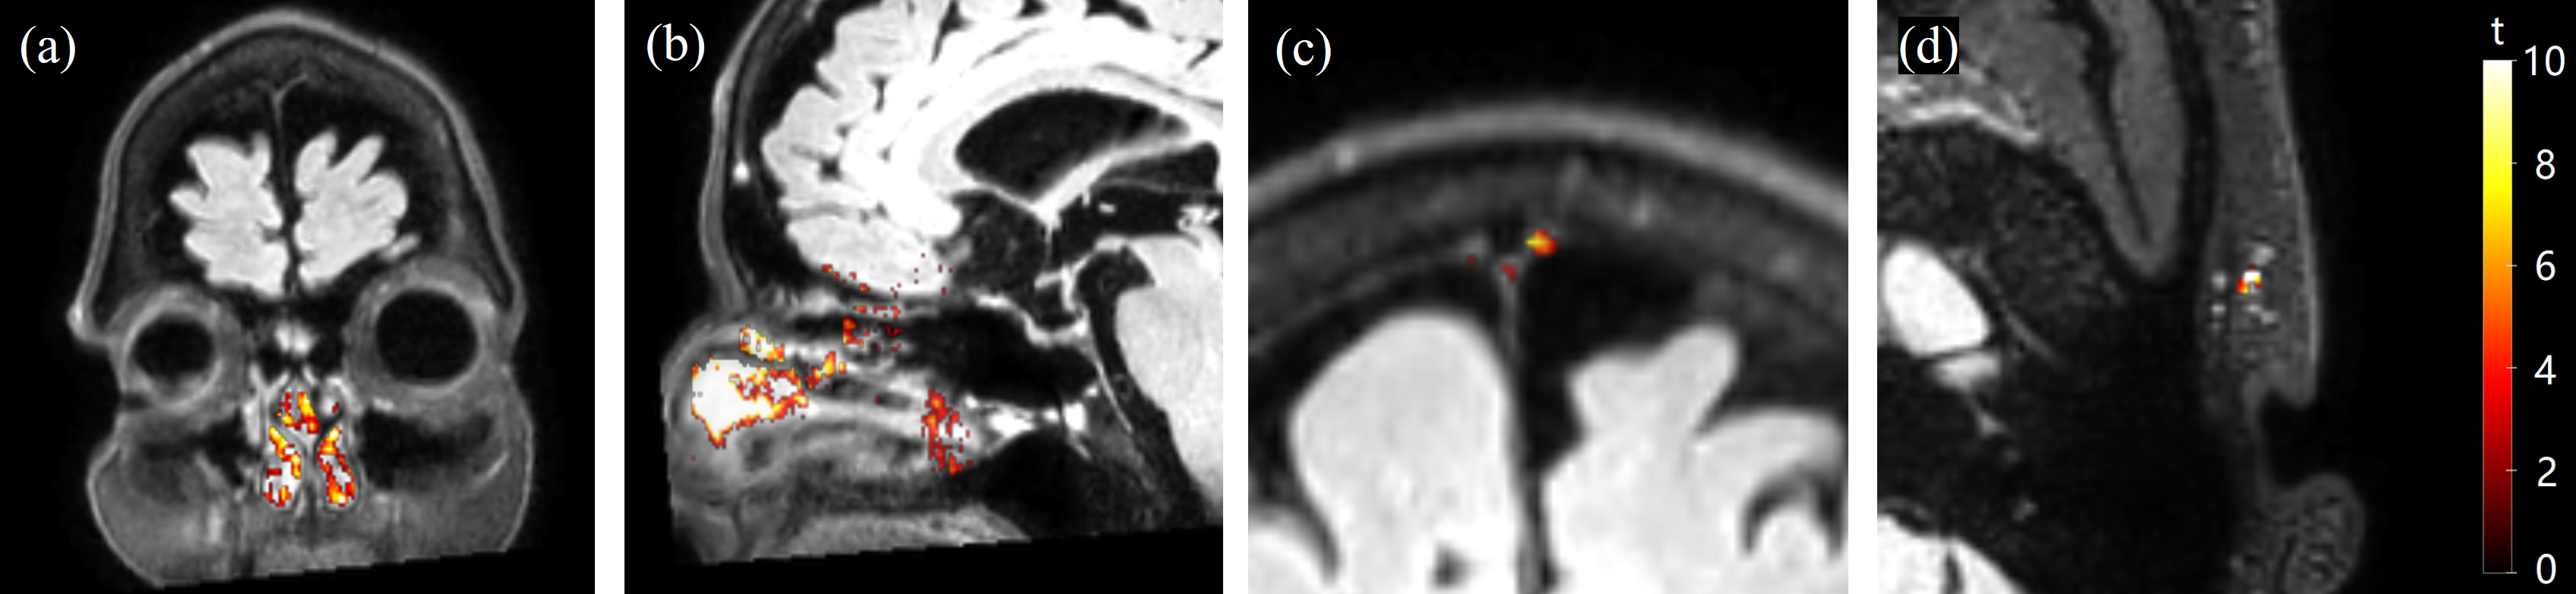
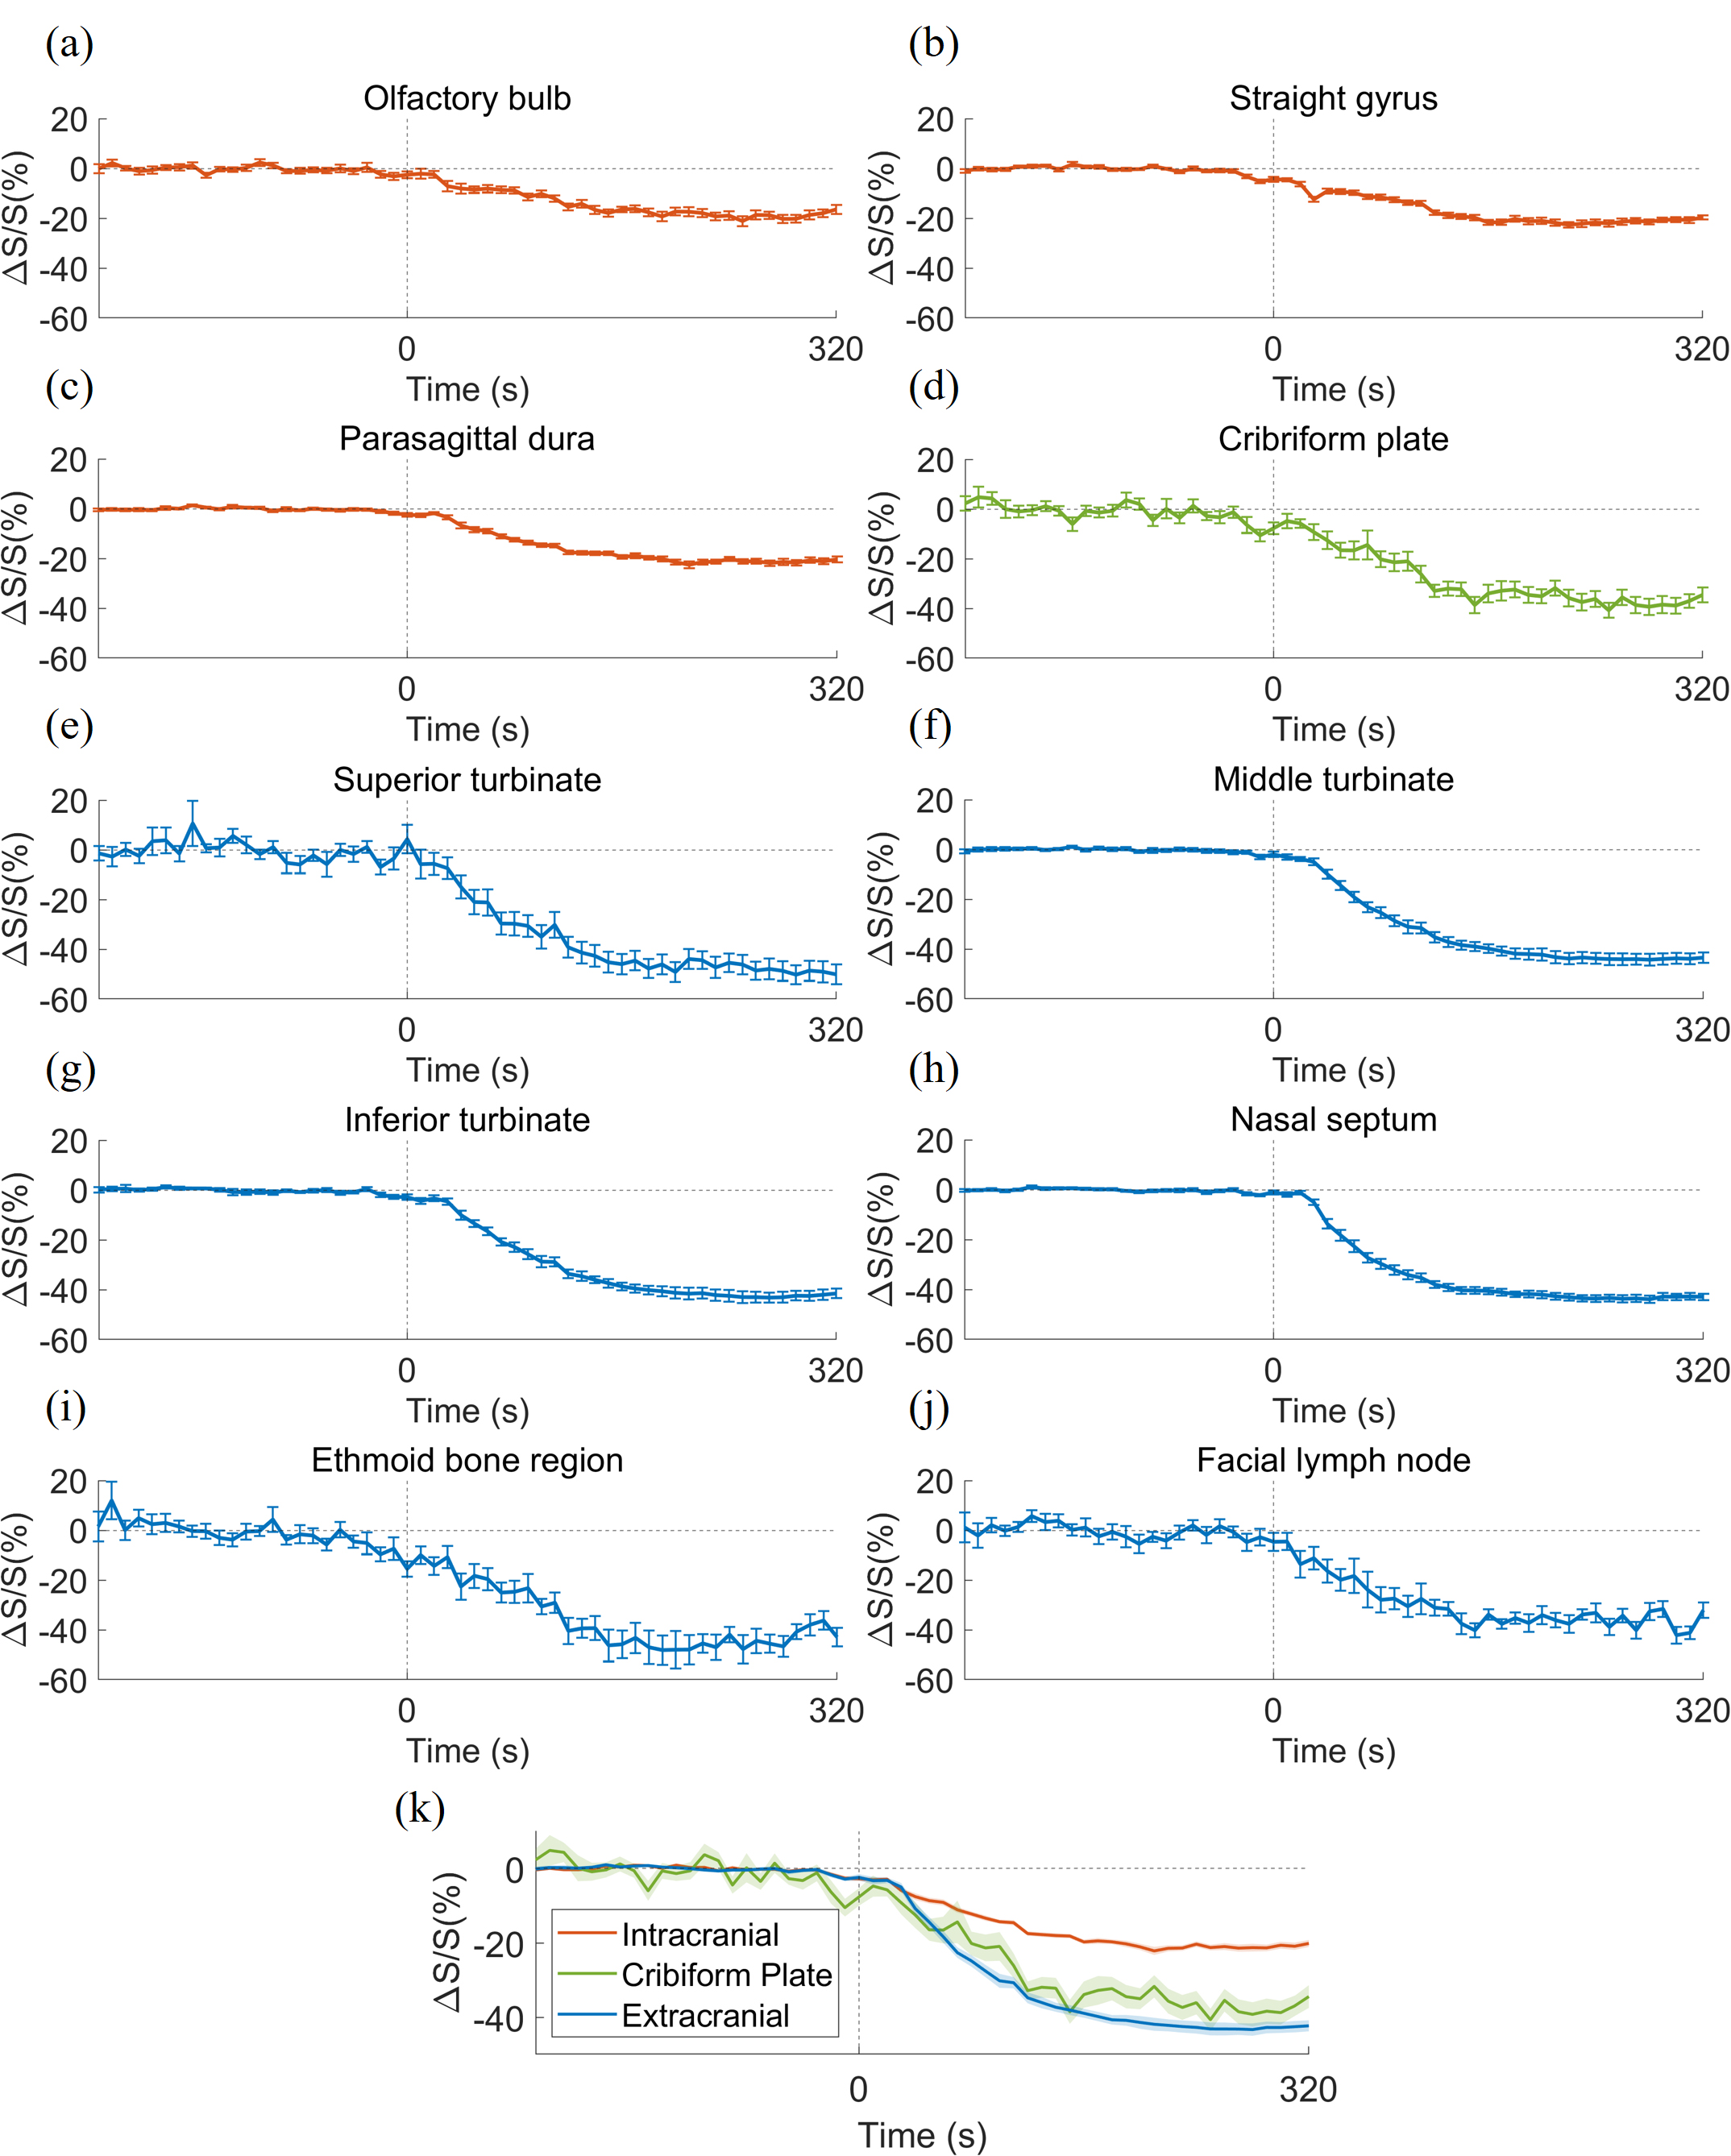
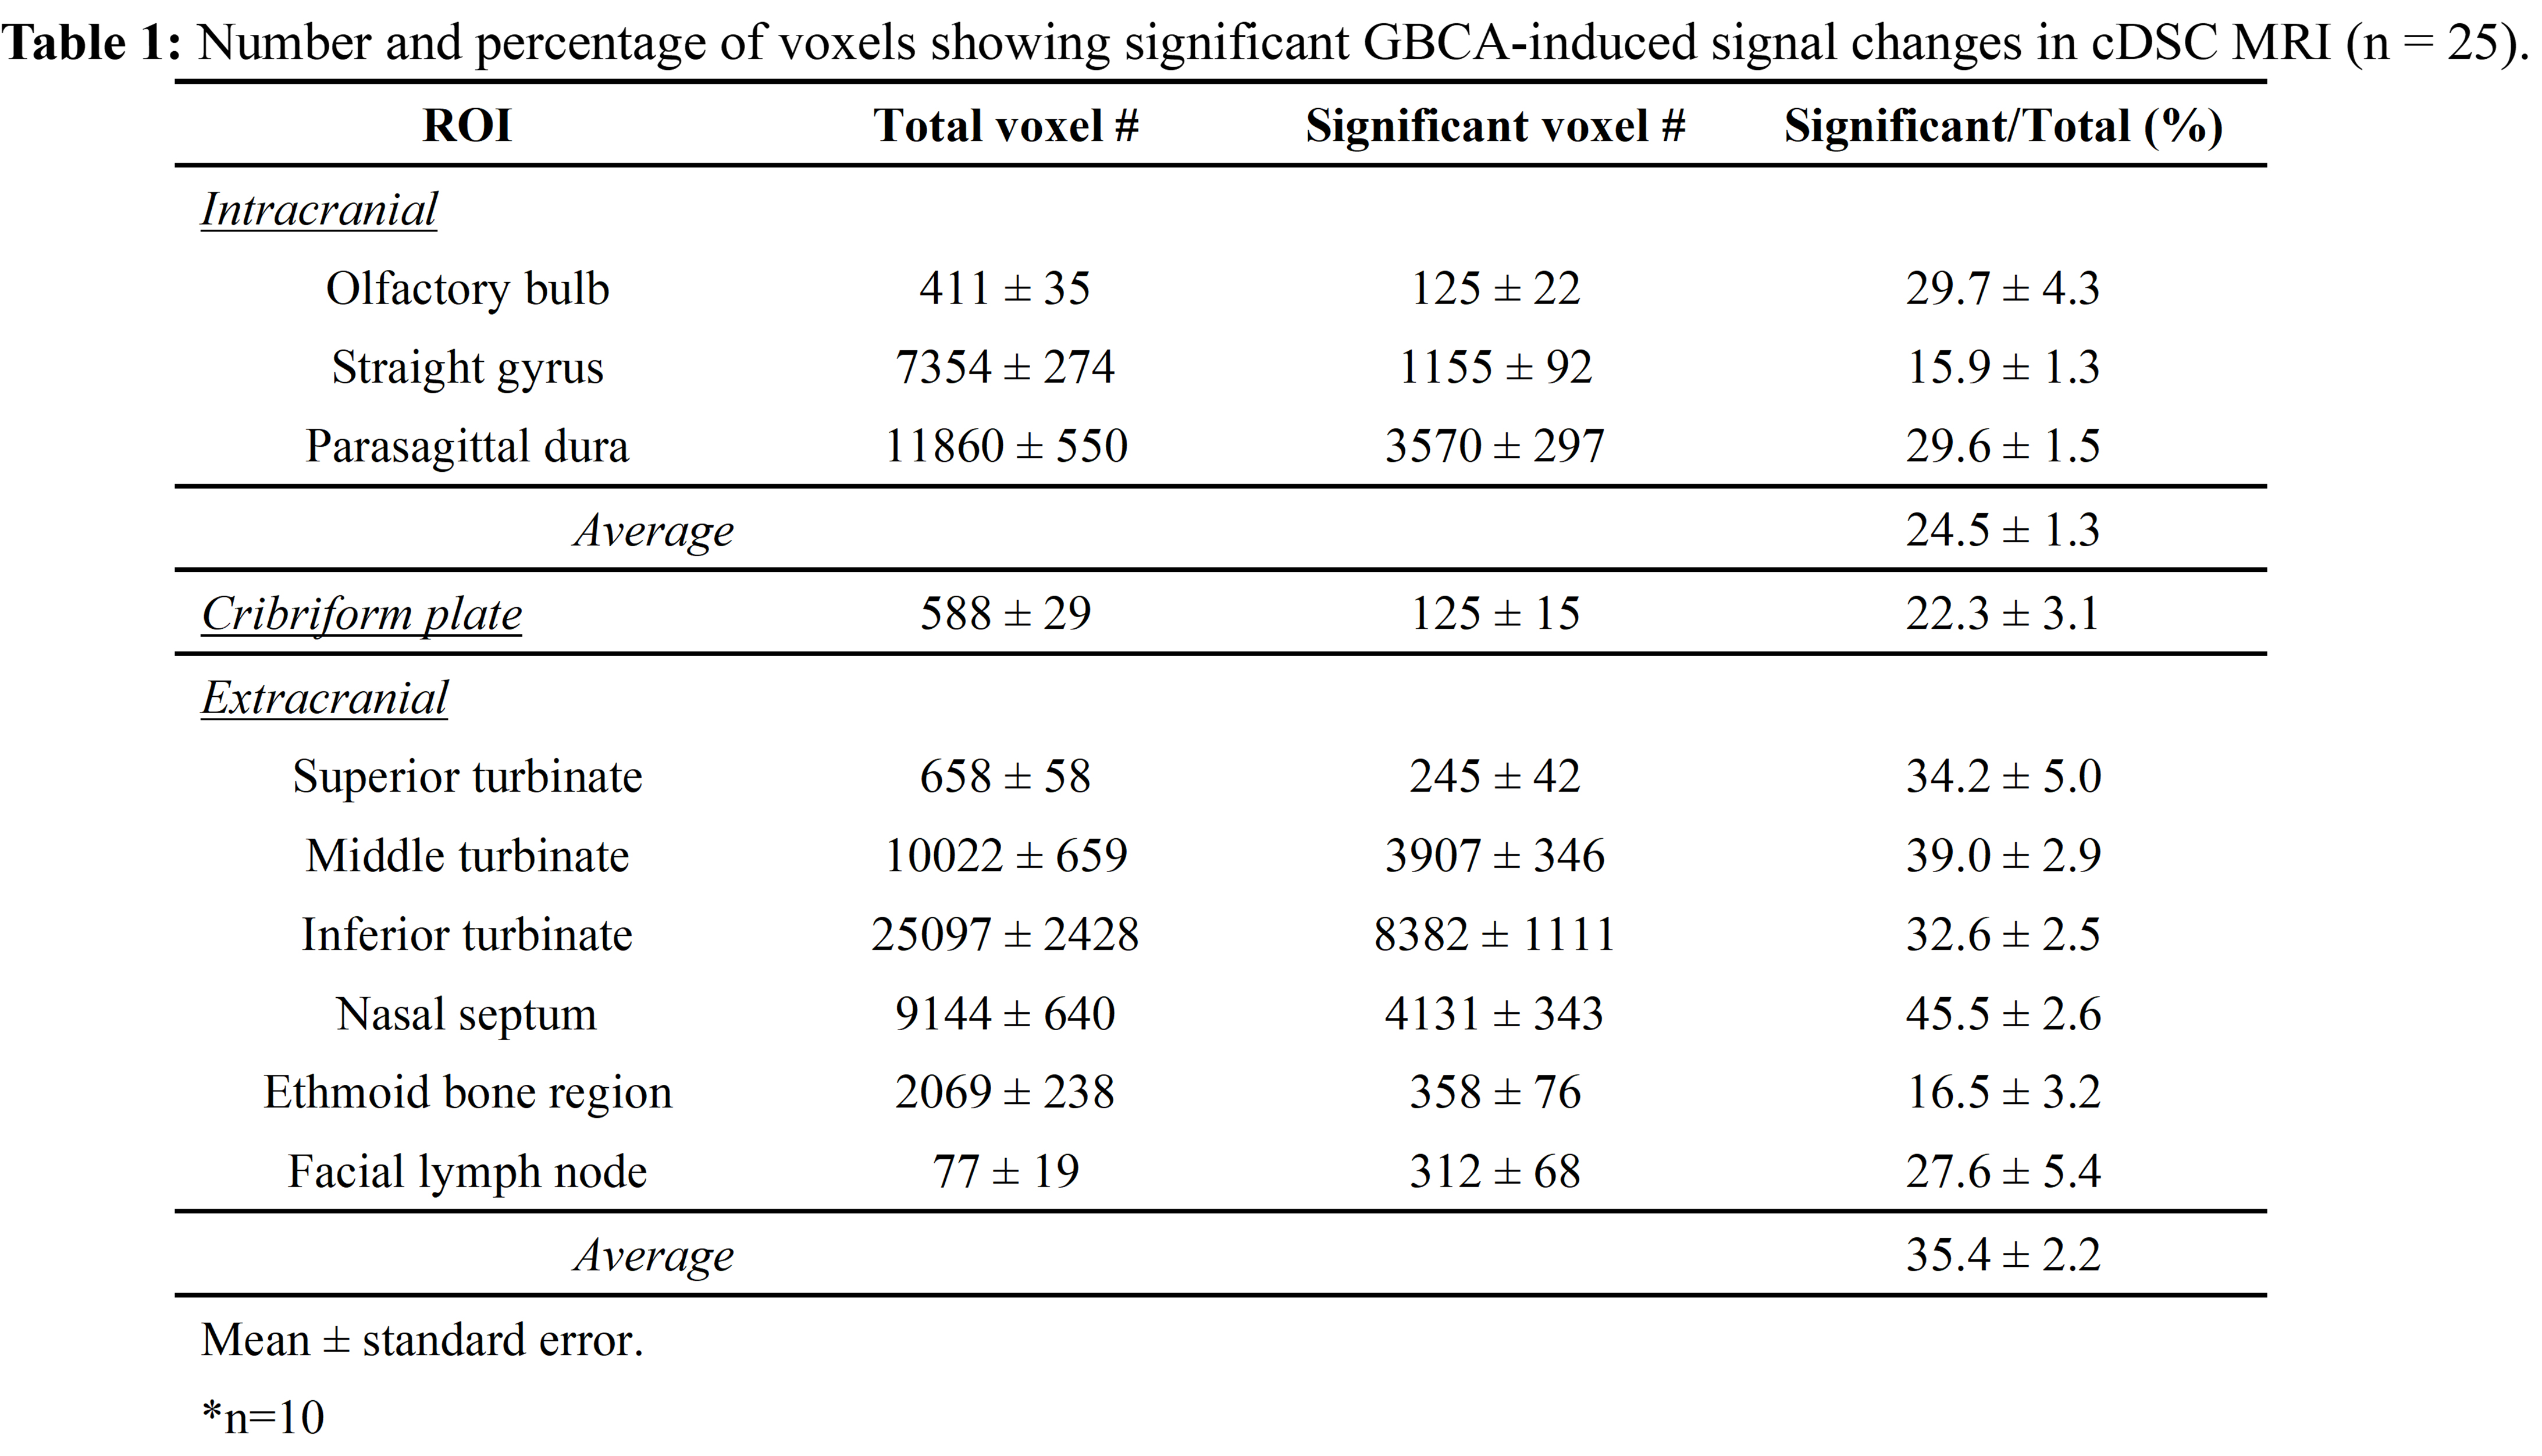
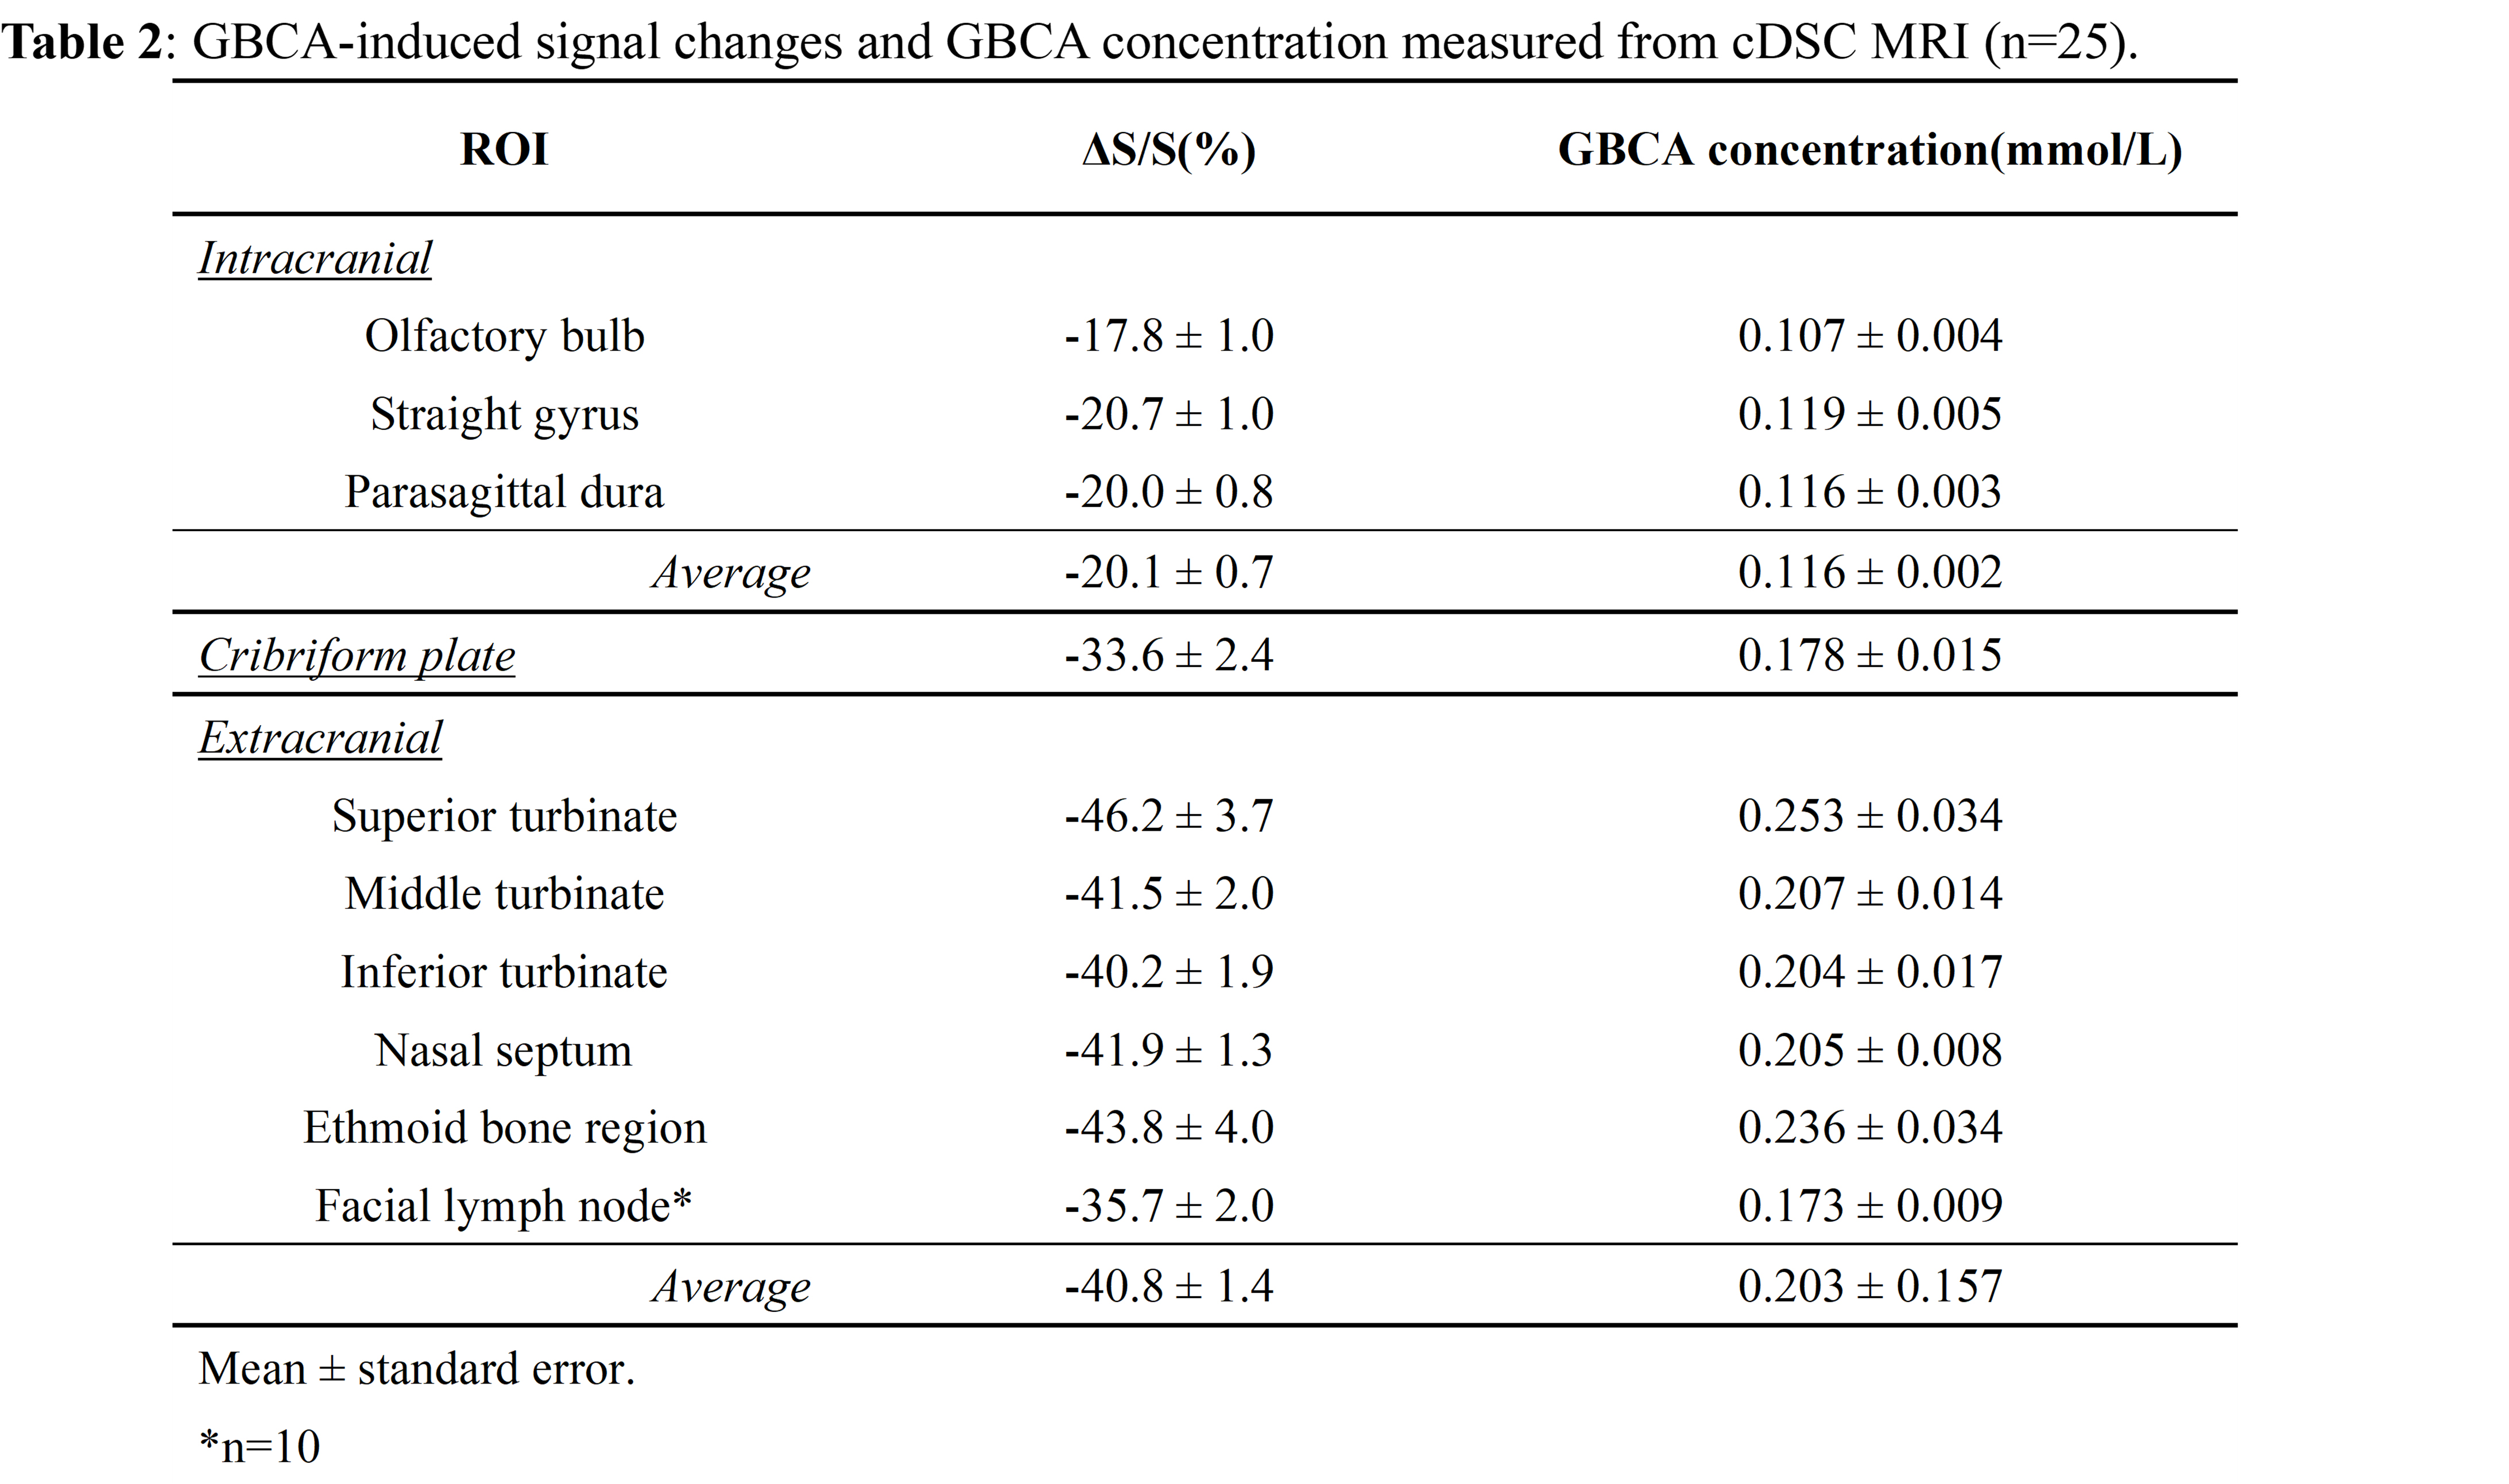
Fig.2 shows representative maps of significant voxels from one subject. Table 1 summarizes the numbers of voxels showing significant GBCA-induced signal changes in cDSC MRI in each ROI from all subjects. In general, extracranial regions showed more significant voxels. Only voxels showing significant GBCA-induced signal changes in each ROI were included in subsequent analysis. Fig.3 shows the average time courses of cDSC ∆S/S from all subjects. Table 2 summarizes the average ∆S/S and estimated GBCA concentration ([Gd]) in each ROI from all subjects. Note that as cDSC images are heavily T2 weighted, GBCAs are expected to induce a negative ∆S/S in the CSF9. Extracranial regions showed significantly higher (more negative) ∆S/S and [Gd] compared to intracranial regions (P < 0.001).DISCUSSION & CONCLUSION
Our results showed that GBCA-induced MR signal changes can be detected with cDSC MRI in the olfactory regions in healthy human subjects immediately following intravenous GBCA administration. A key feature of cDSC MRI is that it uses a very long TE to suppress blood and tissue signals, so that we are confident that the measured ∆S/S reflects GBCA-induced signal changes in the CSF only. Extracranial regions showed more significant GBCA-induced changes than intracranial regions, which may come from peripheral routes after intravenous injection. This also stresses the importance of separating intra- and extra-cranial areas when studying GBCA-induced signal changes using the intravenous approach. One limitation of this study is that only signal changes immediately (10s) after GBCA administration were investigated. However, subsequent studies are ongoing to study GBCA clearance through the olfactory route over time.Acknowledgements
No acknowledgement found.References
1. Norwood, J. N. et al. Anatomical basis and physiological role of cerebrospinal fluid transport through the murine cribriform plate. eLife 8, e44278 (2019).2. Stanton, E. H. et al. Mapping of CSF transport using high spatiotemporal resolution dynamic contrast-enhanced MRI in mice: Effect of anesthesia. Magnetic Resonance in Medicine 85, 3326–3342 (2021).
3. Boulton, M., Flessner, M., Armstrong, D., Hay, J. & Johnston, M. Lymphatic drainage of the CNS: effects of lymphatic diversion/ligation on CSF protein transport to plasma. American Journal of Physiology-Regulatory, Integrative and Comparative Physiology 272, R1613–R1619 (1997).
4. Boulton, M. et al. Contribution of extracranial lymphatics and arachnoid villi to the clearance of a CSF tracer in the rat. American Journal of Physiology-Regulatory, Integrative and Comparative Physiology 276, R818–R823 (1999).
5. Bradbury, M. W., Cserr, H. F. & Westrop, R. J. Drainage of cerebral interstitial fluid into deep cervical lymph of the rabbit. American Journal of Physiology-Renal Physiology 240, F329–F336 (1981).
6. Sennfält, S. et al. Visualising and semi-quantitatively measuring brain fluid pathways, including meningeal lymphatics, in humans using widely available MRI techniques. J Cereb Blood Flow Metab 43, 1779–1795 (2023).
7. Melin, E., Eide, P. K. & Ringstad, G. In vivo assessment of cerebrospinal fluid efflux to nasal mucosa in humans. Scientific Reports 10, 14974 (2020).
8. Mehta, N. H. et al. The Brain-Nose Interface: A Potential Cerebrospinal Fluid Clearance Site in Humans. Front. Physiol. 12, 769948 (2022).
9. Cao, D. et al. Fast whole brain MR imaging of dynamic susceptibility contrast changes in the cerebrospinal fluid (cDSC MRI). Magnetic Resonance in Medicine 84, 3256–3270 (2020).
Figures