1181
T1 measurement in CSF: Intrinsic compartmental differences and tracer concentration assessment in the healthy brain1Department for Physics and Computational Radiology, Oslo University Hospital, Oslo, Norway, 2Institute of Clinical Medicine, Faculty of Medicine, University of Oslo, Oslo, Norway, 3Department of radiology, Division of Radiology and Nuclear Medicine, Oslo University Hospital, Oslo, Norway, 4Department of Geriatrics and Internal Medicine, Sorlandet Hospital, Arendal, Norway, 5The Intervention Center, Oslo University Hospital, Oslo, Norway, 6Department of Neurology, Oslo University Hospital, Oslo, Norway
Synopsis
Keywords: Neurofluids, Neurofluids
Motivation: T1 mapping facilitates assessment of brain waste clearance by assessing native solutes or detection of endogenous tracers.
Goal(s): To provide a method for accurate measurement of T1 in CSF, to investigate variations in intrinsic T1 of CSF and to measure tracer in CSF after intrathecal administration.
Approach: A T2-weighted mixed spin-echo/inversion recovery sequence was implemented to measure T1 in CSF. Five healthy subjects were imaged prior to and four times after intrathecal gadobutrol injection.
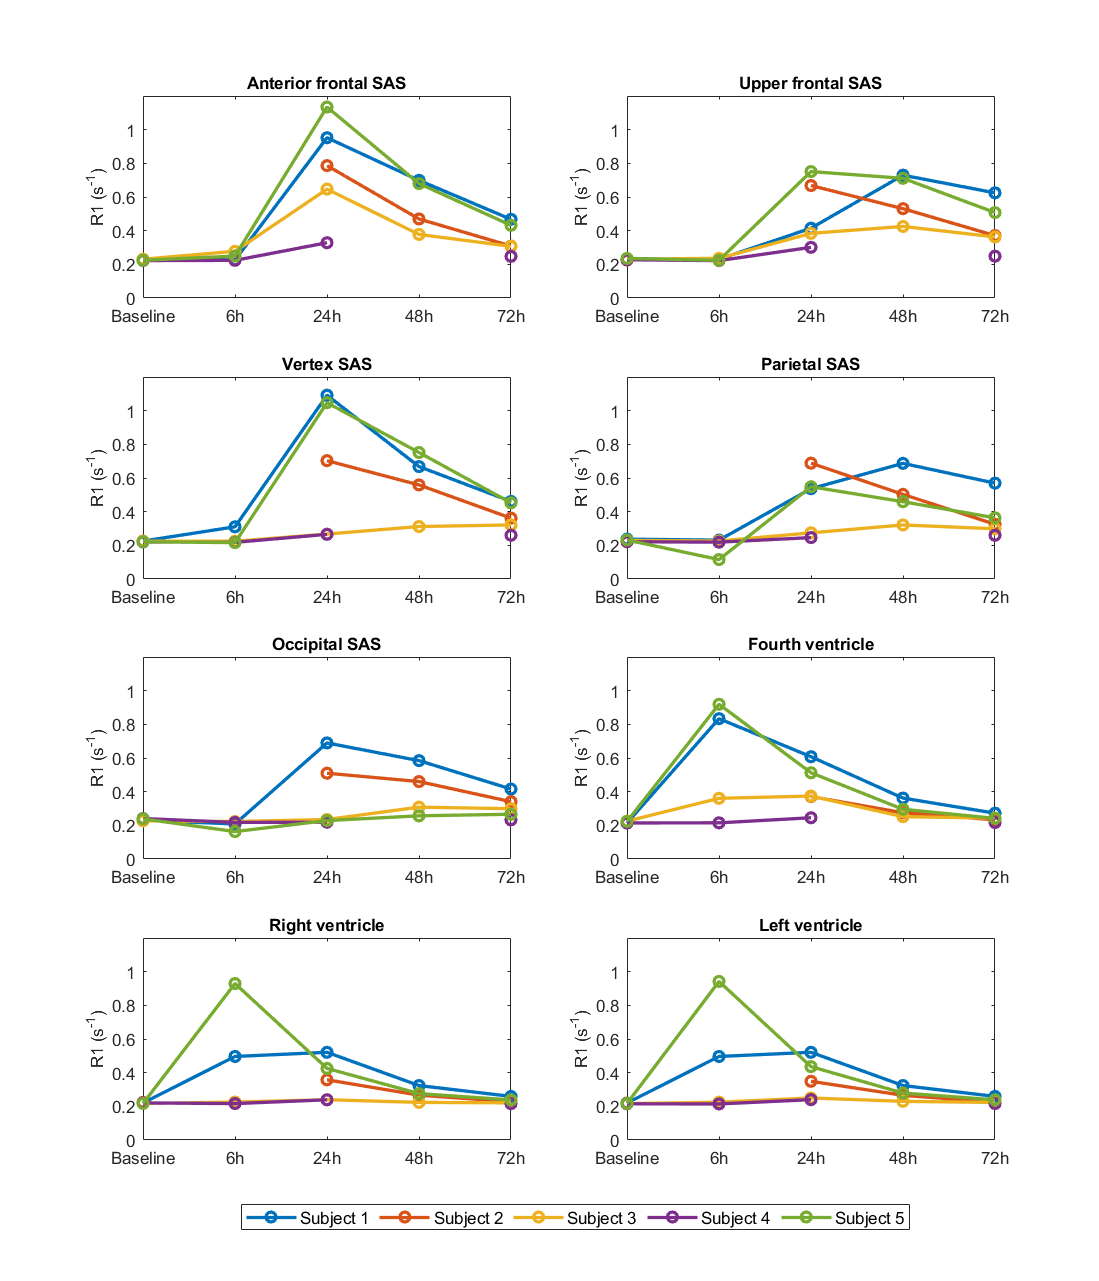
Results: Baseline R1 is lower in the ventricles than in the subarachnoid space. At 72 hours after injection, there is still gadobutrol in the subarachnoid space.
Impact: Accurate T1 measurements in CSF facilitate quantitative study of brain clearance as concentration of Gd-based tracers in CSF can be established. Observed compartmental differences in intrinsic T1 of CSF indicate information on solute concentrations can be measured without endogenous tracer.
Introduction
Cerebrospinal fluid (CSF) contributes to perivascular transport of nutrients and clearance of waste products in the brain. Several neurological diseases are associated with alterations in CSF flow, and pathologies related to deposition of protein aggregates may be related to impaired CSF mediated brain clearance. To investigate the role of brain waste clearance in different pathologies, methods to evaluate brain clearance are essential.The current standard of reference use intrathecal gadolinium-based contrast agent (GBCA) as a surrogate tracer for metabolic waste products1. After administration in CSF, the distribution and clearance of GBCA from brain tissue and CSF is measured by repeated 3D-T1W imaging or T1-mapping. To quantify local tissue permeability the distribution of GBCA in CSF must be known. This may be measured by T1 mapping of CSF.
T1 relaxation of unenhanced CSF may carry information about solute concentration by the relaxation effect from the solutes themselves. If this concentration varies due to accumulation of waste products, T1 mapping may be a tool to measure this noninvasively.
The range of relaxation times, from sub-second in enhancing grey and white matter to almost 5 s in CSF pose a challenge. Accurate measurements require either optimisation to a narrow range or to perform a very long scan. For this reason, we implemented a dedicated mixed spin-echo/inversion recovery sequence to measure T1 in CSF exclusively. We report preliminary experience with this technique in healthy volunteers.
Methods
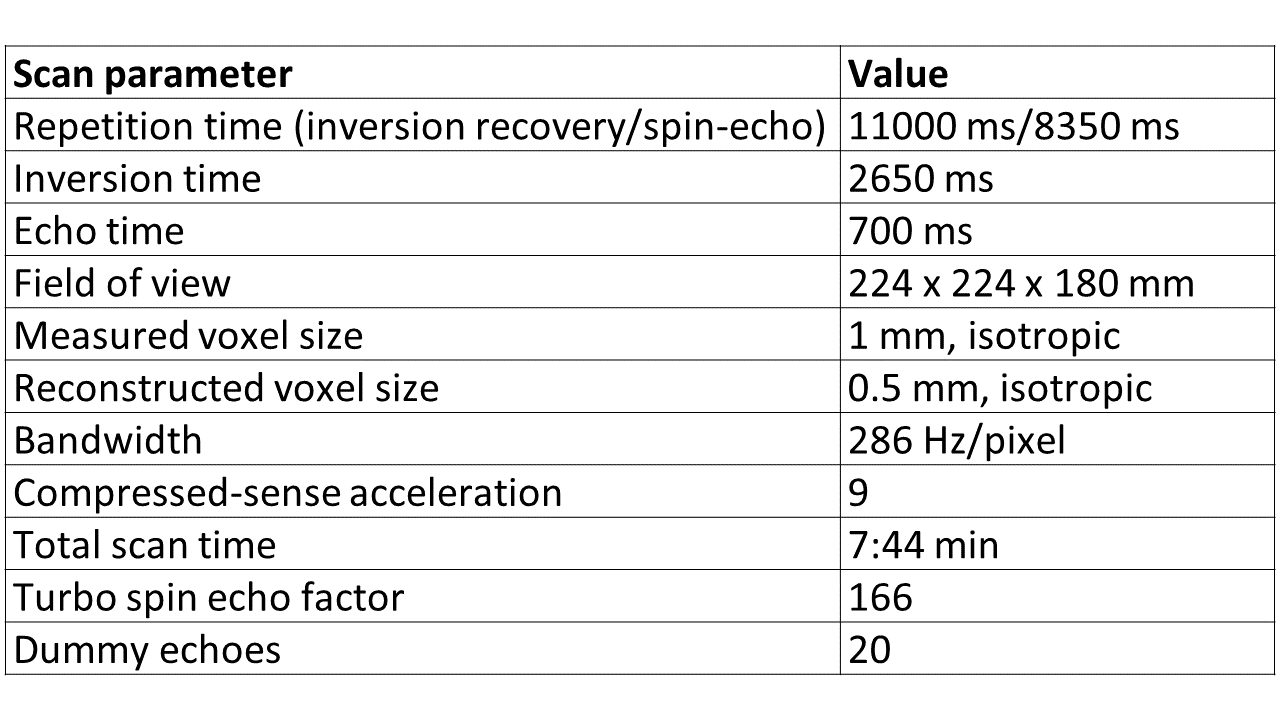
In this preliminary work we included healthy controls from a study assessing brain clearance in Parkinson’s disease (3 females, ages 60-71 years). The study was approved by the regional ethics committee (REC#282297) and hospital authority (Data-protection #21/19051). All subjects signed informed consent forms. Intrathecal administration of gadobutrol (0.25 mmol) was performed after baseline MRI and subsequent MRI exams were performed at 6, 24, 48 and 72 hours.Imaging was done in a 3T Philips Ingenia scanner with a 32-channel head coil. A 3D-T2W mixed spin-echo/inversion-recovery sequence was implemented with parameters as listed in Figure 1.
Relaxation maps were generated using Matlab. A look-up table correlating integer T1 values between 300-35000 ms to the fraction (IR-SE)/(IR+SE) was calculated based on the signal equations:
SE=M0*(1-exp(-TR/T1))
IR=M0-(M0+SE)*exp(-TI/T1)
The spin-echo signal was read from modulus images while the inversion-recovery signal was read from phase-corrected real images to preserve polarity. The look-up table was used to translate measured signal fractions to estimates of T1 and R1.
Pixels with < 10% of the maximum signal in the spin-echo images were set to zero.
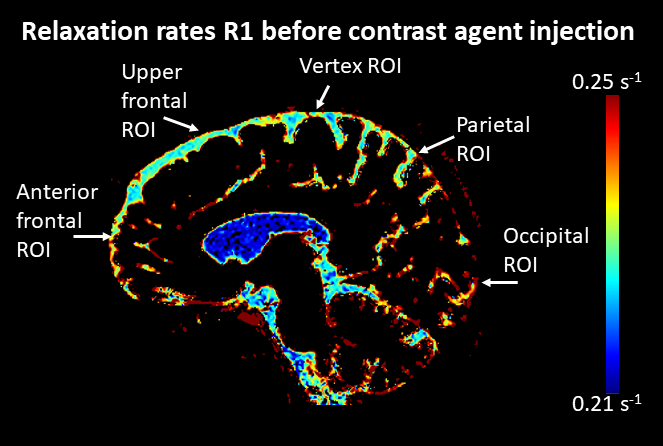
All R1 maps were co-registered to the baseline for each subject, using greedy co-registration in ITK-SNAP2. Semi-automatic segmentations of the right, left and fourth ventricle were done in ITK-SNAP. For measurements in subarachnoid space, spherical regions-of-interest of 468 voxels, were placed manually considering all three planes using ITK-SNAP (Figure 2).
Concentration of gadobutrol was estimated from the formula:
[gadobutrol]=(R1(t)-R1(0))/r1,
where R1(t) is R1 measured at time t, R1(0) is the intrinsic R1 and r1=5 L/(mmol ·s) is the relaxivity of gadobutrol3.
Results
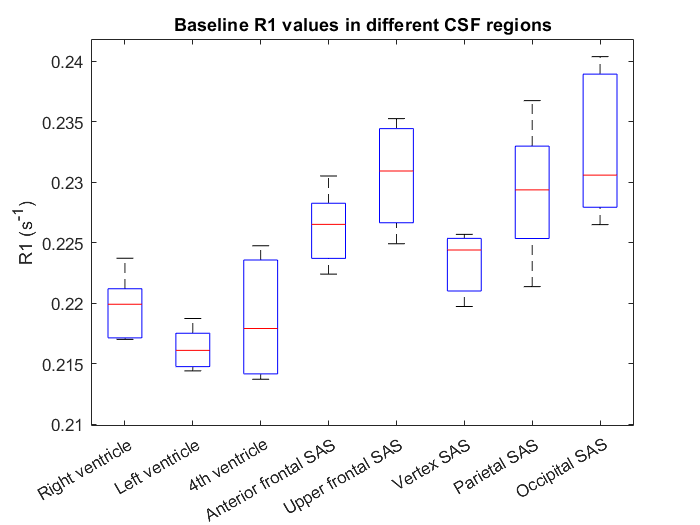
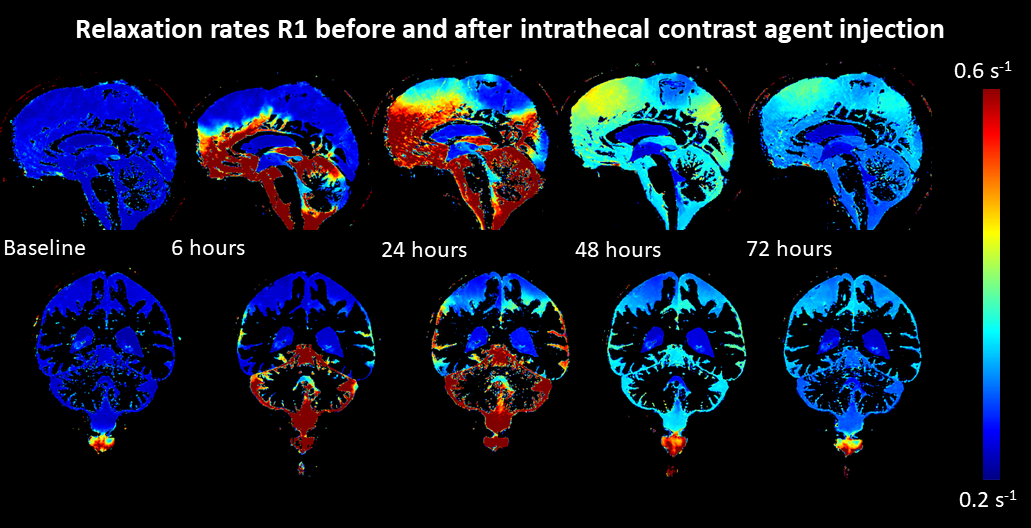
At baseline, the R1 differed between CSF regions. R1 was lower in the ventricles than in the subarachnoid space (Figure 2-3). Figure 4 shows the distribution of GBCA in CSF before and after contrast injection for one subject. The R1 differed between regions at all time points. At 72 hours, there was still contrast agent in the subarachnoid space, as illustrated in Figure 4 -5.The concentration of gadobutrol in the ventricles at 6 hours was (max 150 µmol/L), while it was highest at 24 hours in the subarachnoid space (max 180 µmol/L) (Figure 5).
Discussion
Our results show that T1 in intrinsic CSF is slow in the ventricles — important CSF production sites — and faster in the subarachnoid space. This supports the idea of waste products accumulating in the subarachnoid space before clearance to meningeal lymphatic vessels and arachnoid granulations. Relaxation due to water-surface interaction with arachnoid tissue may also contribute. Further investigations are needed to assess the method’s potential in the study of brain clearance.After intrathecal administration, concentration of gadobutrol was precisely depicted. The dynamics of CSF transport show large variation, hence quantitation is necessary if local brain permeability or clearance is to be measured quantitatively by GBCA.
Conclusion
Using a T2W 3D mixed spin-echo/inversion recovery sequence, we obtain full-brain T1 relaxation maps of CSF with high detail. T1 in CSF of healthy subjects show compartmental differences possibly depicting differing CSF constituents.Distribution of gadobutrol in CSF after intrathecal administration may be quantified by the applied sequence providing an input function for pharmacokinetic modelling.
Acknowledgements
We are thankful for funding from the Norwegian Parkinson's Association, Norway Parkinson Research Fund, South-Eastern Norway Regional Health Authority and the Norwegian Health AssociationReferences
1. Ringstad G, Valnes LM, Dale AM, et al. Brain-wide glymphatic enhancement and clearance in humans assessed with MRI. JCI Insight. 2018; 3(13).
2. Yushkevich PA, Piven J, Hazlett HC, et al. User-guided 3D active contour segmentation of anatomical structures: Significantly improved efficiency and reliability. Neuroimage. 2006; 31(3):1116-1128.
3. Szomolanyi P, Rohrer M, Frenzel T, et al. Comparison of the Relaxivities of Macrocyclic Gadolinium-Based Contrast Agents in Human Plasma at 1.5, 3, and 7 T, and Blood at 3 T. Invest. Radiol. 2019; 54(9):559-564.
Figures