1179
Accelerated Method for Joint Fatty Acid Composition and T1 (FACT) Mapping of Epicardial Adipose Tissue in Mice at 9.4 T1Biomedical Engineering, University of Virginia, Charlottesville, VA, United States
Synopsis
Keywords: Heart Failure, Fat, T1 Mapping
Motivation: Proinflammatory epicardial adipose tissue (EAT) contributes to heart failure (HF). MRI fatty acid composition (FAC) and T1 of EAT may distinguish proinflammatory vs. healthy EAT. Applying separate FAC and T1 mapping sequences is time consuming, motivating the development of accelerated methods.
Goal(s): Our goal was to create an accelerated joint EAT FAC and T1-mapping method (FACT) for use in mice at 9.4 T.
Approach: An inversion-recovery multi-echo sequence and model-based mapping method was developed with acceleration along orthogonal time dimensions.
Results: Results demonstrate feasibility of the FACT method with approximately rate 12 acceleration.
Impact: The FACT method efficiently and accurately determines both EAT fat composition and T1 and could be used in-vivo to investigate mechanisms and efficacy of novel therapies targeting proinflammatory EAT in the context of metabolic heart disease.
Introduction
Accumulation and inflammation of epicardial adipose tissue (EAT) is strongly implicated in cardiovascular diseases, including heart failure with preserved ejection fraction (HFpEF)1. EAT is the visceral adipose depot of the heart and shares a microcirculation with the myocardium. In healthy conditions, the EAT helps maintain homeostasis of the heart. However, in metabolic disorders such as obesity, EAT can become proinflammatory. Proinflammatory EAT is harmful via adipocyte hypertrophy, hypoxia, infiltration of proinflammatory M1 macrophages and secretion of inflammatory cytokines. The fatty acid composition (FAC) of EAT can shift EAT towards a proinflammatory state, as saturated fatty acids promote M1 macrophage polarization and inflammatory cytokine secretion2,3. Effective cardiovascular disease therapies modify both EAT MRI FAC4 and T1 relaxation5 in mouse models of metabolic heart disease. Therefore, EAT FAC and T1 may be measurable and modifiable risk factors for the development of cardiovascular diseases. However, applying separate sequences for EAT FAC and T1 mapping is time consuming, motivating the development of accelerated methods. We propose a joint method to efficiently and accurately map EAT FAC and T1 in mice using undersampling in the echo-time and inversion-time dimensions.Methods
The FACT method combines EAT FAC and T1 mapping using an ECG-triggered inversion recovery-prepared radial multi-echo sequence (Fig. 1). Golden angle rotation is applied in-plane (kx-ky), through inversion time (TI), and through echo time (TE). Images were reconstructed using local low-rank regularization6. FACT mapping was performed using conventional estimation of field inhomogeneities7 and a least-squares fit to a multi-resonance signal model using assumptions about the chain length and double bond to poly double bond ratio. The standard FAC signal model8 was modified to include a T1 recovery term such that the model was a function of echo and inversion times. Maps of saturated (SFA), mono-unsaturated (MUFA), and poly-unsaturated (PUFA) fat fractions were calculated from the separate fat signals.Imaging was performed on a 9.4 T system (Bruker). Method validation utilized two phantoms with (1) various cooking oil mixtures (100% sesame, 100% flaxseed, 25% coconut/75% sesame, 100% olive, 50% coconut/50% avocado) and water, and (2) various gadolinium concentrations (0, 0.01, 0.025, 0.05, 0.1, 0.25, 0.5 mM) in water. Reference FAC values of oils were measured using NMR spectroscopy and reference T1 values of gadolinium-water mixtures were measured using a conventional T1 mapping method (saturation-recovery RARE). Agreement between FACT MRI and reference values was assessed using linear regression for approximately rate 5 (38 projections) and rate 12 (17 projections) acceleration.
In vivo short-axis cardiac MRI was performed using a mouse model of metabolic heart disease (high-fat high-sucrose diet (HFHSD) for 18 weeks) to demonstrate in-vivo feasibility of the method. MRI results were compared to literature values of gonadal adipose tissue lipidomics of mice fed a HFHSD for 12 weeks9. Thirty-eight radial projections were initially acquired and retrospectively undersampled FACT maps were generated using as few as 14 projections.
Results
Example oil phantom FACT maps are shown in Fig. 2. MRI FACT-derived fat composition results strongly correlate with NMR reference values for images reconstructed with as few as 17 radial projections (SFA: r = 0.96, p = 0.008, MUFA: r = 0.97, p = 0.005, PUFA: r = 0.97, p = 0.0048). Gadolinium phantom T1 maps are shown in Fig. 3. FACT-derived T1 results strongly correlate with reference T1 values for images reconstructed with as few as 17 radial projections (r = 0.94, p = 0.002). Although the FACT method slightly overestimates T1, it can accurately detect changes in T1. Example in vivo FACT maps are shown in Fig. 4. FACT-derived EAT SFA, MUFA, and PUFA values agree with visceral adipose tissue reference values for all acceleration rates tested (233-14 projections).Discussion
We developed a novel simultaneous EAT FAC and T1 mapping method for use in mice at 9.4 T. Applying separate scans for unaccelerated FAC (~25 min) and T1 mapping (~ 30 min) is very time consuming. By accelerating acquisitions in two orthogonal time dimensions, our method maintains FAC and T1 accuracy with only 17 spokes per image resulting in a total scan time of approximately 12 minutes. Future work will use this method to study EAT response to new HFpEF therapies (e.g., SGLT2-inhibitors) that are known to act on EAT and reduce its proinflammatory state.Conclusion
The FACT method efficiently and accurately determines both EAT FAC and T1 in phantoms and mice at 9.4 T and may enable future evaluation of therapies targeting EAT in the context of metabolic heart disease.Acknowledgements
Supported by NIH R01HL162872, AHA 23PRE1011280, and T32GM007267.References
[1] S. A. Goldman, -Ibanez Juan Antonio Requena, A. Devesa, -Gallego Carlos G. Santos, J. J. Badimon, and V. Fuster, “Uncovering the Role of Epicardial Adipose Tissue in Heart Failure With Preserved Ejection Fraction,” JACC Adv., vol. 2, no. 9, p. 100657, Nov. 2023, doi: 10.1016/j.jacadv.2023.100657.
[2] L. Boutens and R. Stienstra, “Adipose tissue macrophages: going off track during obesity,” Diabetologia, vol. 59, no. 5, pp. 879–894, May 2016, doi: 10.1007/s00125-016-3904-9.
[3] M. M. Robblee et al., “Saturated Fatty Acids Engage an IRE1α-Dependent Pathway to Activate the NLRP3 Inflammasome in Myeloid Cells,” Cell Rep., vol. 14, no. 11, pp. 2611–2623, Mar. 2016, doi: 10.1016/j.celrep.2016.02.053.
[4] S. A. Shah, J. T. Echols, C. Sun, M. J. Wolf, and F. H. Epstein, “Accelerated fatty acid composition MRI of epicardial adipose tissue: Development and application to eplerenone treatment in a mouse model of obesity‐induced coronary microvascular disease,” Magn. Reson. Med., p. mrm.29348, Jun. 2022, doi: 10.1002/mrm.29348.
[5] J. E. Bresticker, S. A. Shah, B. A. French, A. Marette, M. J. Wolf, and F. H. Epstein, “Is T1 a biomarker of pro-inflammatory epicardial adipose tissue?,” presented at the Society of Cardiovascular Magnetic Resonance, Virtual, Feb. 2022.
[6] F. Lugauer, D. Nickel, J. Wetzl, B. Kiefer, J. Hornegger, and A. Maier, “Accelerating multi-echo water-fat MRI with a joint locally low-rank and spatial sparsity-promoting reconstruction,” Magn. Reson. Mater. Phys. Biol. Med., vol. 30, no. 2, pp. 189–202, Apr. 2017, doi: 10.1007/s10334-016-0595-7.
[7] J. Berglund and J. Kullberg, “Three-dimensional water/fat separation and T estimation based on whole-image optimization—Application in breathhold liver imaging at 1.5 T,” Magn. Reson. Med., vol. 67, no. 6, pp. 1684–1693, 2012, doi: 10.1002/mrm.23185.
[8] M. Schneider et al., “Accurate fatty acid composition estimation of adipose tissue in the abdomen based on bipolar multi‐echo MRI,” Magn. Reson. Med., vol. 81, no. 4, pp. 2330–2346, Apr. 2019, doi: 10.1002/mrm.27557.
[9] H. Nakajima et al., “Inulin reduces visceral adipose tissue mass and improves glucose tolerance through altering gut metabolites,” Nutr. Metab., vol. 19, p. 50, Jul. 2022, doi: 10.1186/s12986-022-00685-1.
Figures
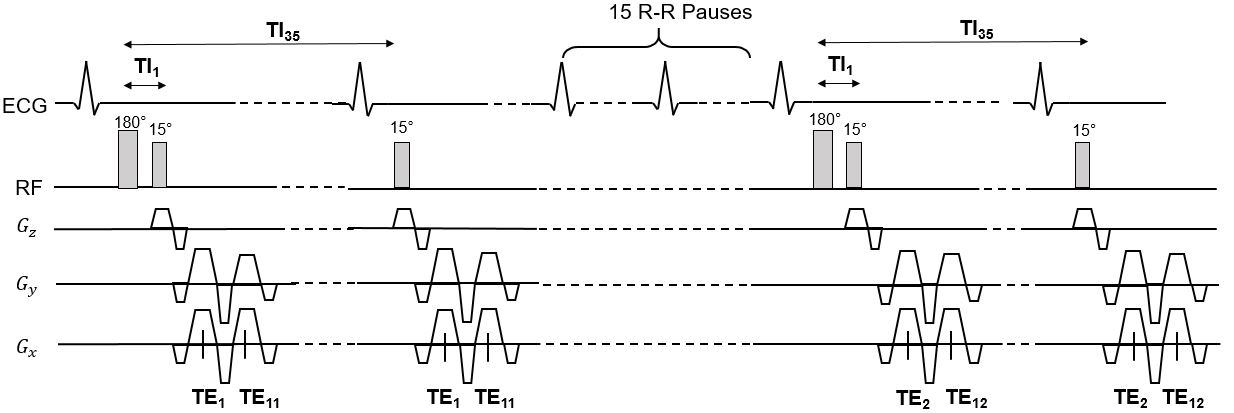
Figure 1: Inversion recovery interleaved radial multi-echo gradient-echo FACT sequence with 35 inversion times, 15 R-R interval pauses, and 20 echo times. Multi-echo gradient-echo acquisitions were ECG gated to synchronize data acquisition with the beating heart. Pauses were employed to allow magnetization recovery. Dual gradient echo acquisitions were interleaved to achieve an effective echo spacing of 0.2 ms. TE = echo time. TI = inversion time.
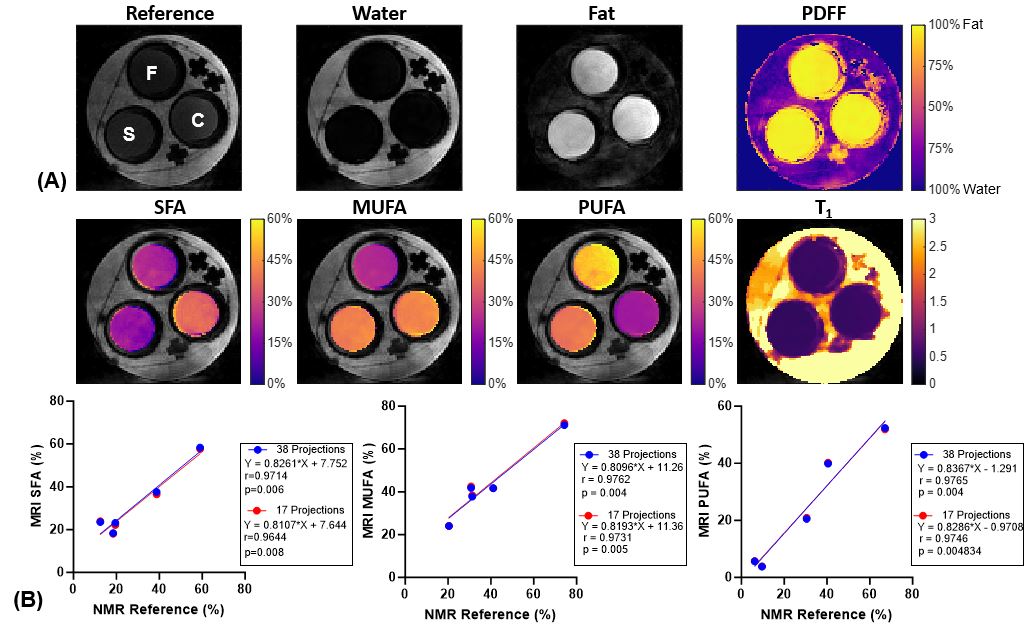
Figure 2: Fat composition phantom validation. (A) FACT maps in an oil/water phantom containing three validation oils: F = flaxseed, S = sesame, C = 25% coconut/75% sesame. PDFF = proton density fat fraction. Maps are plotted as colormaps over the combined water/fat image. (B) Linear regression plots between the mean FACT-derived values and reference values for all oils using 38 or 17 projections. Imaging parameters were: TE = 1.4-5.4 ms, ΔTE = 0.2 ms, TI = 3.4 ms – 3.4 s, ΔTI = 120 ms, FOV = 36 x 36 mm2, BW = 100 kHz, flip angle = 15°, resolution = 28.1 x 28.1 mm2. A simulated ECG with HR = 500 bpm was used.
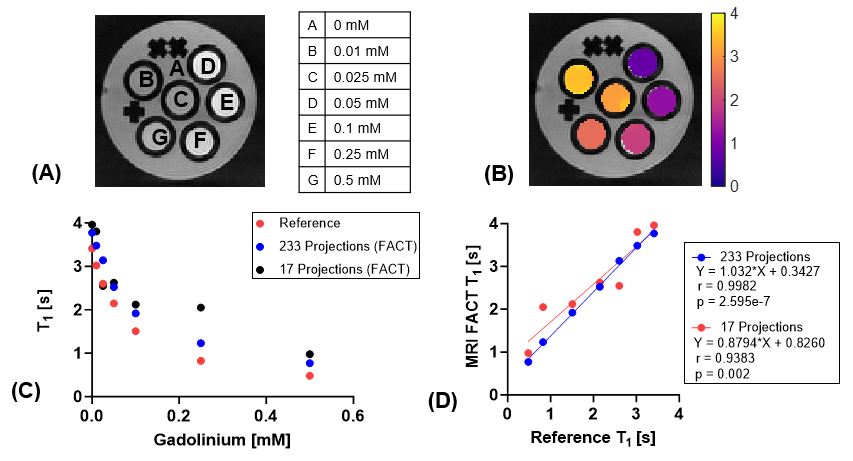
Figure 3: T1 phantom validation. (A) Reference image of water-gadolinium phantom with various gadolinium concentrations. (B) Map of FACT-derived T1 values. (C) T1 values for increasing gadolinium concentrations determined from a conventional T1 mapping method (reference) and the FACT method using 233 and 17 projections. (D) Linear regression plots between reference T1 values and FACT-derived T1 values for nominally fully sampled (233 projections) and accelerated (17 projections) acquisitions. Imaging parameters were the same as figure 2.
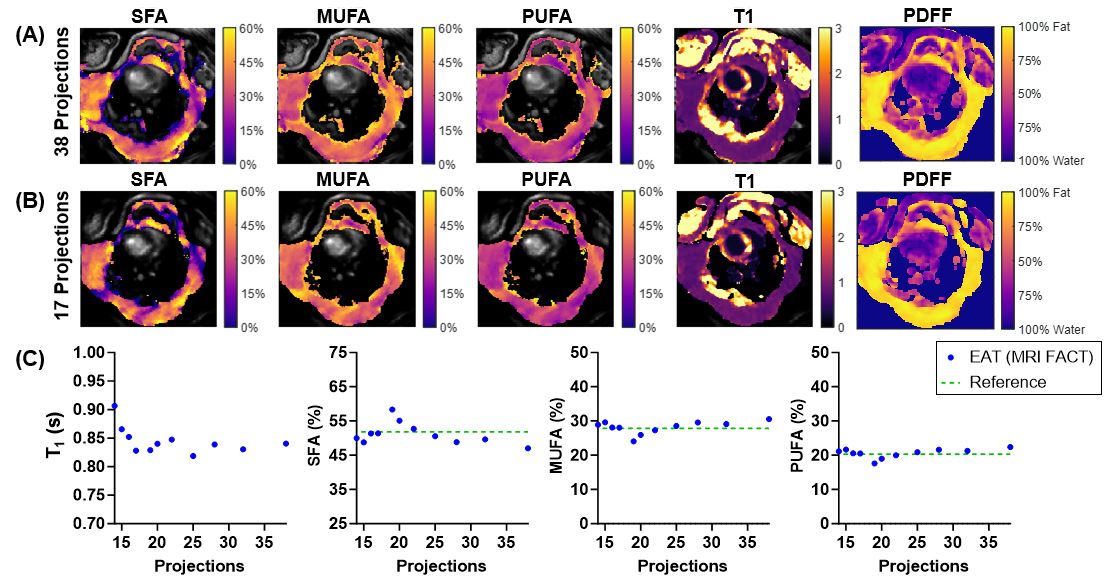
Figure 4: In-vivo validation. FACT maps in an obese mouse computed from datasets with 38 (A) and 17 (B) projections. Maps are plotted as colormaps over the combined water/fat image. (C) Average EAT T1, SFA, MUFA, and PUFA values compared to reference values from datasets with 38 to 14 projections. EAT FACT values are consistent across acceleration rates, while increases in T1 were observed when using fewer than 17 projections. Imaging parameters were: TE = 1.4-5.4 ms, ΔTE = 0.2 ms, TI = 3.4 ms – 3.4 s, ΔTI = 120 ms, FOV = 25 x 25 mm2, BW = 100 kHz, flip angle = 15°, resolution = 0.2 x 0.2 mm2, HR = 500 bpm.