1172
Phase-Specific Spatiotemporal Fractal Analysis and Radiomics of Free-breathing Stress Myocardial Perfusion1Chemical and Biomedical Engineering, University of Missouri Columbia, Columbia, MO, United States, 2Radiology, University of Missouri Columbia, Columbia, MO, United States, 3Medicine-Cardiology, University of Missouri Columbia, Columbia, MO, United States
Synopsis
Keywords: Myocardium, Perfusion
Motivation: This research advances quantitative analysis of myocardial perfusion MRI, potentially enhancing the precision of coronary microvascular disease diagnosis.
Goal(s): To establish a novel spatiotemporal radiomics and fractal analysis approach, assessing myocardial perfusion patterns and complexity throughout all temporal frames of stress MRI.
Approach: Employing free-breathing stress myocardial perfusion MRI, we utilized a comprehensive pixel-by-pixel spatiotemporal feature extraction, alongside phase-specific analysis, to derive global and segmental perfusion insights.
Results: Preliminary results indicate our method's efficacy in motion correction and feature extraction, offering a new quantitative perspective on myocardial perfusion, potentially relevant for CMD assessment.
Impact: The study introduces a framework that quantitatively captures myocardial perfusion patterns, potentially paving the way for enhanced diagnostic methods in coronary microvascular disease and facilitating a more precise approach to patient assessment.
Background
Myocardial perfusion MRI with vasodilator stress is important for assessing cardiac disease such as coronary artery disease (CAD) and coronary microvascular disease (CMD) (1). Machine learning radiomics methods have shown promise in analyzing the patterns of CMR (2,3); however, first-pass perfusion MRI presents challenges in radiomics analysis due to its low signal-to-noise ratio and cardiac and respiratory motion. While fractal analysis has been used to analyze perfusion patterns of transition regions, it requires localization of specific temporal frames and transition regions (4), which is challenging and time-consuming. In this work, we aimed for an innovative spatiotemporal perfusion feature-based analysis framework leveraging the pixel-by-pixel features from all temporal frames.Methods
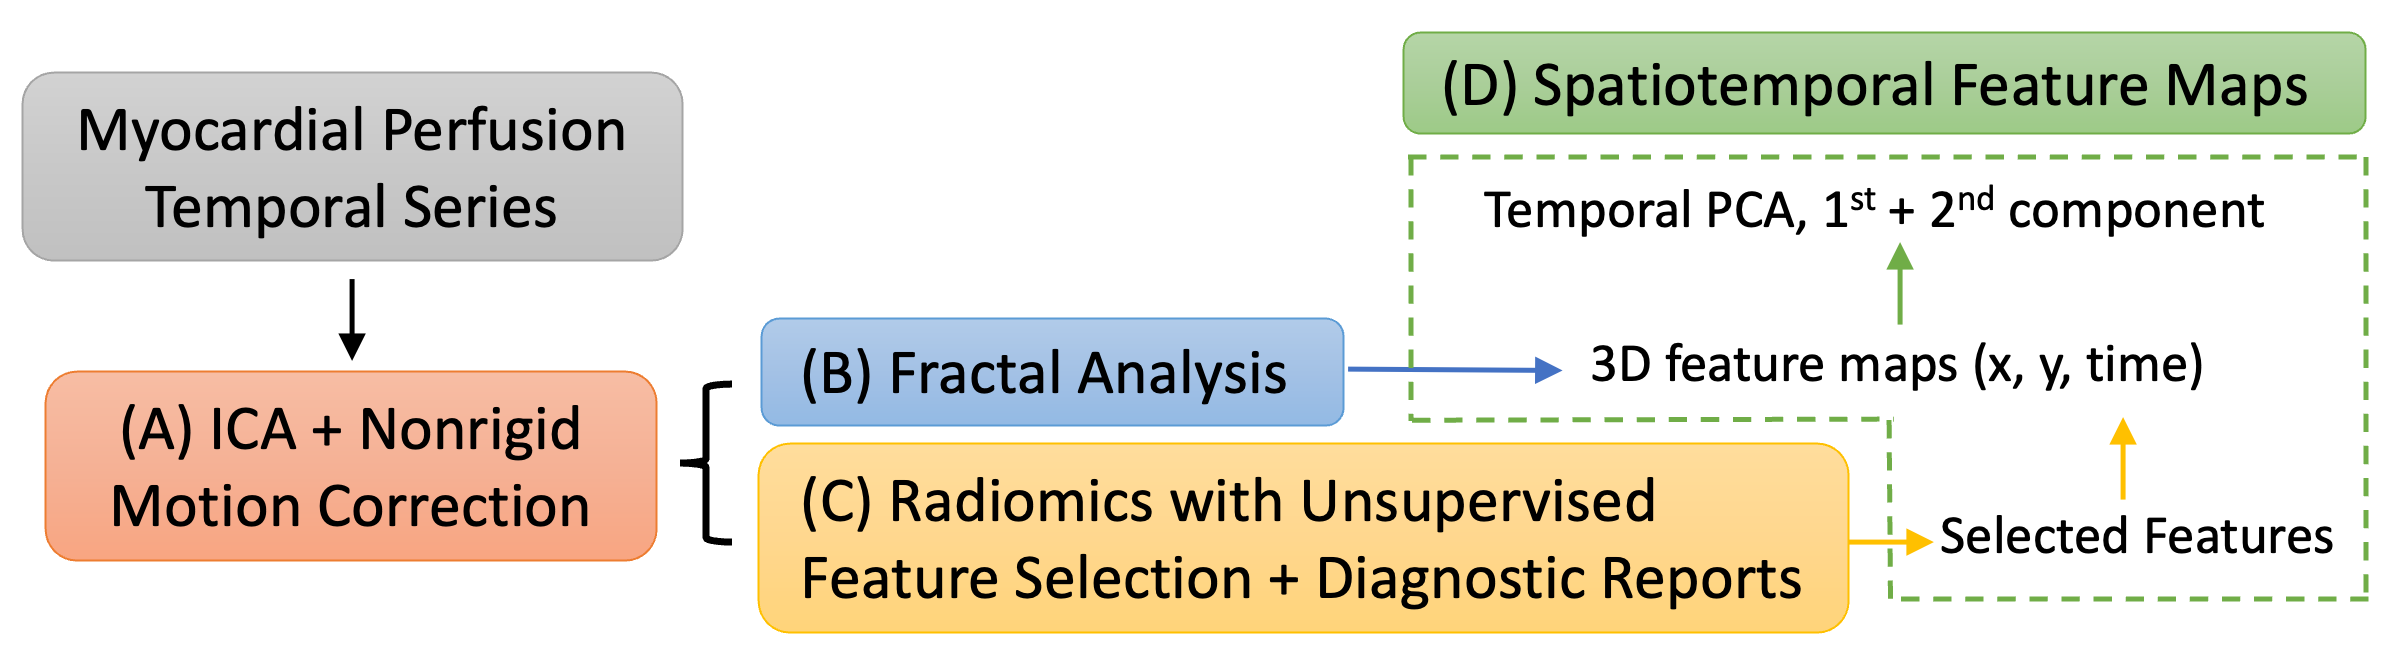
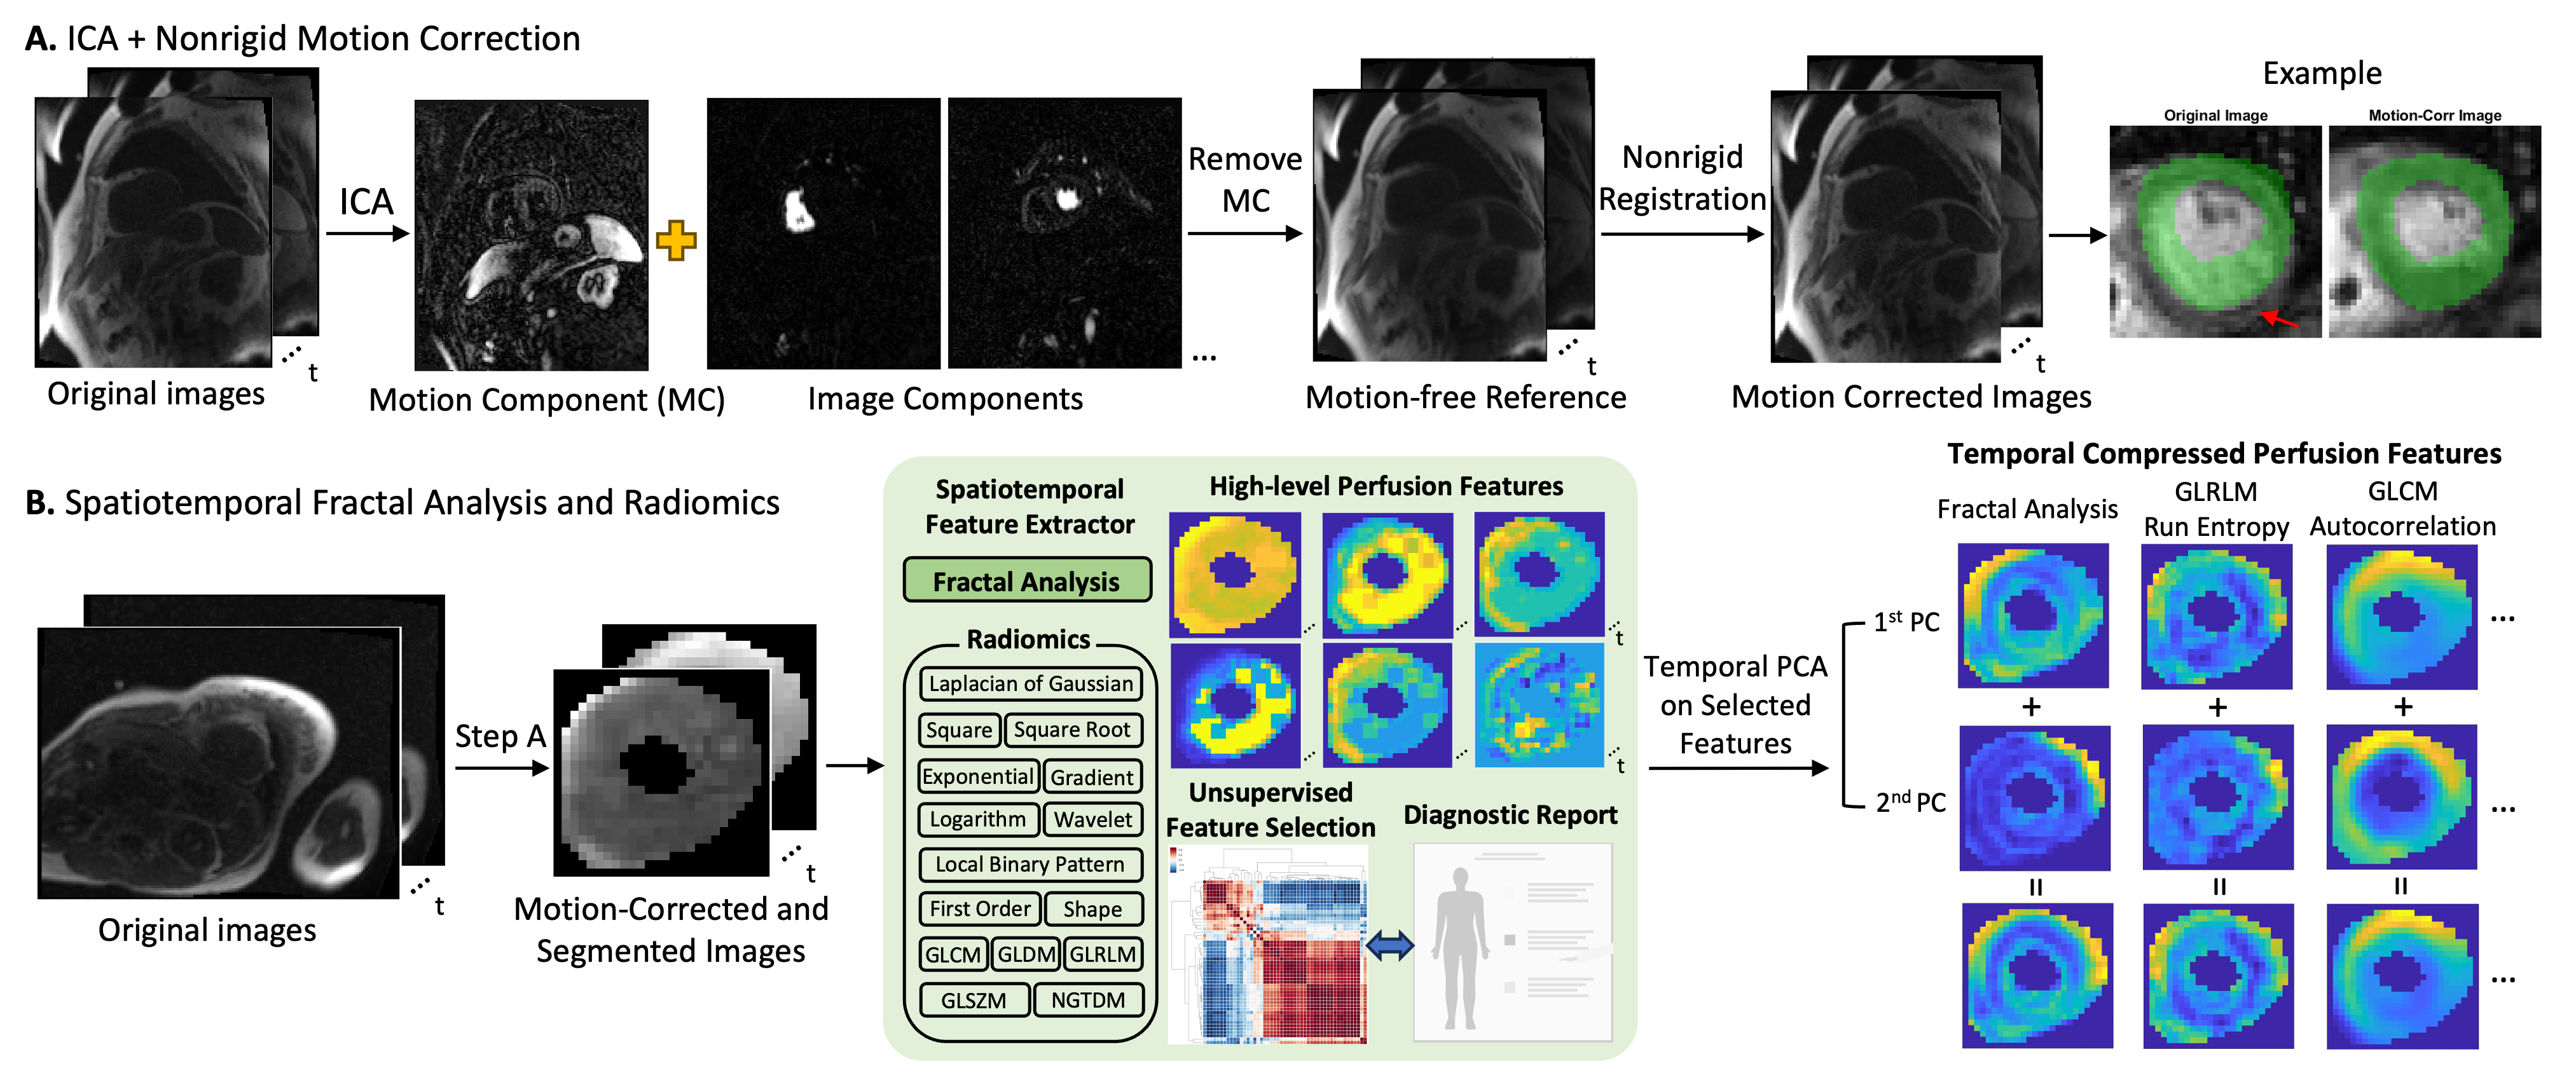
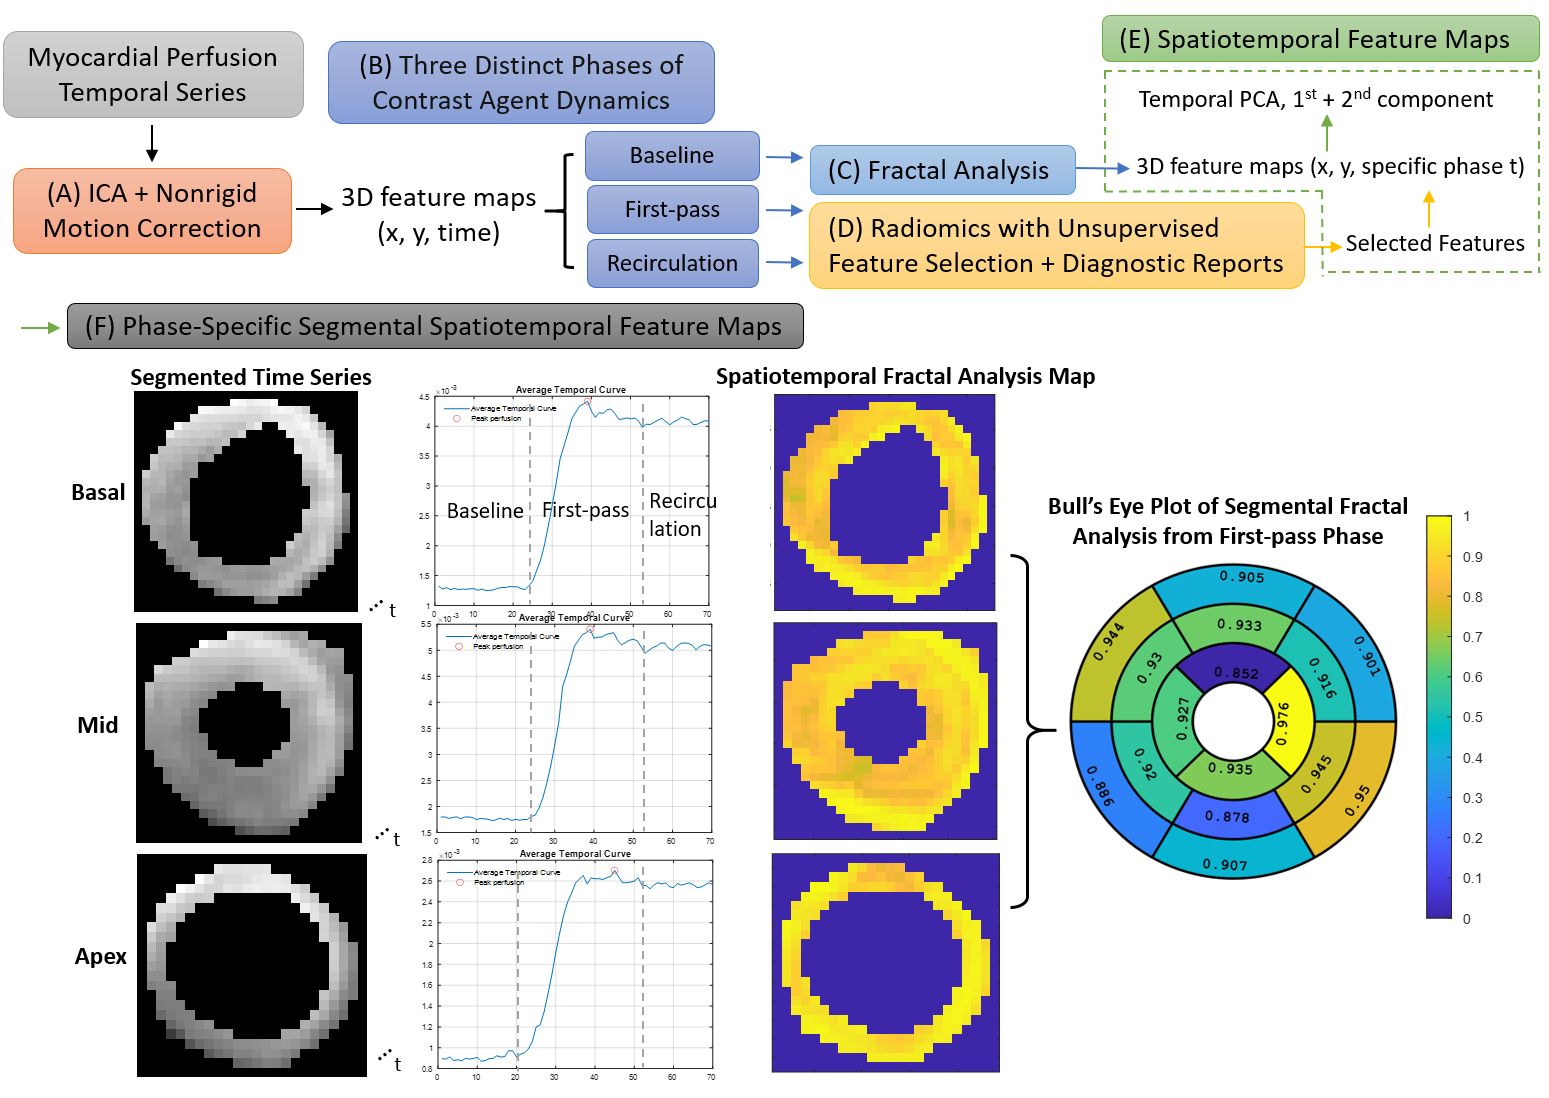
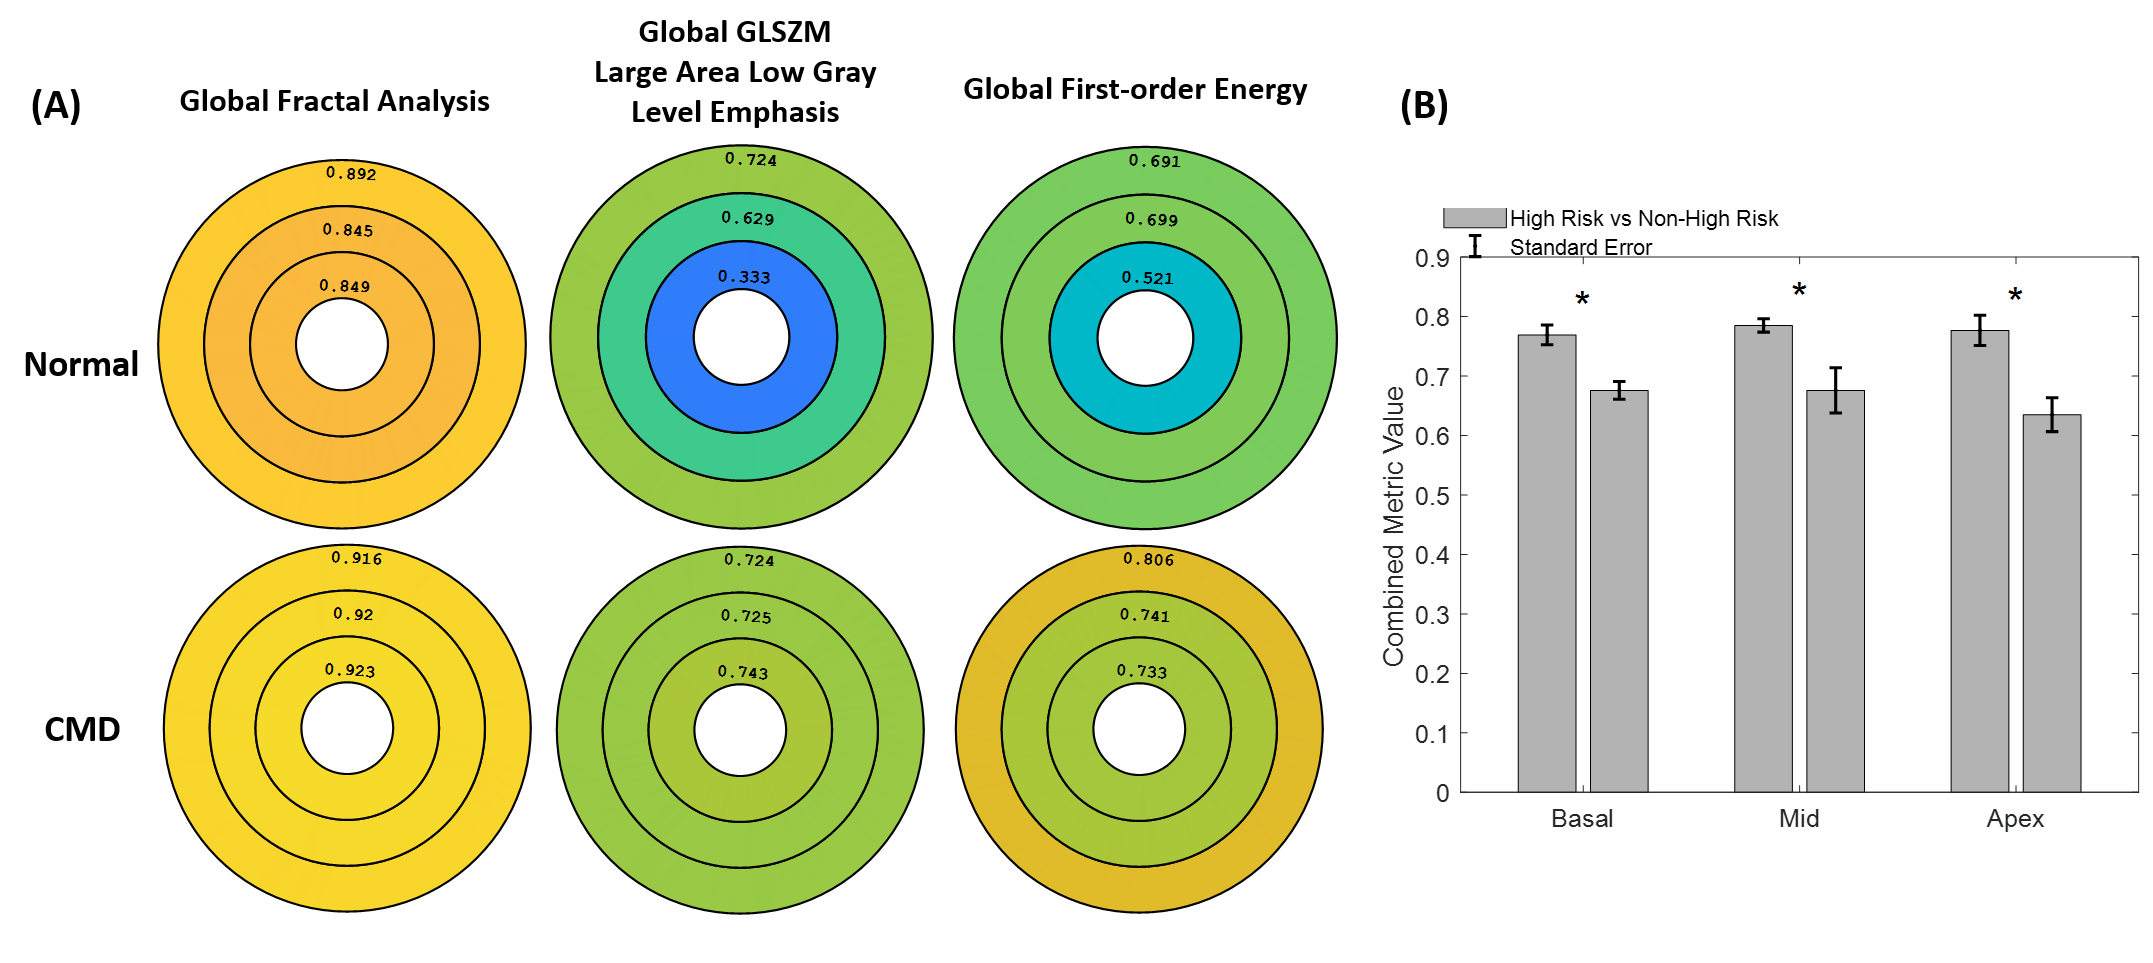
Twenty datasets (4200 images) were collected on a 1.5T scanner (Aera, Siemens) using a routine saturation-recovery gradient-echo sequence with rate-2 undersampling and GRAPPA reconstruction. Acquisitions were made for 70 heartbeats at three short-axis slices with 2.3mm resolution under the administration of gadolinium and regadenoson. Motion-free reference images were generated using independent component analysis (ICA), and non-rigid motion correction (5) was applied to the original images using the ICA-based reference. Pixel-by-pixel radiomics were calculated using Pyradiomics (6) for each temporal frame, producing 70 radiomics feature maps for each feature and slice. Unsupervised recursive feature elimination (7) with k-means clustering was utilized to select five features from all feature categories (first order, GLCM, GLRLM, GLSZM, gradient, and wavelet), and diagnostic reports were further used to select two radiomics features. Fractal analysis (FA) was implemented using the blanket method (8) in C++ to efficiently generate perfusion complexity maps for each temporal frame. The spatiotemporal radiomics and FA were processed using PCA across time, compressing the 70 maps into one comprehensive map per pixel (Figure 1). This enabled the analysis of all temporal frames using a single feature map per feature and facilitated pixel-by-pixel quantification of perfusion features and complexity.Perfusion features may vary between three different phases of dynamic contrast agents (baseline, first-pass and recirculation), so phase-specific spatiotemporal analysis method is developed and applied to 8 diagnostically normal patients and a diagnostic CMD patient as an example (Figure 4). AHA 16 segmental analysis of the feature values were calculated for each phase. As these are all diagnostically normal patients, the disease labels in these initial results are missing. To show the difference in these 8 patients, the average of the global feature values were used and the median value of all patients was considered as a threshold. The significance of the two groups separated using the threshold is measured with paired t-test for investigating the difference of these diagnostic normal patients with the three features (Figure 5).Results
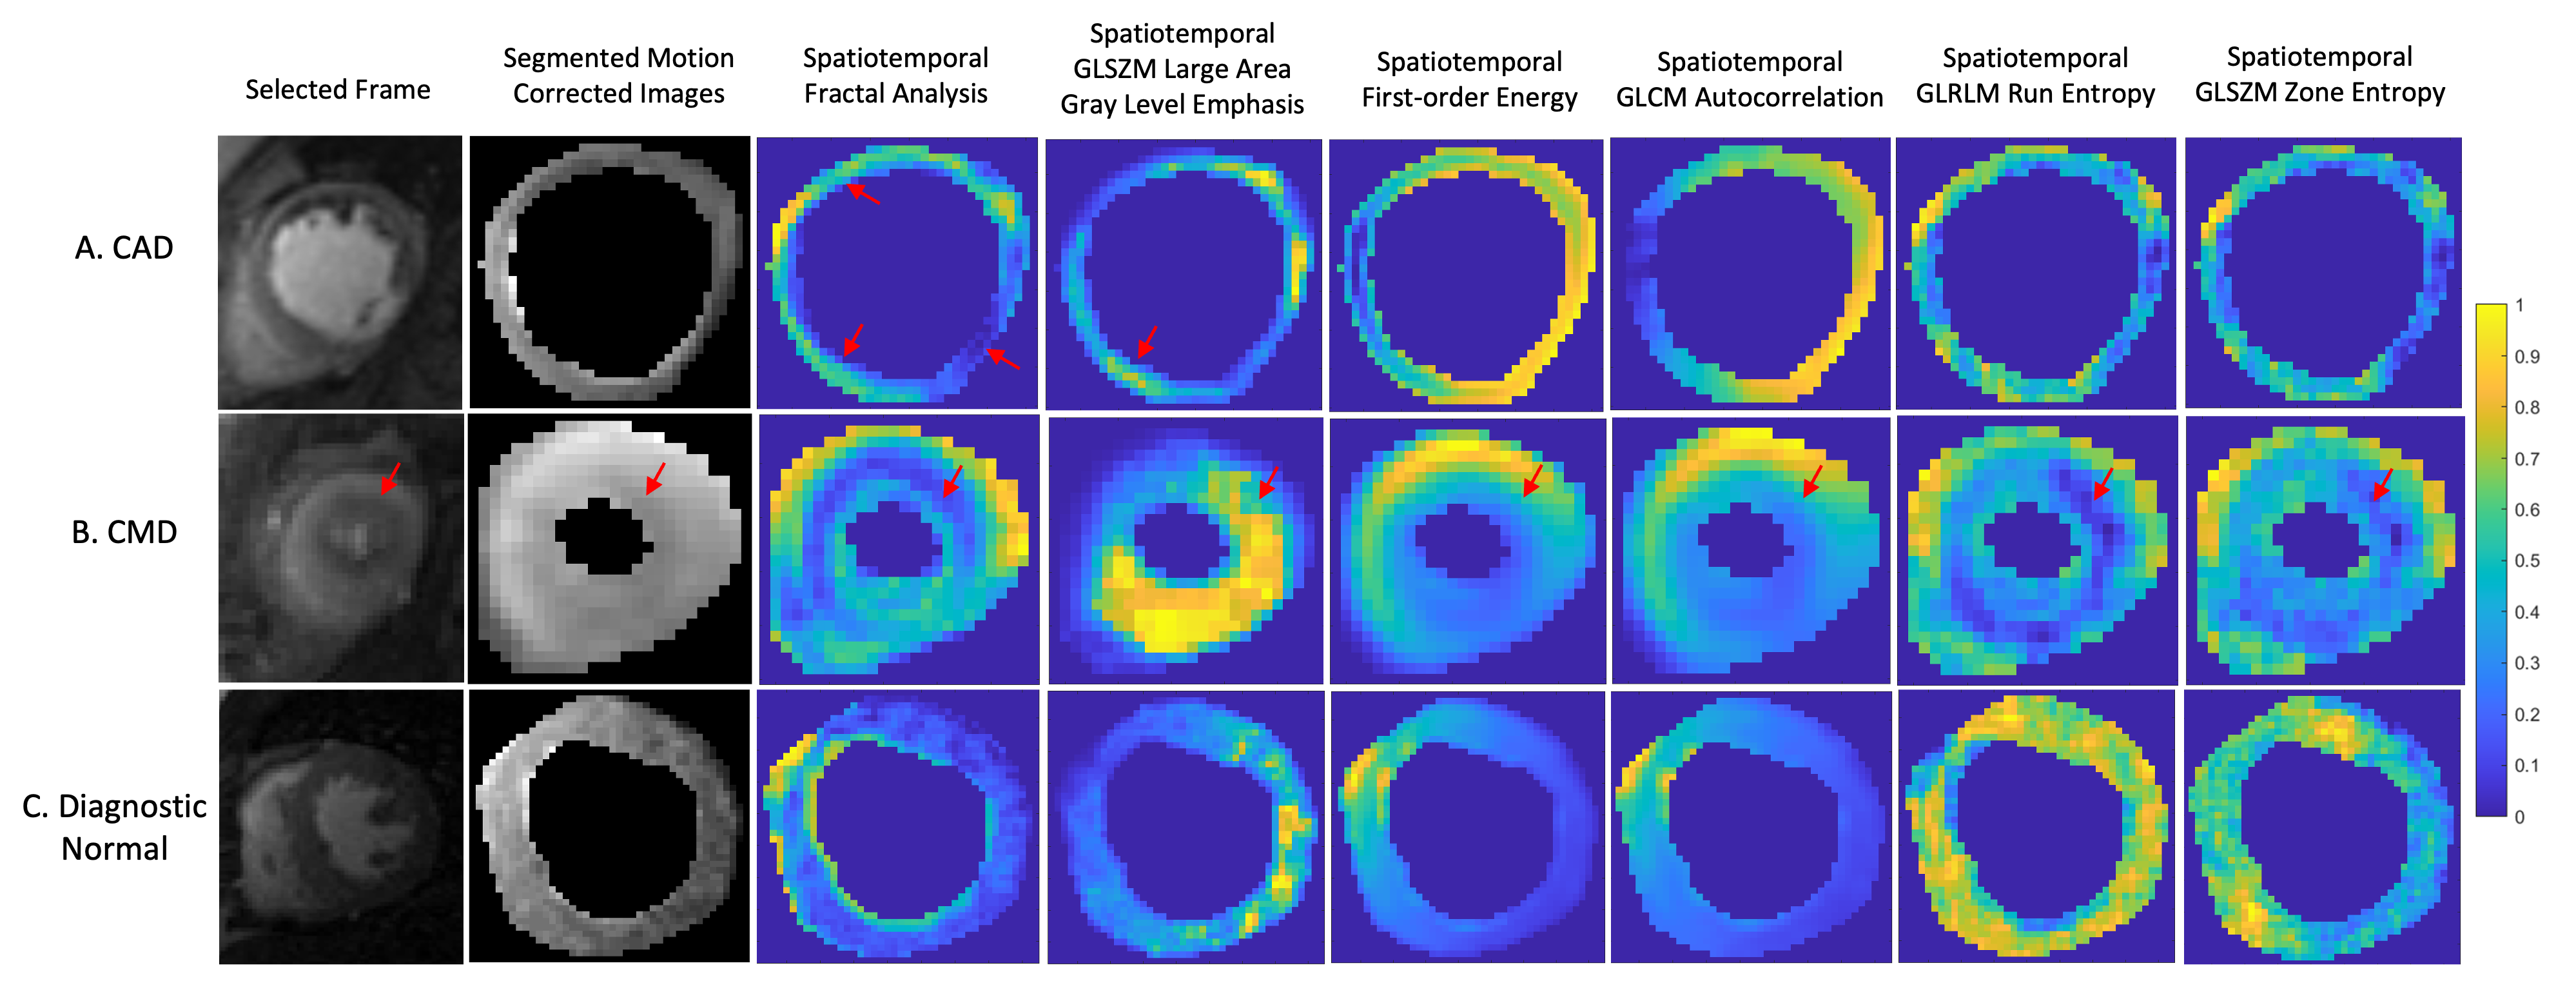
Figure 2A depicts the motion correction process, showing the performance pre and post non-rigid motion correction. Figure 2B shows images from a CMD patient, illustrating the effects of spatiotemporal radiomics and FA with the primary two principal components. This approach enables pixel-by-pixel quantification of perfusion features and complexity from all temporal frames. Figure 3 shows examples of patients with (A) CAD, (B) CMD and (C) diagnosed as normal. The FA and selected radiomics features provide a quantitative analysis of varying perfusion patterns, indicating its potential as an alternative method for identifying complex coronary artery diseases. Figure 5A shows the comparison of the global feature maps using three slices of a diagnostic CMD patient and a diagnostic normal patient. The median values of the mean of fractal analysis, GLSZM Large Area Low Gray Level Emphasis and first order energy are 0.72, 0.75 and 0.7. The p-value of basal, mid-ventricular and apical slice is smaller than 0.05, which shows significantly different between diagnostic normal patients (Figure 5B). The significant differences observed suggest the possibility of distinct risk profiles within an otherwise normal cohort, potentially enabling refined risk stratification based on myocardial perfusion characteristics as captured by the employed radiomics and fractal analysis.Conclusions
The proposed spatiotemporal fractal analysis and radiomics provide a quantitative method for analyzing phase-specific global and segmental myocardial perfusion patterns and complexity, potentially improving the identification and prediction of complicated vascular diseases like CMD.Acknowledgements
No acknowledgement found.References
[1] Dewey M, Siebes M, Kachelriess M, Kofoed KF, Maurovich-Horvat P, Nikolaou K, Bai W, Kofler A, Manka R, Kozerke S, Chiribiri A, Schaeffter T, Michallek F, Bengel F, Nekolla S, Knaapen P, Lubberink M, Senior R, Tang MX, Piek JJ, van de Hoef T, Martens J, Schreiber L, Quantitative Cardiac Imaging Study G. Clinical quantitative cardiac imaging for the assessment of myocardial ischaemia. Nat Rev Cardiol 2020;17(7):427-450.2.
[2] Hassani C, Saremi F, Varghese BA, Duddalwar V. Myocardial Radiomics in Cardiac MRI. AJR Am J Roentgenol 2020;214(3):536-545.3.
[3] Jang J, El-Rewaidy H, Ngo LH, Mancio J, Csecs I, Rodriguez J, Pierce P, Goddu B, Neisius U, Manning W, Nezafat R. Sensitivity of Myocardial Radiomic Features to Imaging Parameters in Cardiac MR Imaging. J Magn Reson Imaging 2021;54(3):787-794.4.
[4] Michallek F, Dewey M. Fractal analysis of the ischemic transition region in chronic ischemic heart disease using magnetic resonance imaging. Eur Radiol 2017;27(4):1537-1546.5.
[5] Pontre B, Cowan BR, DiBella E, Kulaseharan S, Likhite D, Noorman N, Tautz L, Tustison N, Wollny G, Young AA, Suinesiaputra A. An Open Benchmark Challenge for Motion Correction of Myocardial Perfusion MRI. IEEE J Biomed Health Inform 2017;21(5):1315-1326.6.
[6] van Griethuysen JJM, Fedorov A, Parmar C, Hosny A, Aucoin N, Narayan V, Beets-Tan RGH, Fillion-Robin JC, Pieper S, Aerts H. Computational Radiomics System to Decode the Radiographic Phenotype. Cancer Res 2017;77(21):e104-e107.7.
[7] Guyon I, Weston J, Barnhill S, Vapnik V. Gene selection for cancer classification using support vector machines. Mach Learn 2002;46(1-3):389-422.8.
[8] Peleg S, Naor J, Hartley R, Avnir D. Multiple resolution texture analysis and classification. IEEE Trans Pattern Anal Mach Intell 1984;6(4):518-523.
Figures