1168
Predicting the response of I-SPY 2 breast cancer patients to treatment using a biology-based mathematical model calibrated with quantitative MRI1Department of Biomedical Engineering, The University of Texas at Austin, Austin, TX, United States, 2Department of Imaging Physics, The University of Texas MD Anderson Cancer Center, Houston, TX, United States, 3Oden Institute for Computational Engineering and Sciences, The University of Texas at Austin, Austin, TX, United States, 4Department of Breast Imaging, The University of Texas MD Anderson Cancer Center, Houston, TX, United States, 5Department of Biostatistics, The University of Texas MD Anderson Cancer Center, Houston, TX, United States, 6Institute for Data Science in Oncology, The University of Texas MD Anderson Cancer Center, Houston, TX, United States, 7Department of Cancer Systems Imaging, The University of Texas MD Anderson Cancer Center, Houston, TX, United States, 8Department of Abdominal Imaging, The University of Texas MD Anderson Cancer Center, Houston, TX, United States, 9Department of Diagnostic Medicine, Dell Medical School, Austin, TX, United States, 10Department of Oncology, Dell Medical School, Austin, TX, United States, 11Livestrong Cancer Institutes, Dell Medical School, Austin, TX, United States
Synopsis
Keywords: Cancer, Modelling, Computational Oncology, Breast Cancer, Treatment Response, Tumor Prediction
Motivation: Optimizing treatment to improve outcomes necessitates a robust tool to accurately predict breast cancer response on a patient-specific basis.
Goal(s): We are applying our biology-based mathematical model to I-SPY 2 breast cancer patients to test if its predictive ability generalizes to multi-site data.
Approach: Quantitative contrast-enhanced and diffusion-weighted MRI data collected early during treatment were used to calibrate a mathematical model describing tumor cell movement, proliferation, and response. After calibration, the model predicts tumor status after the treatment regimen.
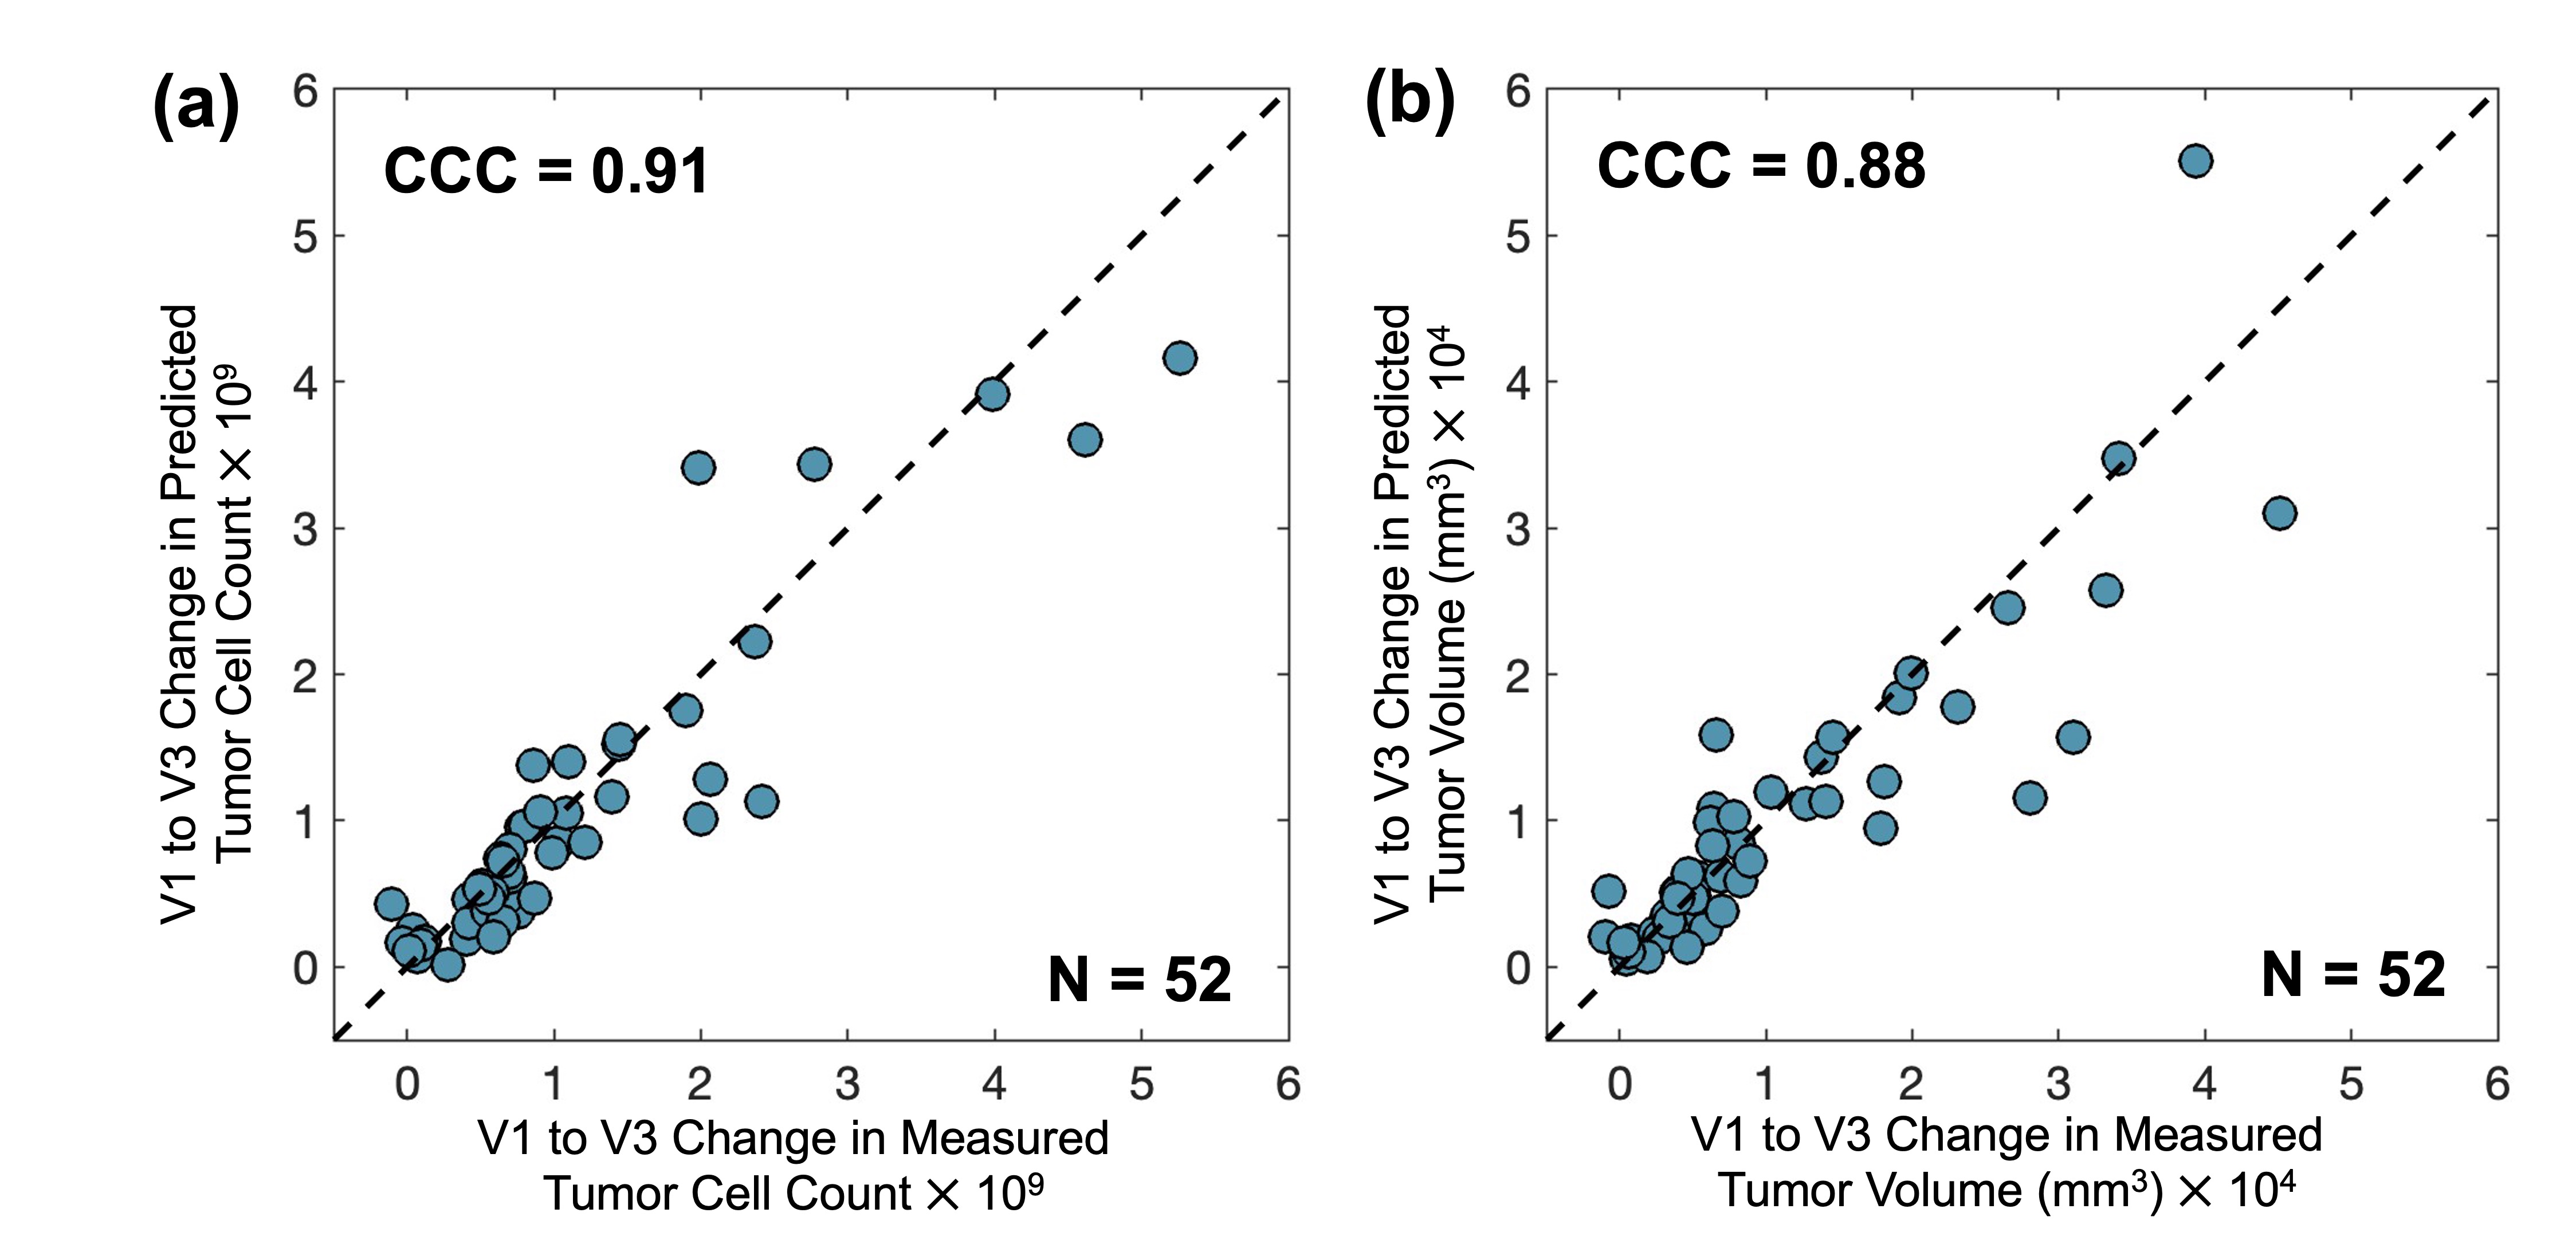
Results: The concordance correlation coefficient between the measured and predicted 9-week change was 0.91 for tumor cellularity and 0.88 for tumor volume.
Impact: The high degree of agreement between measured and predicted changes in tumor cellularity and volume in the I-SPY 2 dataset indicates that our biology-based mathematical model can potentially make accurate predictions using MRI data from multiple clinical sites.
Introduction
Neoadjuvant systemic therapy (NAT) is the standard of care for patients with locally advanced breast cancer.1-3 Optimizing NAT on a patient-specific basis necessitates accurate and early prediction of tumor response to therapy. Patient-specific predictions are essential because population-based approaches are limited in their ability to capture changes unique to the individual. The biology-based mathematical model used by Wu et al. achieved a concordance correlation coefficient (CCC) of 0.97 between the measured and predicted change in total tumor cellularity for triple-negative breast cancer patients (N=56).4 The goal of this study is to extend the modeling framework5 to accurately predict response to NAT for breast cancer patients of several subtypes from the multi-site, multi-drug I-SPY 2 clinical trial.6Methods
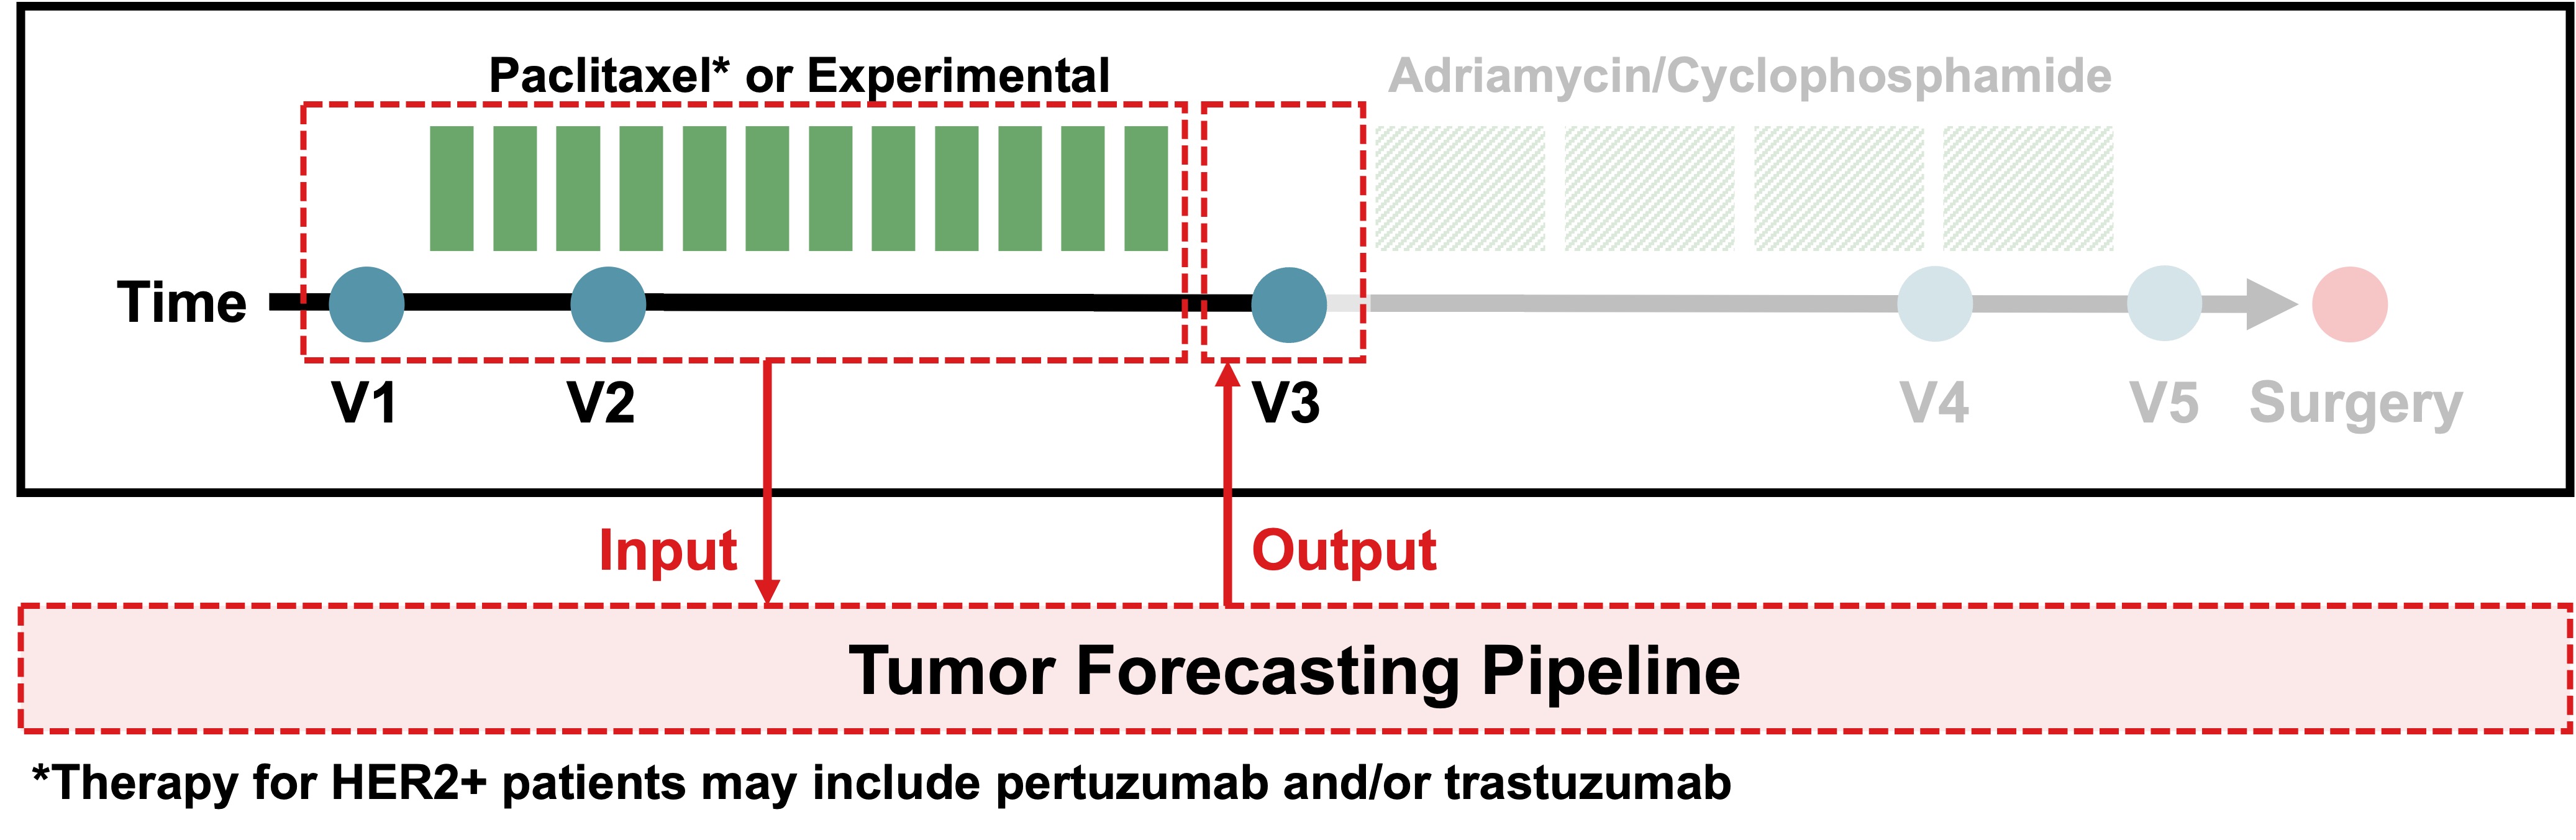
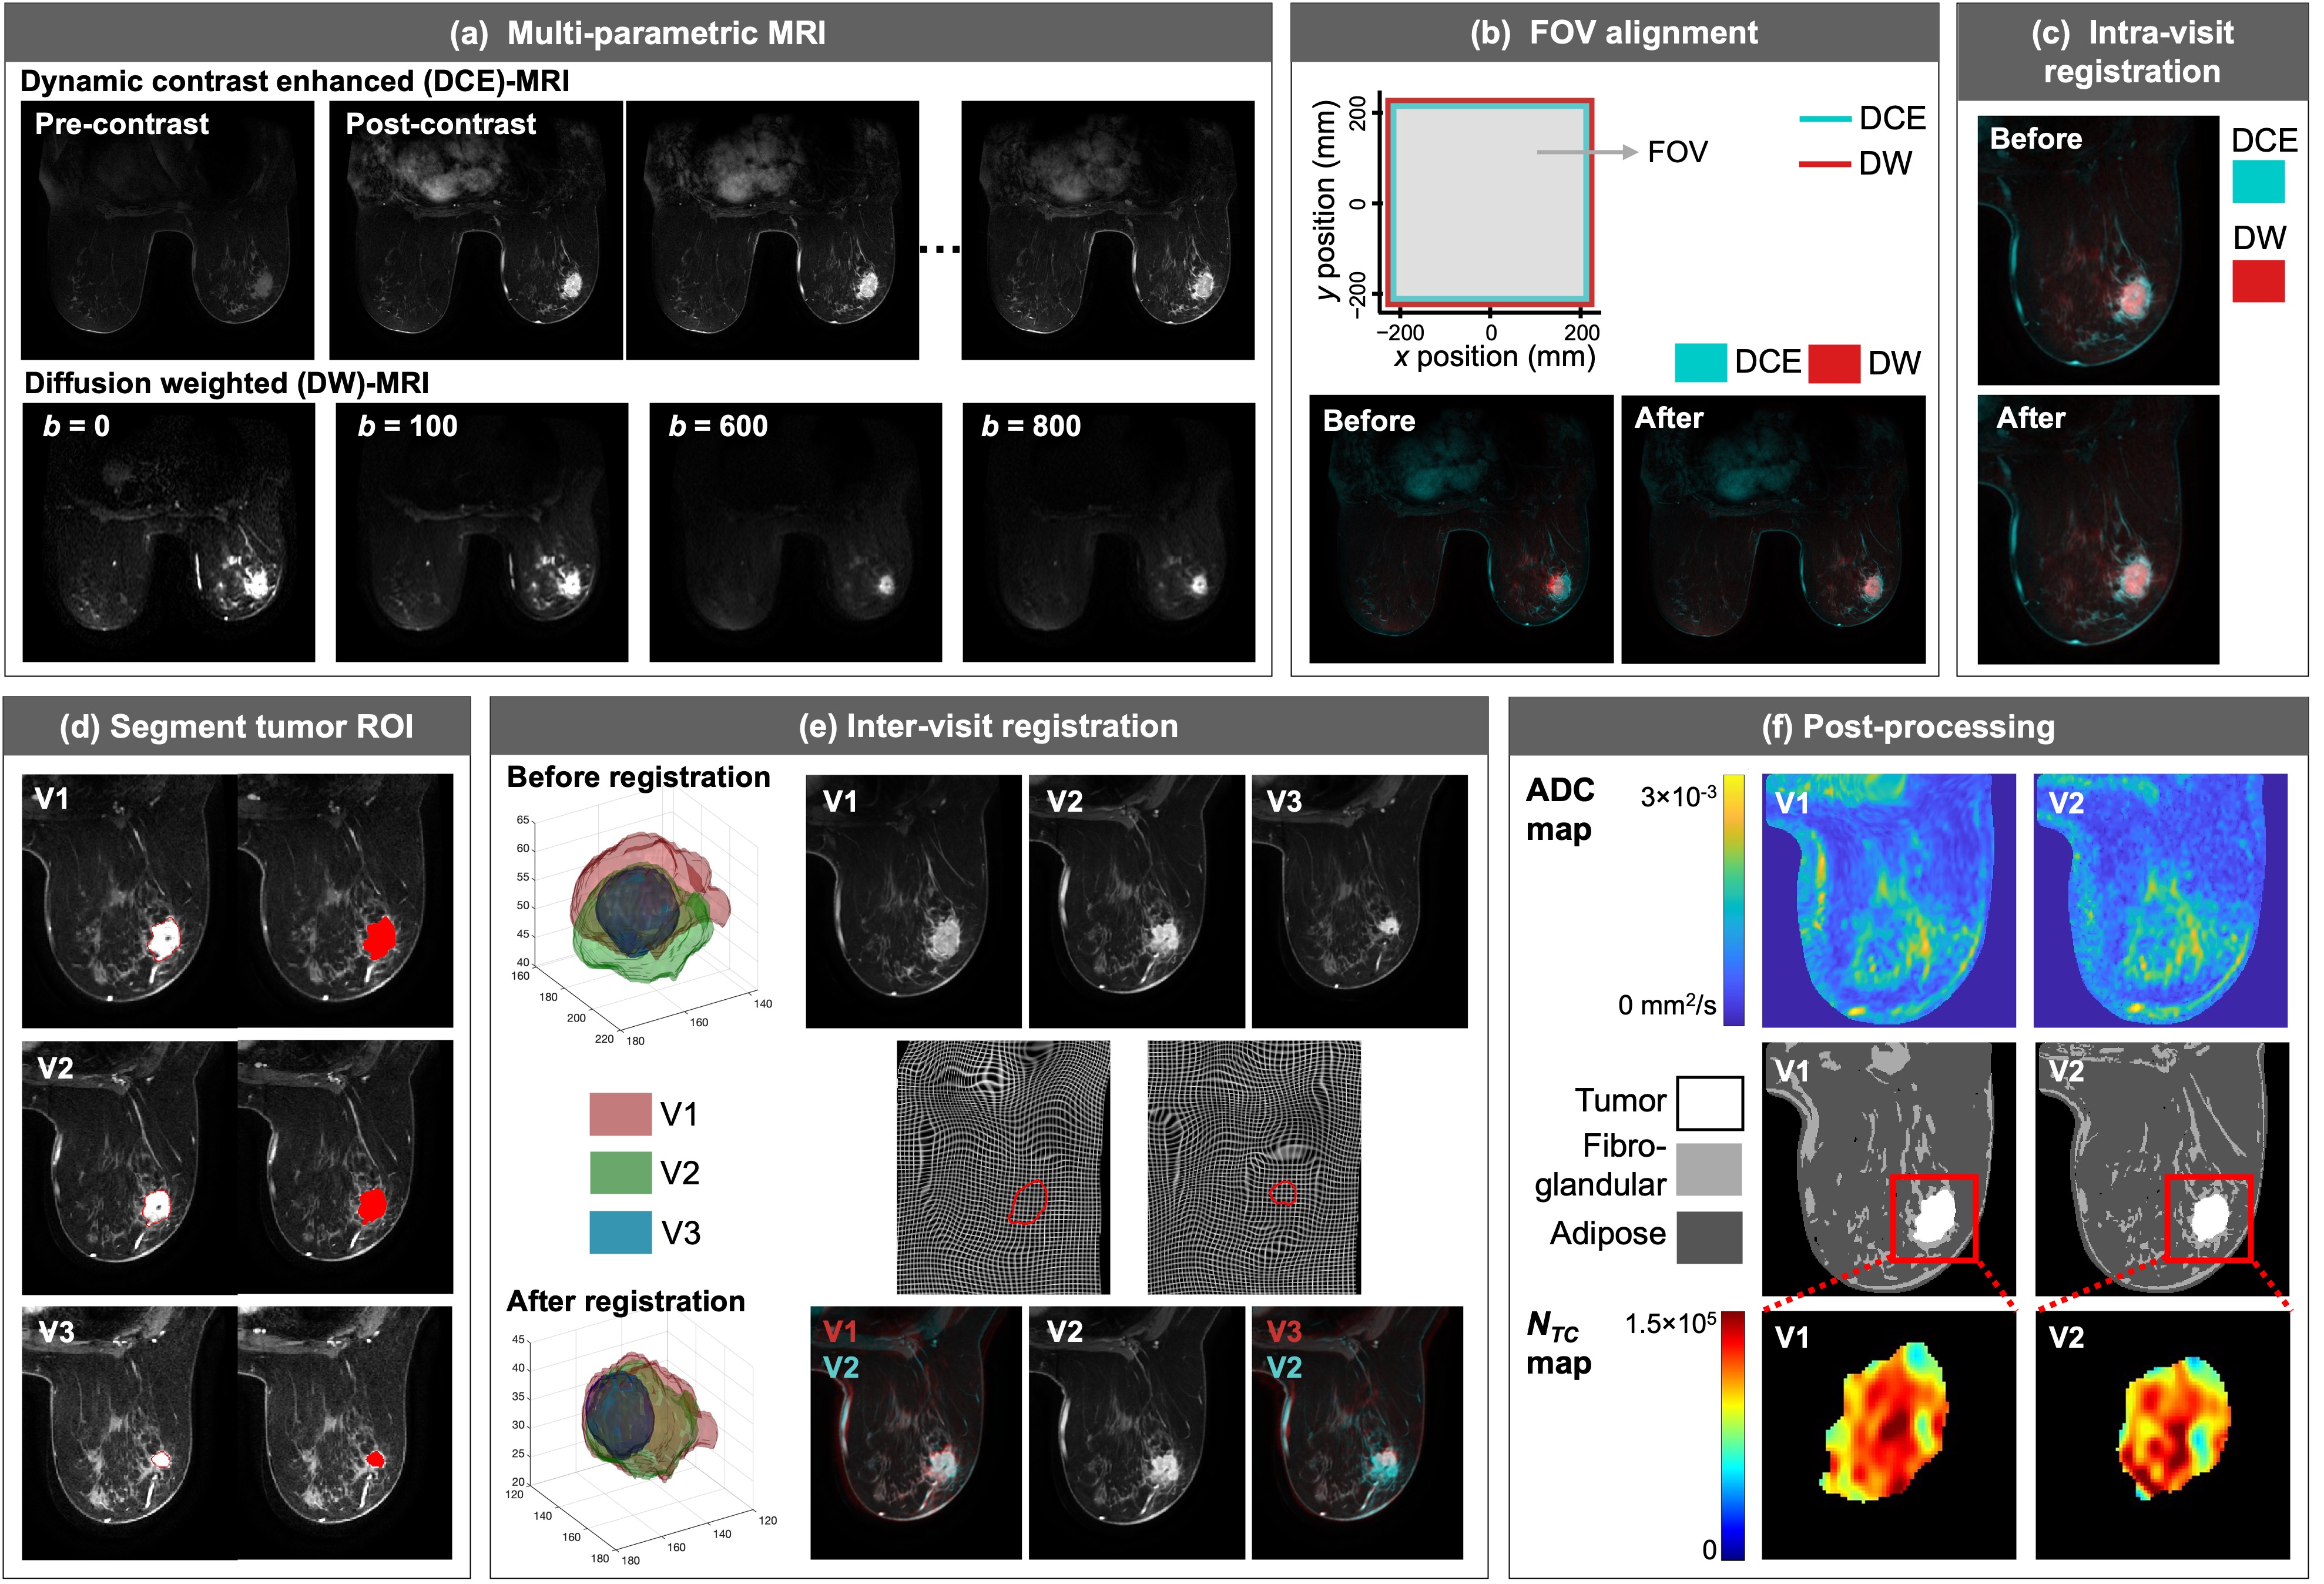
Patient population. I-SPY 2 is a clinical trial for locally advanced breast cancer that acquired dynamic contrast enhanced (DCE) and diffusion-weighted (DW) MRI scans before and during NAT.6 Our subset of 94 patients—who received treatment and imaging at 10 clinical sites—includes a range of breast cancer subtypes as determined by the presence of human epidermal growth factor receptor 2 (HER2) and estrogen and progesterone receptors (hormone receptors, HR). The MRI data was acquired before (V1), after three weeks (V2), and after completion (V3) of the first NAT regimen (Fig. 1), and pathological complete response (pCR) status was determined at the time of surgery.MRI analyses. For each patient, we first corrected for motion within and between the DCE-MRI and DW-MRI series across time (i.e., V1 to V3) using a combination of rigid and tumor-constrained non-rigid registration (Fig. 2).5 Apparent diffusion coefficient (ADC) maps were generated by fitting DW-MRI scans with b-values of 0, 100, 600, and 800 s/mm2. We segmented the tumor ROI by applying fuzzy c-means clustering and segmented adipose and fibroglandular tissues with k-means clustering. The voxel-wise number of tumor cells, NTC(x,t), was calculated from the ADC map.
Biology-based mathematical model. Our biology-based model is a reaction-diffusion partial differential equation that describes the voxel-wise rate of change in NTC(x,t) as the balance of cell diffusion, D(x,t), logistic proliferation, k(x), and death due to treatment via Eq. 1:7
$$ \frac{\partial N_{TC}(\textbf{x},t)}{\partial t}=\nabla \cdot \big(D(\textbf{x},t) \nabla N_{TC} (\textbf{x},t)\big)+k(\textbf{x}) \bigg(1-\frac{N_{TC}(\textbf{x},t)}{\theta}\bigg) N_{TC}(\textbf{x},t)-\sum_i\alpha_i C_i (\textbf{x},t^*) e^{-\beta_it} N_{TC}(\textbf{x},t), \; \text{[1]} $$
where θ is the carrying capacity per voxel, Ci(x,t*) is the drug concentration, and αi and βi are efficacy and decay rates, respectively. Diffusion is mechanically coupled to the tissue (Eq. 2) and is subject to mechanical equilibrium (Eq. 3):
$$ D(\textbf{x},t)=D_0 e^{-\gamma \sigma_{vm}(\textbf{x},t)} \; \text{[2]} $$
$$ \nabla \cdot G \nabla \vec{u}+\nabla \frac{G}{1-2 \nu}(\nabla \cdot \vec{u})-\lambda \nabla N_{TC}(\textbf{x},t)=0 \; \text{[3]} $$
The βi were set to literature-derived values, and D0, k(x), and αi were calibrated using the V1 and V2 NTC(x,t) data via the Levenberg-Marquardt algorithm. Tissue segmentation maps defined the modeling domain geometry, the model was initialized with V1 NTC(x,t) maps, and the drug concentration was calculated from DCE-MRI signal intensity. The calibrated model was run forward in time to make patient-specific predictions of tumor status at V3 (Fig. 1).
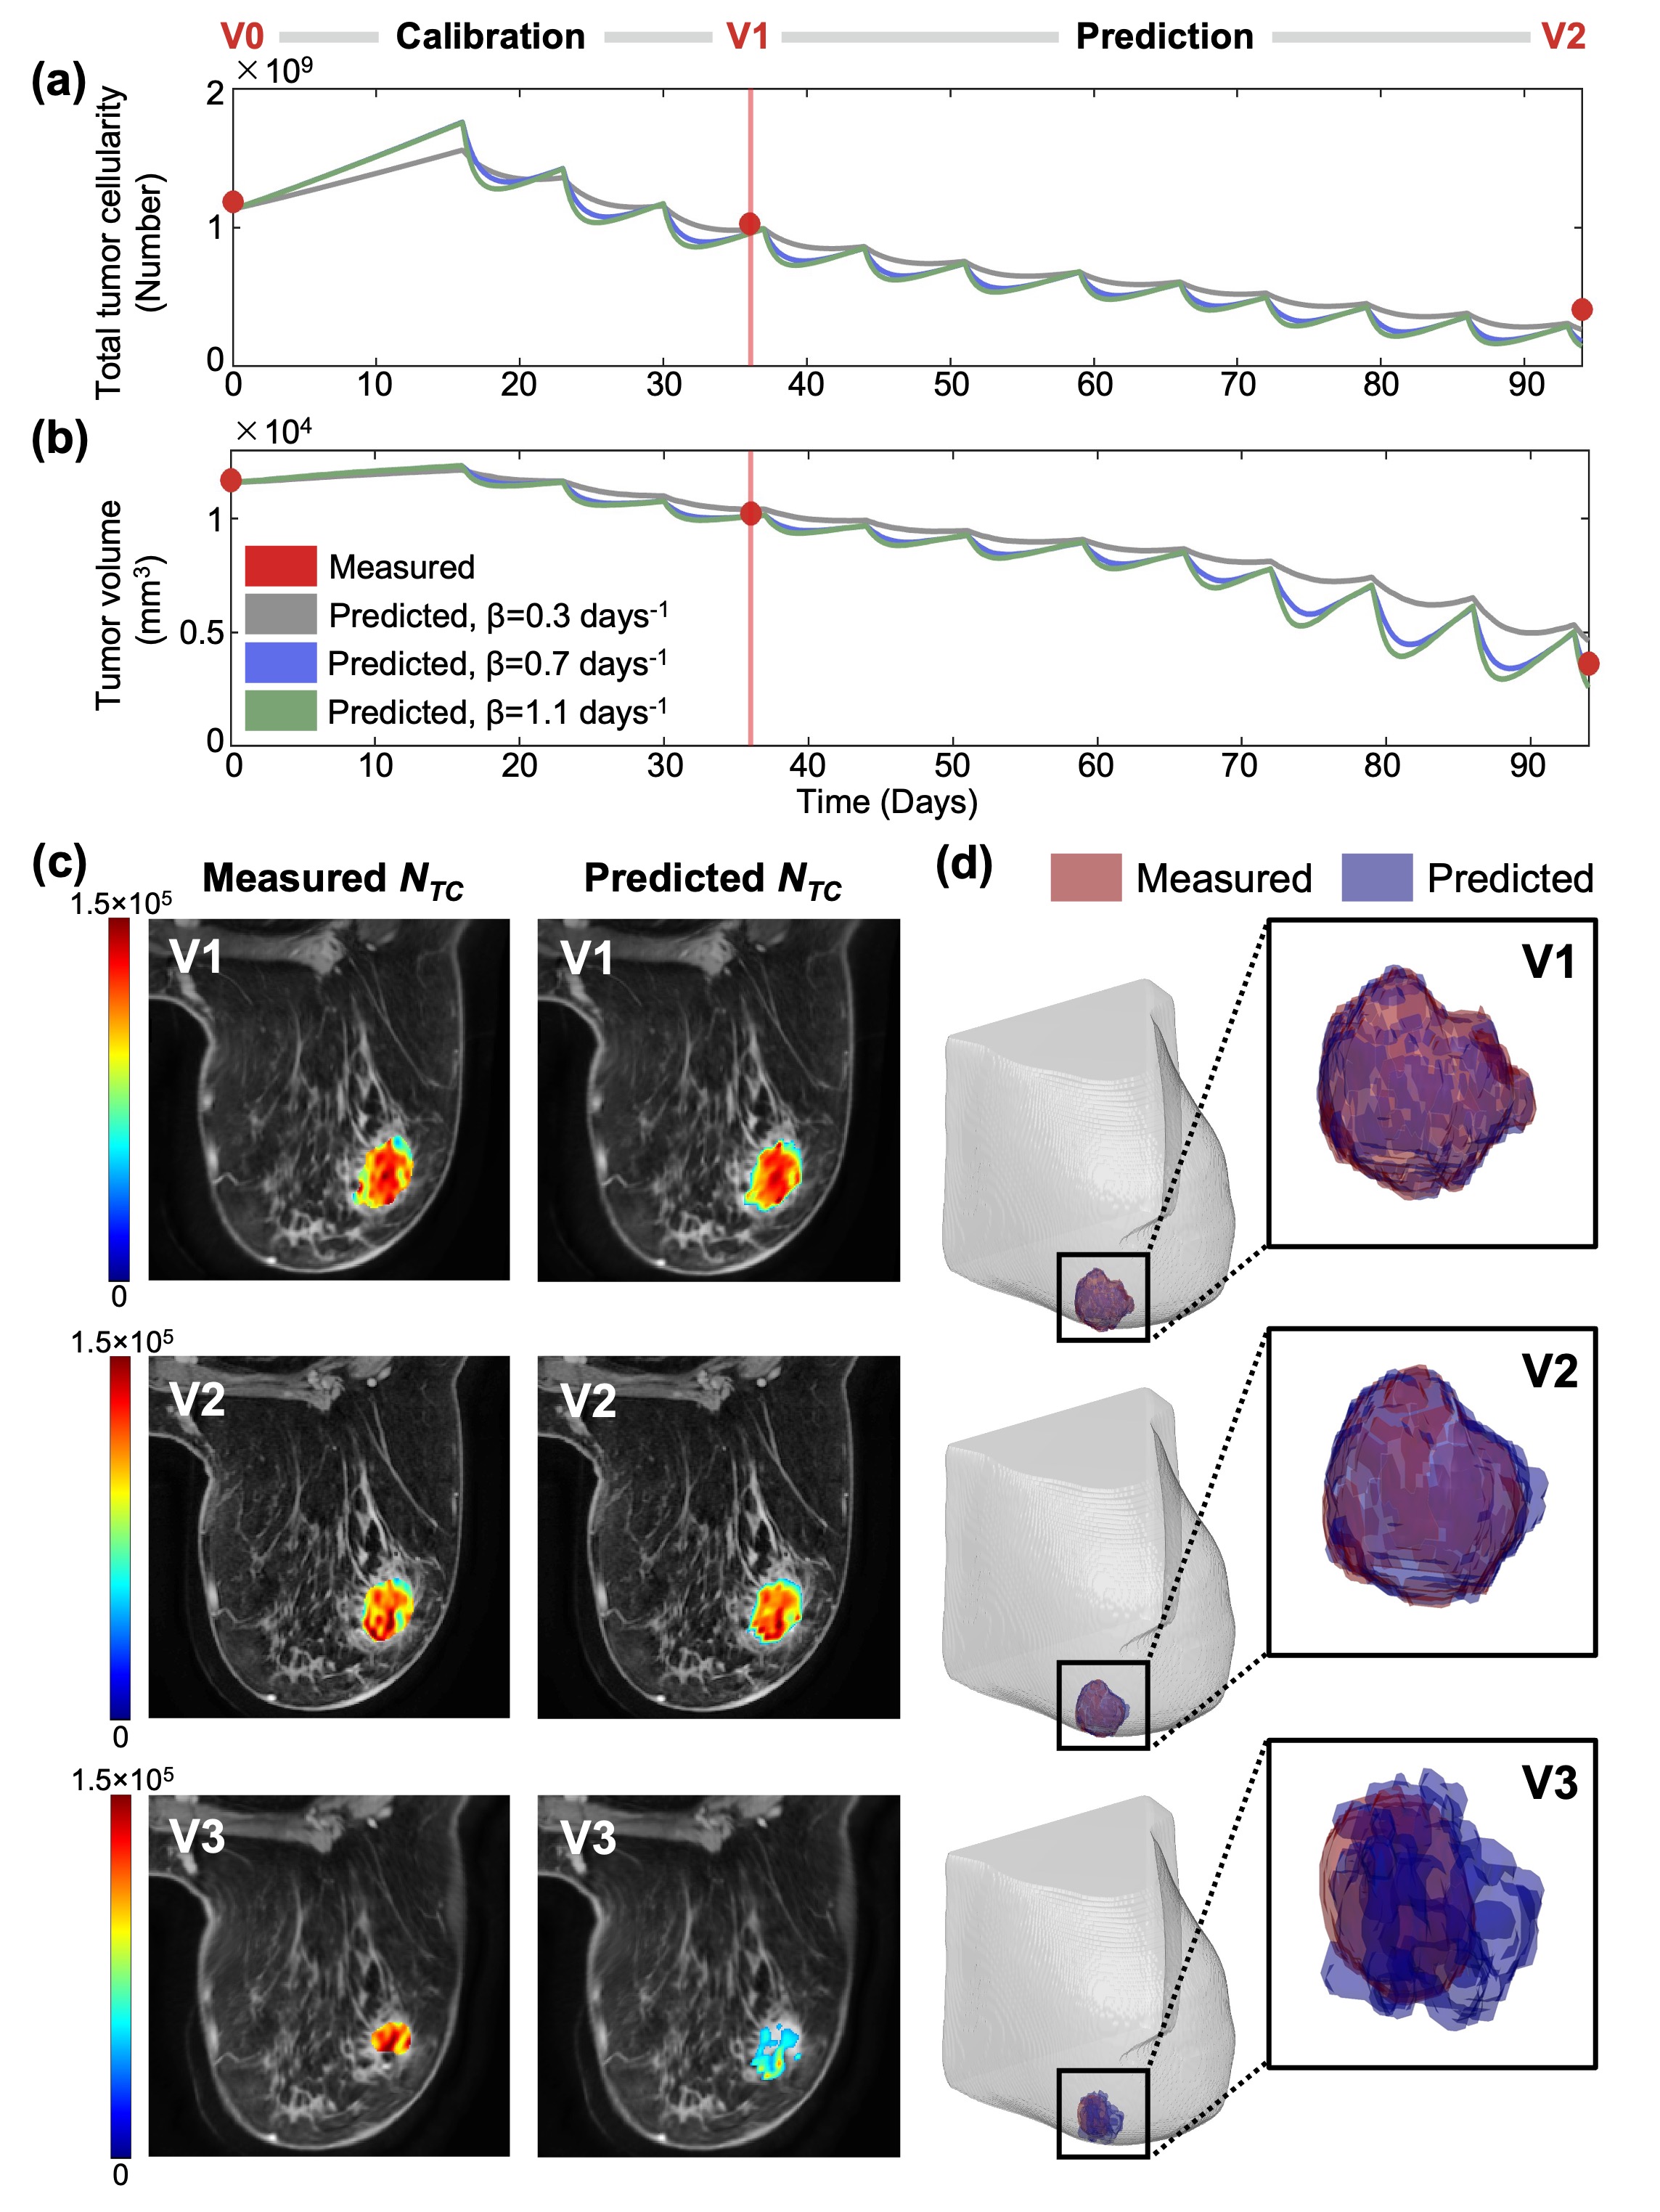
Analyses. For each patient in our initial subset of 52 patients, we compared the total tumor cellularity (Fig. 3a) and volume (Fig. 3b) time courses predicted by the model to the measured values. To evaluate local prediction accuracy, we visualized the measured and predicted cellularity maps (Fig. 3c) and 3D volumes (Fig. 3d). We used the concordance correlation coefficient (CCC) to quantify the degree of agreement between the measured and predicted data, globally. In particular, we calculated the CCC for the change from V1 to V3 in total tumor cellularity and volume between the measured ground truth data and the predicted data from our tumor forecasting pipeline.
Results
The total cellularity and volume predictions were accurate; the CCC between the measured and predicted change from V1 to V3 was 0.91 for total tumor cellularity (Fig. 4a) and 0.88 for tumor volume (Fig. 4b). However, we observed discrepancies between the measured and predicted local results. In general, as demonstrated in Fig. 3, the predicted tumor at V3 had a larger volume (Fig. 3d) but lower voxel-wise cellularity (Fig. 3c) than the measured V3 tumor.Discussion and Conclusion
Although preliminary, our results demonstrate the promise of our approach in predicting tumor status for patients with various breast cancer subtypes and drug regimens using standard-of-care MRI data acquired at multiple sites. Future directions include completing image processing, calibration, and prediction for the remaining 42 patients in our dataset. While the model predicted total tumor cellularity and volume changes accurately, future work is needed to improve local predictions for the study population.Acknowledgements
This work was supported by funding from NCI U01CA142565, U01CA174706, and U24CA226110, as well as CPRIT RR16005 and the Joint Center for Computational Oncology (Oden Institute for Computational Engineering and Sciences, MD Anderson Cancer Center, Texas Advanced Computing Center). This material is based upon work supported by the National Science Foundation Graduate Research Fellowship under Grant No. DE2137420.References
[1]. Papadimitriou K, Ardavanis A, Kountourakis P. Neoadjuvant therapy for locally advanced breast cancer: Focus on chemotherapy and biological targeted treatments' armamentarium. J Thorac Dis. 2010;2(3):160-70. doi: 10.3978/j.issn.2072-1439.2010.02.03.8. PubMed PMID: 22263038; PMCID: PMC3256458.
[2]. Liu SV, Melstrom L, Yao K, Russell CA, Sener SF. Neoadjuvant therapy for breast cancer. J Surg Oncol. 2010;101(4):283-91. doi: 10.1002/jso.21446. PubMed PMID: 20187061.
[3]. Shien T, Iwata H. Adjuvant and neoadjuvant therapy for breast cancer. Jpn J Clin Oncol. 2020;50(3):225-9. doi: 10.1093/jjco/hyz213. PubMed PMID: 32147701.
[4]. Wu C, Jarrett AM, Zhou Z, Elshafeey N, Adrada BE, Candelaria RP, Mohamed RMM, Boge M, Huo L, White JB, Tripathy D, Valero V, Litton JK, Yam C, Son JB, Ma J, Rauch GM, Yankeelov TE. MRI-Based Digital Models Forecast Patient-Specific Treatment Responses to Neoadjuvant Chemotherapy in Triple-Negative Breast Cancer. Cancer Res. 2022 Sep 16;82(18):3394-3404. doi: 10.1158/0008-5472.CAN-22-1329. PMID: 35914239; PMCID: PMC9481712.
[5]. Jarrett AM, Kazerouni AS, Wu C, Virostko J, Sorace AG, DiCarlo JC, Hormuth DA 2nd, Ekrut DA, Patt D, Goodgame B, Avery S, Yankeelov TE. Quantitative magnetic resonance imaging and tumor forecasting of breast cancer patients in the community setting. Nat Protoc. 2021 Nov;16(11):5309-5338. doi: 10.1038/s41596-021-00617-y. Epub 2021 Sep 22. PMID: 34552262; PMCID: PMC9753909.
[6]. Barker AD, Sigman CC, Kelloff GJ, Hylton NM, Berry DA, Esserman LJ. I-SPY 2: an adaptive breast cancer trial design in the setting of neoadjuvant chemotherapy. Clin Pharmacol Ther. 2009;86(1):97-100. Epub 20090513. doi: 10.1038/clpt.2009.68. PubMed PMID: 19440188.
[7]. Hormuth DA, Eldridge SL, Weis JA, Miga MI, Yankeelov TE. Mechanically Coupled Reaction-Diffusion Model to Predict Glioma Growth: Methodological Details. Methods Mol Biol. 2018;1711:225-41. doi: 10.1007/978-1-4939-7493-1_11. PubMed PMID: 29344892; PMCID: PMC6530463.
Figures