1167
Technical Considerations for Implementing Multi-Center and Multi-Platform Quantitative DCE-MRI to Predict Breast Cancer Therapy Response1Oregon Health & Science University, Portland, OR, United States, 2University of Washington, Seattle, WA, United States, 3University of Iowa, Iowa City, IA, United States
Synopsis
Keywords: Treatment Response, Quantitative Imaging, Multi-Center and Multi-Vendor Platform, DCE-MRI, Breast Cancer, Therapy Response, Ktrans
Motivation: Determine best-practice quantitative DCE-MRI for predicting breast cancer (BC) response to neoadjuvant chemotherapy (NAC) in a multi-center (MC) and multi-vendor platform (MP) setting.
Goal(s): Evaluate effects of different pharmacokinetic analysis approaches on Ktrans and its predictive performance.
Approach: 15 BC patients treated with NAC underwent longitudinal DCE-MRI at 3 sites using 3T systems from 3 vendors. Variations in analysis included Tofts model vs. Shutter-Speed model (SSM), ROI- vs. voxel-based analysis, and using fixed vs. measured R10.
Results: Different analysis approaches resulted in significantly different Ktrans, with SSM Ktrans from voxel-based analysis using fixed R10 showing highest predictive accuracy for response.
Impact: Voxel-based SSM analysis using fixed R10 takes advantage of greater range of SSM Ktrans changes in response to therapy, mitigates R10 measurement errors, and may be the best-practice quantitative DCE-MRI for predicting NAC response in a MC and MP setting.
Introduction
Extensive research from mostly single-site studies1 has demonstrated the promise of Ktrans, a quantitative measure of perfusion/permeability that can be derived from pharmacokinetic (PK) modeling of DCE-MRI data, as an imaging biomarker for predicting breast cancer (BC) response to neoadjuvant chemotherapy (NAC). However, many technical aspects in DCE-MRI data acquisition and analysis can affect Ktrans accuracy and precision.2-4 Therefore, it is important to standardize quantitative DCE-MRI in trials involving multi-centers (MCs) and multi-vendor platforms (MPs).3-5 In this preliminary MC and MP study, we sought to investigate the effects of different DCE-MRI analysis approaches on estimated breast tumor Ktrans and its predictive performance for BC response to NAC, and make initial best-practice recommendations on implementing quantitative DCE-MRI in a MC and MP setting to predict NAC response.Methods
Fifteen BC patients treated with NAC underwent serial DCE-MRI exams at 3 sites using a 3T Siemens, Philips, or GE system: pre-NAC [visit 1 (V1)], after the first NAC cycle (V2), at NAC midpoint (V3), and after NAC completion but before surgery (V4). High spatiotemporal resolution 3D bilateral axial DCE-MRI (FA = 10o, minimal TE, 3-6 ms TR, 0.7-1.1 mm in-plane resolution and 1.0-1.5 mm slice thickness, and 12-16 s temporal resolution) was performed using similar vendor sequences employing k-space undersampling and view-sharing strategy: TWIST6 (Siemens), 4D-TRAK7 (Philips), and DISCO8 (GE). B1 maps and variable FA9 (VFA, 3o, 9o, and 15o) data were acquired immediately before DCE-MRI for B1-corrected quantification of pre-contrast R1, R10. QA/QC scans of a breast phantom with ground-truth R1 values were performed regularly across the sites.All patient and QA/QC data and segmented tumor ROIs were submitted to one site for centralized analysis. The Tofts model (TM)10 and Shutter-Speed model (SSM)11,12 were used with a population-averaged AIF from breast DCE-MRI13 for PK analysis of the DCE data. Additional variations in ROI- vs. voxel-based analysis and use of fixed, literature-reported R1014,15 (fR10 = 0.60 s-1) vs. VFA-measured R10 (mR10) were also included in data analysis. Multi-slice tumor ROIs were concatenated to form a 3D ROI for ROI-based analysis of modeling one single, averaged DCE time-course. For voxel-based (within ROIs) analysis, the tumor PK parameter value was calculated by averaging voxel values.
Results
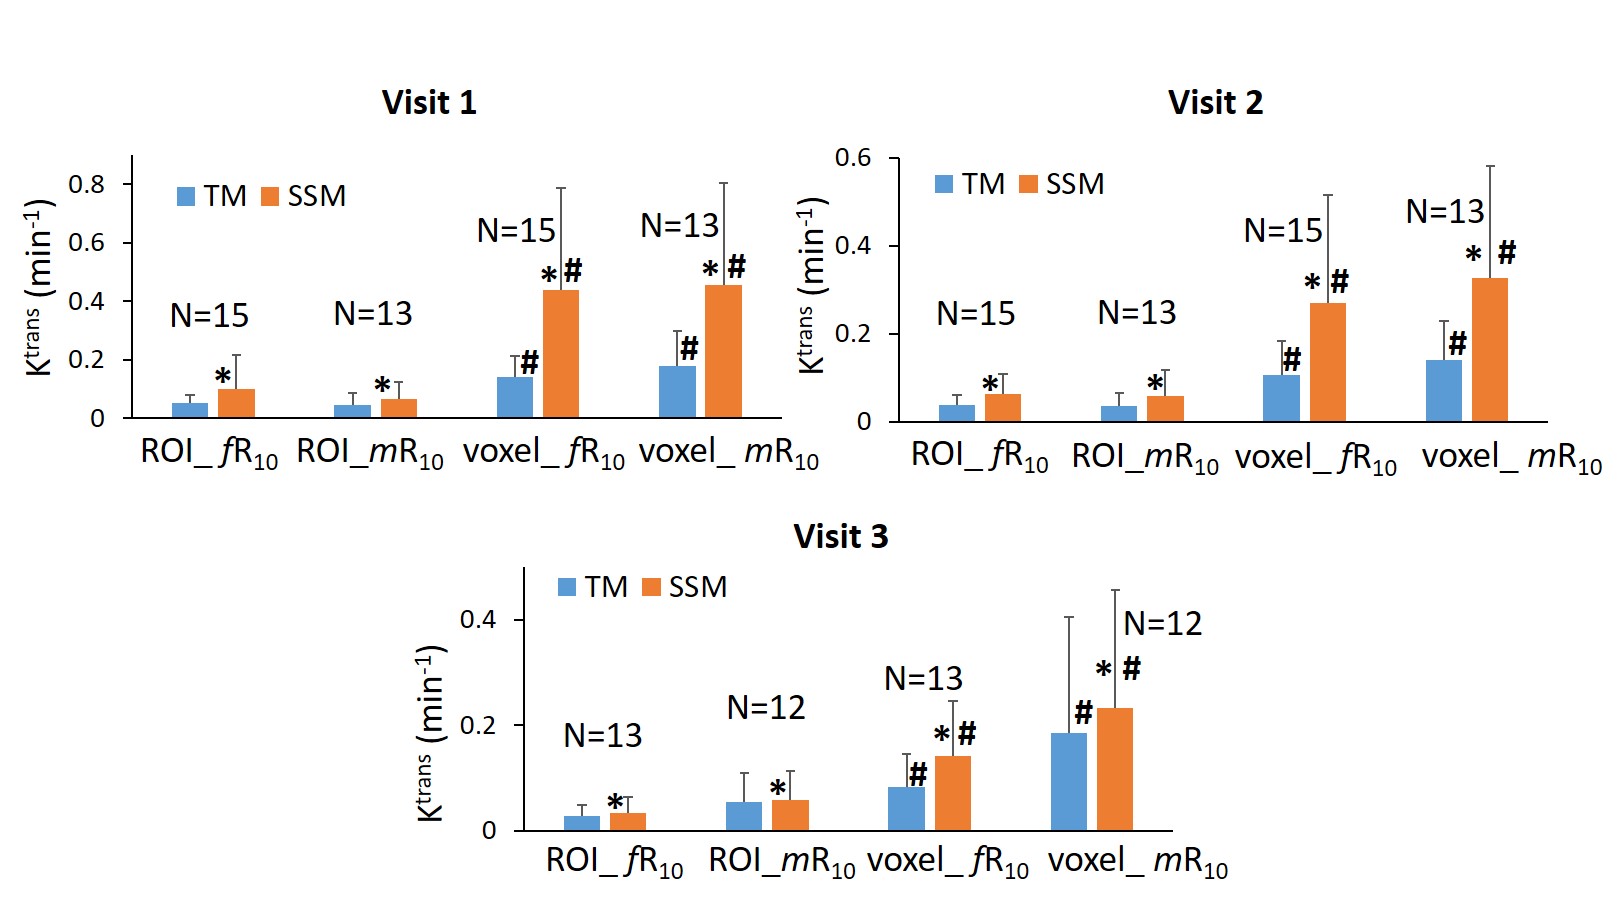
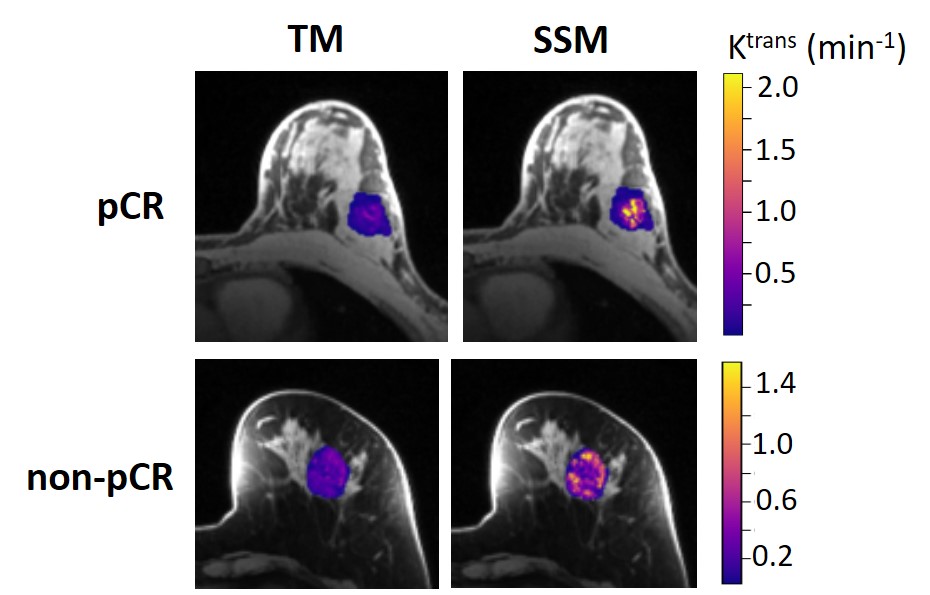
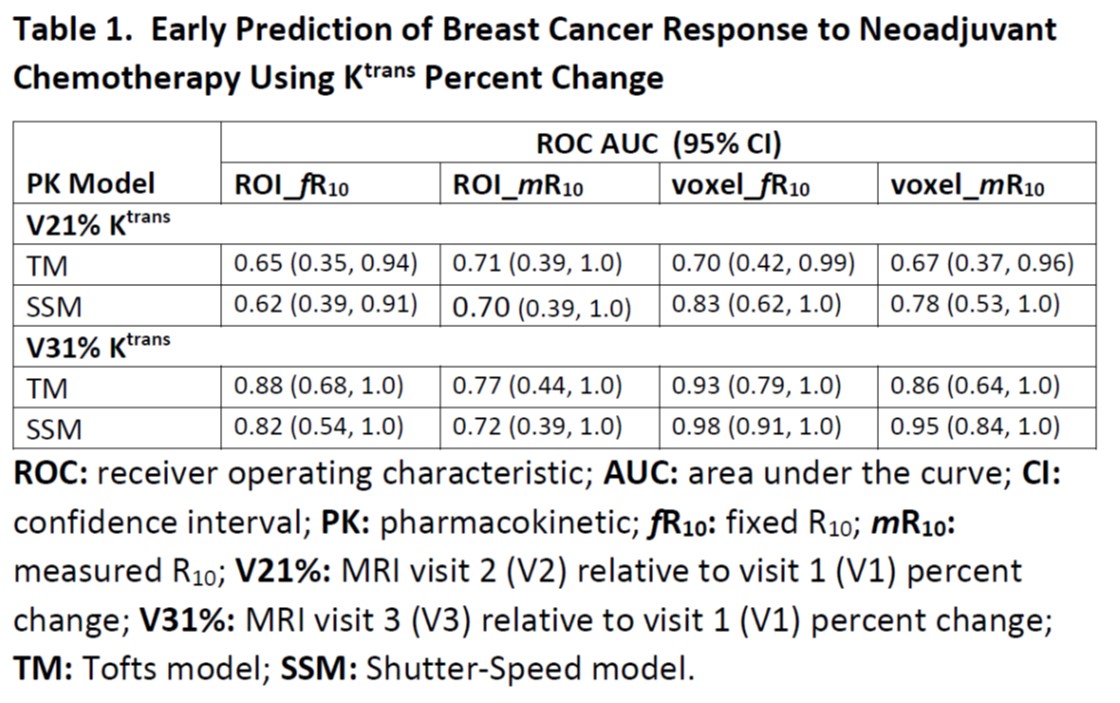
Results of tumor Ktrans from V1 to V3 (2 patients missed V3 scans) for early prediction of response are reported here. Figure 1 shows column graphs of TM and SSM mean ± SD Ktrans of the patient cohort under analysis conditions of ROI-based (ROI_ fR10 and ROI_mR10) and voxel-based (voxel_ fR10 and voxel_ mR10) using fR10 and mR10, respectively. Because of > 80% overestimation of phantom R1 (error under investigation) and consequent failure in PK modeling of patient data using mR10 on one platform, data from that platform (2 patients) were not included under the mR10 condition. SSM Ktrans was significantly (P < 0.05) larger than TM Ktrans under any condition while Ktrans from voxel-based analysis was significantly (P < 0.05) larger than that from ROI-based analysis. Figure 2 shows V1 Ktrans parametric maps from TM and SSM analysis for a pathologic complete response (pCR) and non-pCR tumor.Table 1 lists the ROC AUC values of Ktrans percent changes, V21% (V2 relative to V1) and V31%, for early prediction of pCR (N = 6) vs. non-pCR (N = 9). SSM Ktrans from voxel-based analysis exhibited better predictive performance than TM Ktrans, with SSM Ktrans under the condition of voxel_ fR10 showing the highest predictive accuracies at both V2 and V3.
Discussion and Conclusion
Consistent with previous findings,4,13 SSM Ktrans was greater than TM Ktrans in this BC cohort when DCE-MRI acquisition was sensitive to water exchange effect.16 Since there is no significant difference between SSM and TM Ktrans in benign breast lesions or normal tissue,13,17 SSM Ktrans has the advantage of greater dynamic range of changes in response to therapy and thus potentially better predictive performance. Compared to voxel-based analysis, ROI-based analysis dilutes not only tumor heterogeneity in perfusion/permeability, resulting in significantly lower Ktrans; but also water exchange effect, diminishing the advantage of SSM Ktrans in prediction of response. Insignificant differences in Ktrans between the use of fR10 and mR10 suggest that it is reasonable and practical to use fR10 for PK modeling,18 which can mitigate random errors from R10 measurement and eliminate the need for B1 mapping and VFA acquisition in MC and MP trials. Overall, voxel-based SSM analysis using fR10 may be the best practice for quantitative DCE-MRI prediction of BC response to NAC in a MC and MP setting. This preliminary finding warrants validation with a larger sample size.Acknowledgements
NIH grant R01 CA248192References
1. Huang W. Quantitative DCE-MRI of the Breast. Chapter 22, pp 425-458. In: Pinker K, Mann R, Partridge S eds. Breast MRI – State of the Art and Future Directions. Elsevier Academic Press, London UK, 2022.
2. Khalifa F, Soliman A, El-Baz A, et al. Models and methods for analyzing DCE-MRI: a review. Med Phys 2014;41:124301.
3. Huang W, Chen Y, Fedorov A, Li X, Jajamovich GH, Malyarenko DI, et al. The impact of arterial input function determination variations on prostate dynamic contrast-enhanced magnetic resonance imaging pharmacokinetic modeling: a multicenter data analysis challenge. Tomography 2016;2:56-66.
4. Huang W, Li X, Chen Y, Li X, Chang MC, Oborski MJ, et al. Variations of dynamic contrast-enhanced magnetic resonance imaging in evaluation of breast cancer therapy response: a multicenter data analysis challenge. Transl Oncol 2014;7:153-166.
5. Shukla-Dave A, Obuchowski NA, Chenevert TL, Jambawalikar S, Schwartz LH, Malyarenko D, et al. Quantitative Imaging Biomarkers Alliance (QIBA) recommendations for improved precision of DWI and DCE-MRI derived biomarkers in multicenter oncology trials. J Magn Reson Imaging 2019: 49:e101-e121 doi: 10.1002/jmri.26518.
6. Song T, Laine AF, Chen Q, Rusinek H, Bokacheva L, Lim RP, et al. Optimal k-space sampling for dynamic contrast-enhanced MRI with an application to MR renography. Magn Reson Med 2009;61:1242-1248.
7. Willinek WA, Hadizadeh DR, von Falkenhausen M, Urbach H, Hoogeveen R, Schild HH, Gieseke J. 4D time-resolved MR angiography with keyhole (4D-TRAK): more than 60 times accelerated MRA using a combination of CENTRA, keyhole, and SENSE at 3.0T. J Magn Reson Imaging 2008;27:1455-1460.
8. Saranathan M, Rettmann DW, Hargreaves BA, Clarke SE, Vasanawala SS. Differential subsampling with Cartesian ordering (DISCO): a high spatio-temporal resolution Dixon imaging sequence for multiphasic contrast enhanced abdominal imaging. J Magn Reson Imaging. 2012;35:1484–1492.
9. Deoni SCL, Peters TM, Rutt BK. Determination of optimal angles for variable nutation proton magnetic spin-lattice, T1, and spin-spin, T2, relaxation times measurement. Magn Reson Med 2004;51:194-199.
10. Tofts PS, Brix G, Buckley DL, Evelhoch JL, Henderson E, Knopp MV, et al. Estimating kinetic parameters from dynamic contrast-enhanced T1-weighted MRI of a diffusable tracer: standardized quantities and symbols. J Magn Reson Imaging 1999;10:223-232.
11. Yankeelov TE, Rooney WD, Li X, Springer CS. Variation of the relaxographic “Shutter-Speed” for transcytolemmal water exchange affects the CR bolus-tracking curve shape. Magn Reson Med 2003;50:1151-1169.
12. Li X, Rooney WD, Springer CS. A unified pharmacokinetic theory for intravascular and extracellular contrast agents. Magn Reson Med 2005;54:1351-1359. [Erratum. Magn Reson Med 2006;55:1217.]
13. Huang W, Tudorica LA, Li X, Thakur SB, Chen Y, Morris EA, et al. Discrimination of benign and malignant breast lesions by using shutter-speed dynamic contrast-enhanced MR imaging. Radiology 2011;261:394-403.
14. Pineda FD, Medved M, Fan X, Karczmar GS. B1 and T1 mapping of the breast with a reference tissue method. Magn Reson Med 2016;75:1565-1573.
15. Rakow-Penner R, Daniel B, Yu H, Sawyer-Glover A, Glover GH. Relaxation times of breast tissue at 1.5T and 3T measured using IDEAL. J Magn Reson Imaging 2006;23:87-91.
16. Li X, Huang W, Rooney WD. Signal-to-Noise Ratio, Contrast-to-Noise Ratio, and pharmacokinetic modeling considerations in Dynamic-Contrast-Enhanced Magnetic Resonance Imaging. Magn Reson Imaging 2012;30:1313-1322.
17. Huang W, Li X, Morris EA, Tudorica LA, Seshan VE, Rooney WD, et al. The MR Shutter-Speed discriminates vascular properties of malignant and benign breast tumors in vivo. Proc Natl Acad Sci 2008; 105: 17943-17948.
18. Huang W, Wang Y, Panicek DM, Schwartz LH, Koutcher JA. Feasibility of using limited-population-based average R10 for pharmacokinetic modeling of osteosarcoma dynamic contrast-enhanced MRI data. Magn Reson Imaging 2009; 27: 852-858.
Figures