1166
Multi-parametric MRI for Response Assessment in Soft-Tissue Sarcoma; Post-Treatment EF and ADC Correlate with Viable Tumour Percentage1Department of Radiotherapy and Imaging, The Institute of Cancer Research, London, United Kingdom, 2MRI Unit, The Royal Marsden NHS Foundation Trust, London, United Kingdom, 3Division of Molecular Pathology, The Institute of Cancer Research, London, United Kingdom, 4Sarcoma Unit, The Royal Marsden NHS Foundation Trust, London, United Kingdom, 5Department of Radiology, Pamela Youde Nethersole Eastern Hospital, Hong Kong, Hong Kong, 6Department of Surgery, The Royal Marsden NHS Foundation Trust, London, United Kingdom
Synopsis
Keywords: Treatment Response, Cancer, Multi-parametric, Response, Quantitative
Motivation: New biomarkers are needed for response assessment of soft-tissue sarcoma (STS) that reflect underlying biology.
Goal(s): To (i) describe changes in six quantitative MRI biomarkers following radiotherapy treatment, (ii) assess correlation between changes in these markers, and (iii) evaluate correlation of post-treatment values with viable tumour percentage (VTP) after resection.
Approach: We evaluate the Pearson correlation between changes in all six biomarkers in a cohort of 23 patients treated with pre-operative radiotherapy for limb sarcoma.
Results: Large correlations are observed in changes of T2, ADC, fractional-anisotropy, fat-fraction and magnetization-transfer-ratio. Post-treatment values of tumour enhancement and ADC reflect VTP.
Impact: Multiparametric quantitative MR protocols capture heterogeneous changes in soft-tissue sarcomas following treatment. Changes in derived quantitative biomarkers following treatment are correlated, and post-treatment values may reflect viable tumour percentage determined through histopathology.
Introduction
Soft-Tissue Sarcomas (STS) are rare heterogeneous tumours that develop in the connective tissues. Existing methods for evaluating treatment response, such as size-based criteria (RECIST 1.1), lack accurate correlation with histopathological response, highlighting the need for novel imaging biomarkers that can better represent the underlying biological characteristics of tumours1,2,3. Multiparametric, quantitative MRI (qMRI) offers estimation of multiple biomarkers in a single exam. Investigating the relationships between these qMRI metrics, how they change throughout treatment and their links to histopathological measures will further help our understanding of the biological changes occurring after treatment.We present our multi-parametric MR protocol for extremity STS that measures six qMRI biomarkers: apparent diffusion coefficient (ADC), fraction anisotropy (FA), transverse relaxation time (T2), Gd contrast enhancement fraction (EF), fat fraction (FF), and magnetization transfer ratio (MTR). The aim of this study was to evaluate how these biomarkers change following pre-operative radiotherapy (RT), investigate the correlations between their changes, and identify their association with clinical viable tumour percentage (VTP) measured from resected samples.
Methods
Our multi-parametric MR protocol includes co-registered diffusion-tensor imaging, magnetization-transfer imaging, multi-echo echo-planar imaging, Dixon imaging and contrast-enhanced imaging. Twenty-three patients with limb STS were scanned before and after pre-operative radiotherapy as part of a prospective clinical trial, using a single 1.5T scanner (MAGNETOM Aera, Siemens Healthcare, Erlangen, Germany). Regions of Interest (ROI) were drawn around the tumour volume on the low-b-value (50 s/mm2) trace-weighted scan4, and resampled5 to the same resolution for each imaging type.Volume-averaged biomarkers were calculated for all six parameters (ADC, FA, MTR, FF, EF, T2) at both time-points (EF could not be evaluated for four patients due to a change in clinical contrast-enhanced-imaging; T2 could not be determined in one patient due to a technical error). Mean post-treatment changes were evaluated for each biomarker (denoted 𝛿) and the Pearson correlation coefficient, r, between changes was evaluated for all parameter pairs.
Twenty-one patients underwent surgery to excise the tumour following completion of radiotherapy; histopathological viable tumour percentage (VTP) was reported for fifteen patients as part of standard of care.
Results
Ladder plots are shown in Figure 1 for all biomarkers before and after radiotherapy.Correlation heatmaps are shown for changes in all pairs of biomarkers in Figure 2. Strong negative correlations were seen between (𝛿MTR, 𝛿T2) [r= -0.81, p=4e-6] and (𝛿ADC, 𝛿FA) [r=-0.75, p=3e-5] (latter result previously reported by us for a smaller population sample6). Strong positive correlations were seen between (𝛿FA, 𝛿MTR) [r= 0.77, p=2e-5] and (𝛿FA, 𝛿FF) [r=0.73, p=7e-5], whilst a moderate negative correlation was seen between (𝛿MTR, 𝛿ADC) [r=-0.58, p=4e-3] (exemplar scatter plots illustrated in Figure 3).
A strong positive correlation was observed between post-treatment EF and VTP [r=0.77, p=2e-3], whilst a moderate negative correlation was observed between post-treatment ADC and VTP [r=-0.52,p=4e-2] (Figure 4). No significant correlations were observed for the other parameters.
Discussion
STS typically demonstrate heterogeneous response patterns, which are reflected in the diverse changes seen in qMRI biomarkers for different patients and highlights the importance of multiparametric protocols that capture different imaging information. The strong negative correlations between changes in (𝛿MTR, 𝛿T2) and (𝛿ADC, 𝛿FA) and the strong positive correlations between changes in (𝛿FA, 𝛿MTR) and (𝛿FA, 𝛿FF) may arise because of structural changes in the tumour such as changes in water and fat content, fibrosis, altered water-protein interactions and necrosis, however histological validation is required. An inverse correlation between MTR and T2 values has been previously reported7,8. Further work that includes a region-based analysis of these metrics and histological validations of these markers may help to understand the relationships between these metrics and the underlying biological changes.EF measurements have been linked to tumour vascularisation and perfusion9. ADC measurements are linked to cellularity10. The strong positive correlation (post-EF, VTP) and moderate negative correlation between (post-ADC, VTP) provides support to the underlying biological mechanics for both metrics and encourages further investigation for EF and ADC as potential response markers. However, there are clear outliers in the ADC data which require further exploration.
Conclusion
Quantitative multiparametric MR protocols capture the inter-tumour heterogeneity seen in STS. Changes in some qMRI metrics including MTR, T2, ADC and FA correlate and ADC and EF post-treatment values correlate with VTP. Future work is necessary to further understand these findings on a region-based approach that fully characterizes the intra-tumoral heterogeneity, and further histopathological analysis is required to understand the biological links underlying quantitative MRI.Acknowledgements
This project represents independent research funded by the National Institute for Health and Care Research (NIHR) Biomedical Research Centre at The Royal Marsden NHS Foundation Trust and The Institute of Cancer Research, London, and by the Royal Marsden Cancer Charity. We also acknowledge The David and Ruth Lewis Family Trust and Sarcoma UK. The views expressed are those of the author(s) and not necessarily those of the NIHR or the Department of Health and Social Care.
References
1. Canter R, Martinez S, Tamurian R, et al. Radiographic and histologic response to neoadjuvant radiotherapy in patients with soft tissue sarcoma. Ann Surg Oncol. 2010;17:2578-2584.
2. Roberge D, Skamene T, Nahal A, et al. Radiological and pathological response following pre-operative radiotherapy for soft tissue sarcoma. Radiother Oncol. 2010;97:404-407.
3. Messiou C, Bonvalot S, Gronchi A, et al. Evaluation of response after pre-operative radiotherapy in soft tissue sarcomas; The European Organisation for Research and Treatment of Cancer - Soft Tissue and Bone Sarcoma Group (EORTC - STBSG) and Imaging Group recommendations for radiological examination and reporting with an emphasis on magnetic resonance imaging. Eur J Cancer. 2016;56:37-44.
4. Horosproject.org
5. R. Beare, B. C. Lowekamp, Z. Yaniv, “Image Segmentation, Registration and Characterization in R with SimpleITK”, J Stat Softw, 86(8), 2018.
6. Thrussell I, Winfield J, Usman S et al. Soft-Tissue Sarcomas demonstrate Fractional Anisotropy in Diffusion Tensor Imaging and Fractional Anisotropy Values Change After Treatment. Proceedings International Society of Magnetic Resonance in Medicine. 2023
7. Vasudev MK, Jayakumar PN, Srikanth SG et al. Quantitative Magnetic Resonance Techniques in the Evaluation of Intracranial Tuberculomas, Acta Radiologica, 48:2, 200-206, 2007.
8. Papanikolaou N, Maniatis V, Pappas J, et al. Biexponential T2 Relaxation Time Analysis of the Brain: Correlation With Magnetization Transfer Ratio. Investigative Radiology 37(7):p 363-367, July 2002
9. Donaldson SB, Buckley DL, O'Connor JP, et al. Enhancing fraction measured using dynamic contrast-enhanced MRI predicts disease-free survival in patients with carcinoma of the cervix. Br J Cancer. 2010 Jan 5;102(1):23-6.
10. Koh DM, Collins DJ. Diffusion-Weighted MRI in the Body: Applications and Challenges in Oncology. Am J Roentgenol (2007) 188:1622–35. doi: 10.2214/AJR.06.1403
Figures
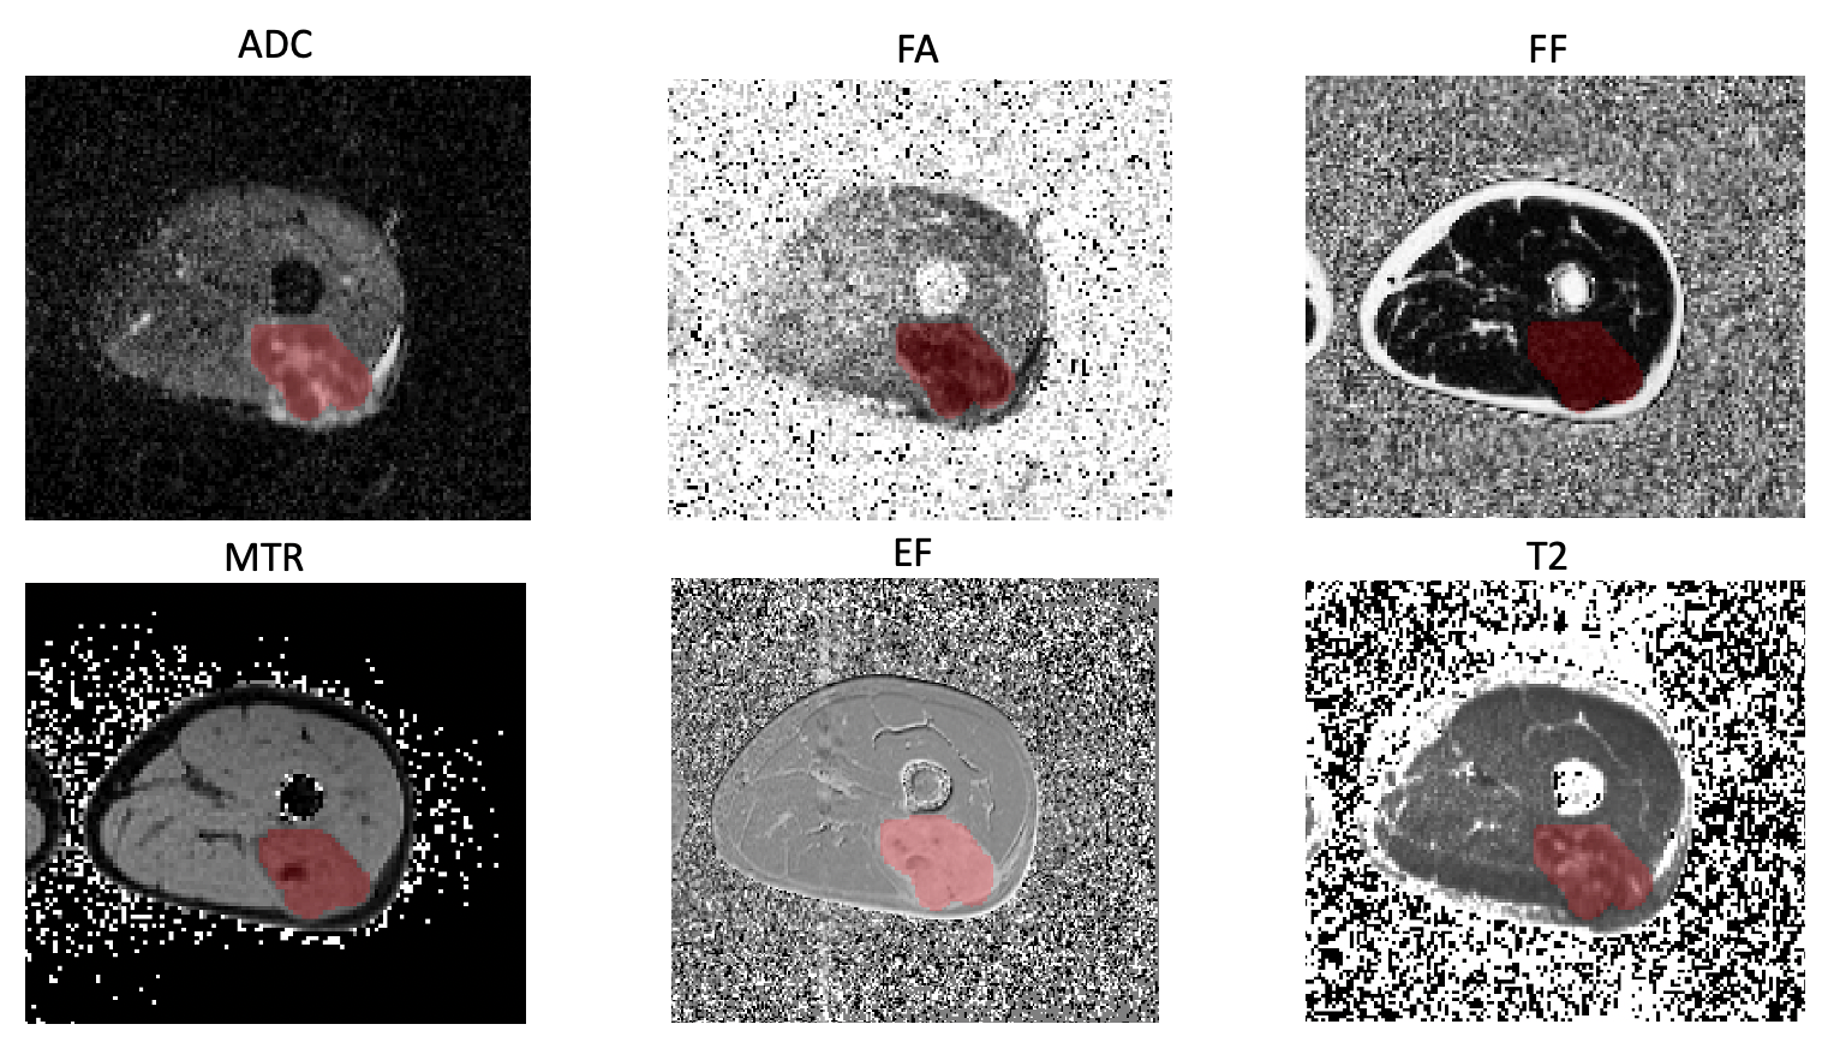
Exemplar quantitative maps for one patient including: ADC (top left), FA (top middle), FF (top right), MTR (bottom left), EF (bottom middle) and T2 (bottom right). These images highlight the heterogeneity seen within a tumour.
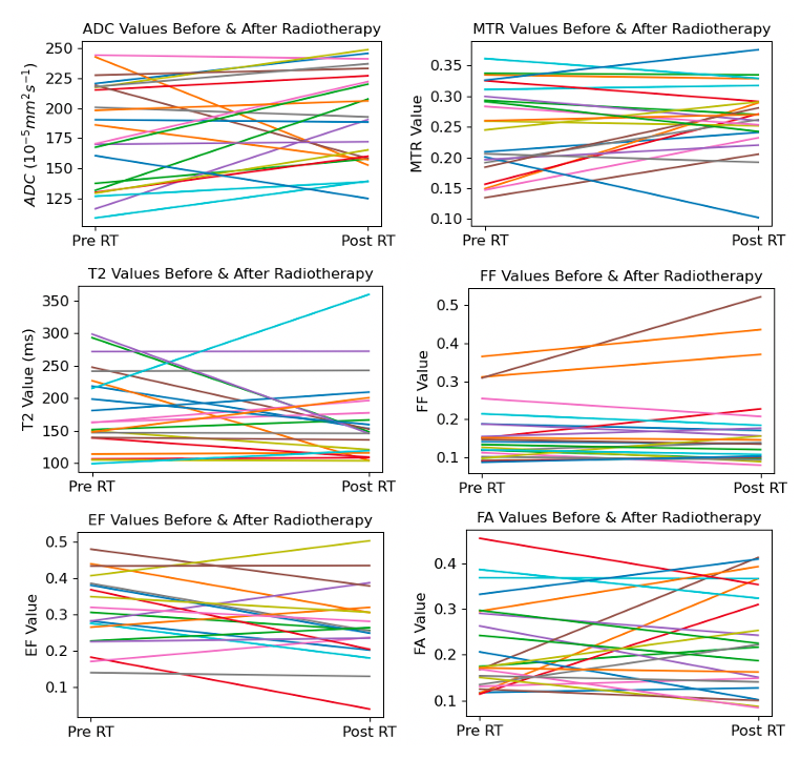
Ladder plots showing the changes for each qMRI metric for individual patients pre-treatment (preRT) [LHS] and post-treatment (postRT) [RHS]. Left column: ADC, T2, EF and right column: MTR, FF, FA. Diverse changes can be seen for the different qMRI metrics across different patients, highlighting the heterogeneous response to treatment typical of sarcomas.
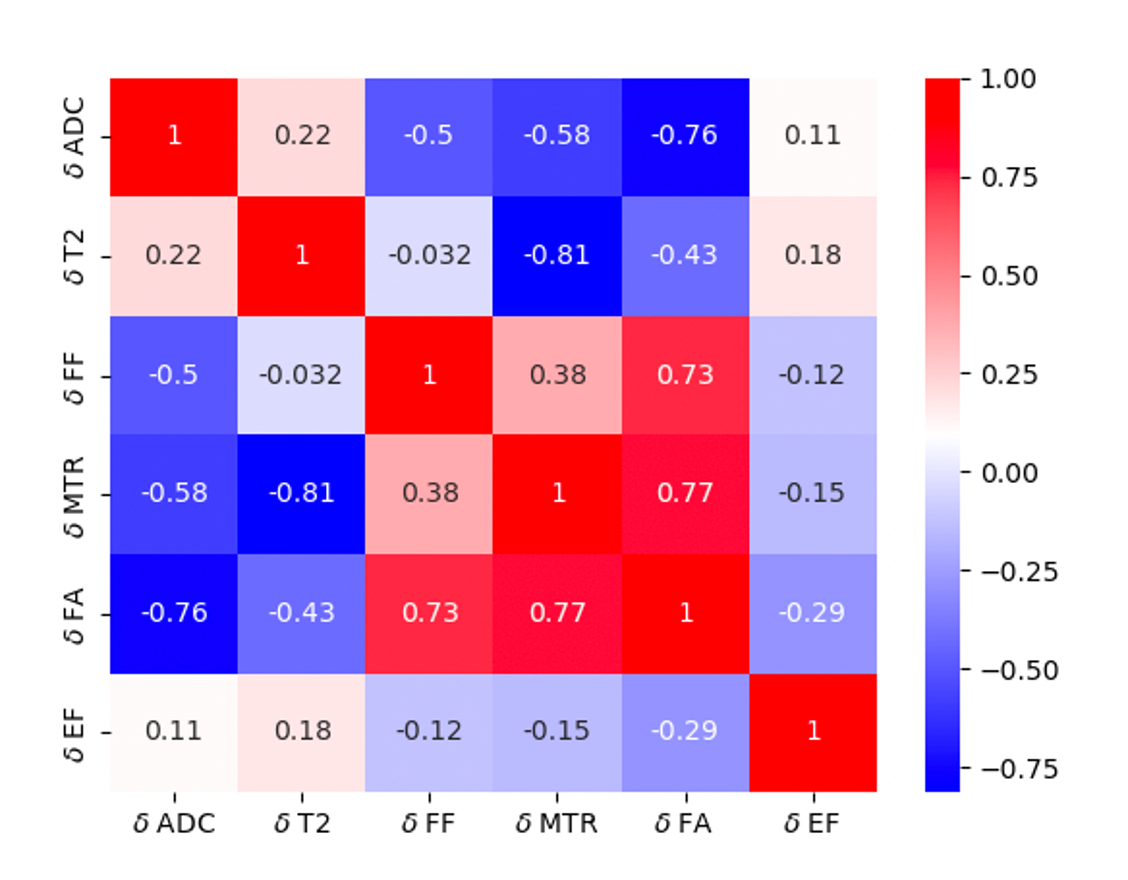
Correlation heat map showing the correlations between the changes in qMRI metrics following treatment. Red shows a positive correlation, while blue shows a negative correlation.
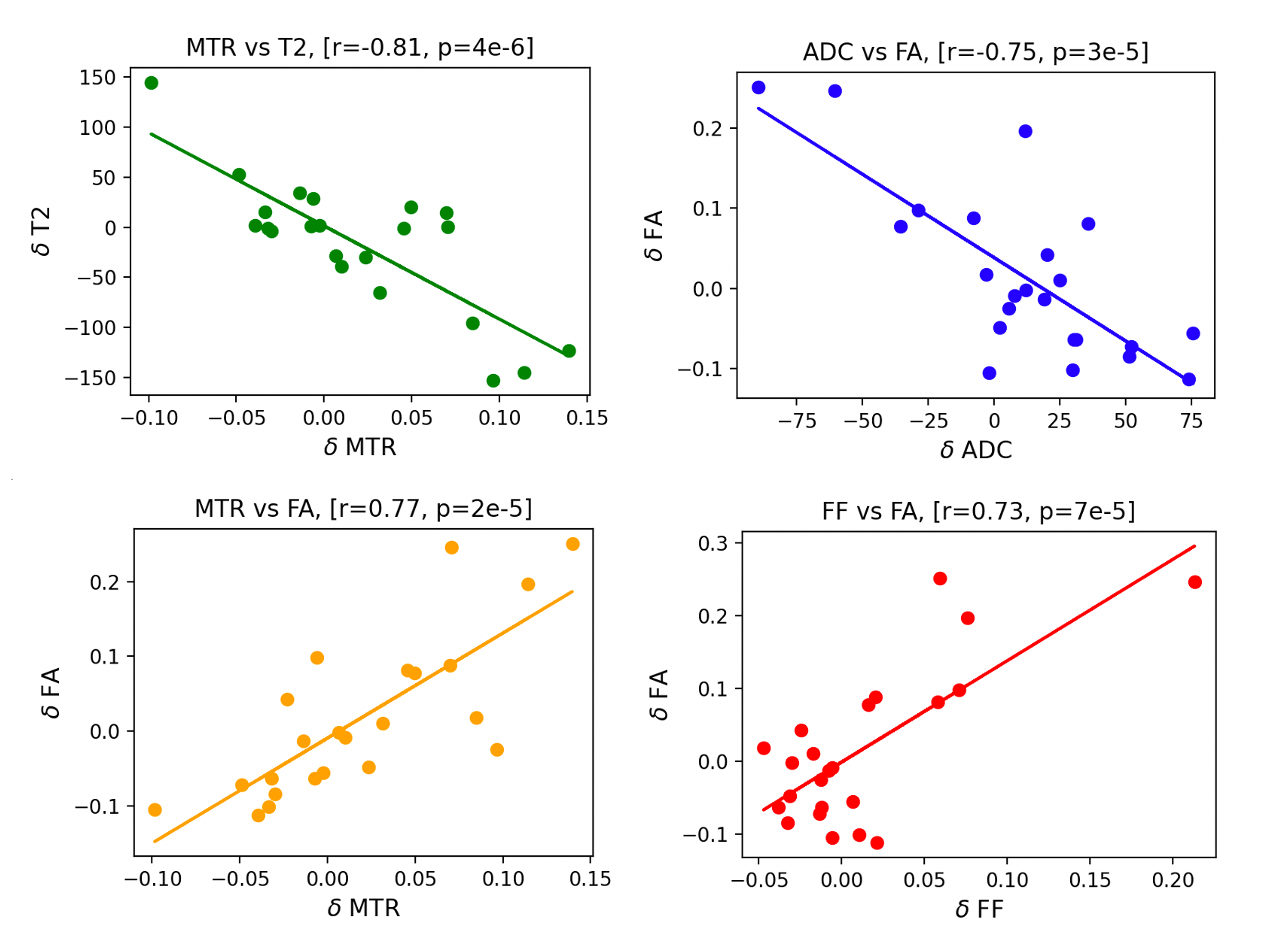
Scatter plots between qMRI metrics difference values (from pre-treatment to post-treatment) that showed strong correlation. Negative correlations are seen for (𝛿MTR, 𝛿T2) (top left) and (𝛿ADC, 𝛿FA) (top right) while positive correlations are seen for (𝛿MTR, 𝛿FA) (bottom left) and (𝛿FF, 𝛿FA) (bottom right).
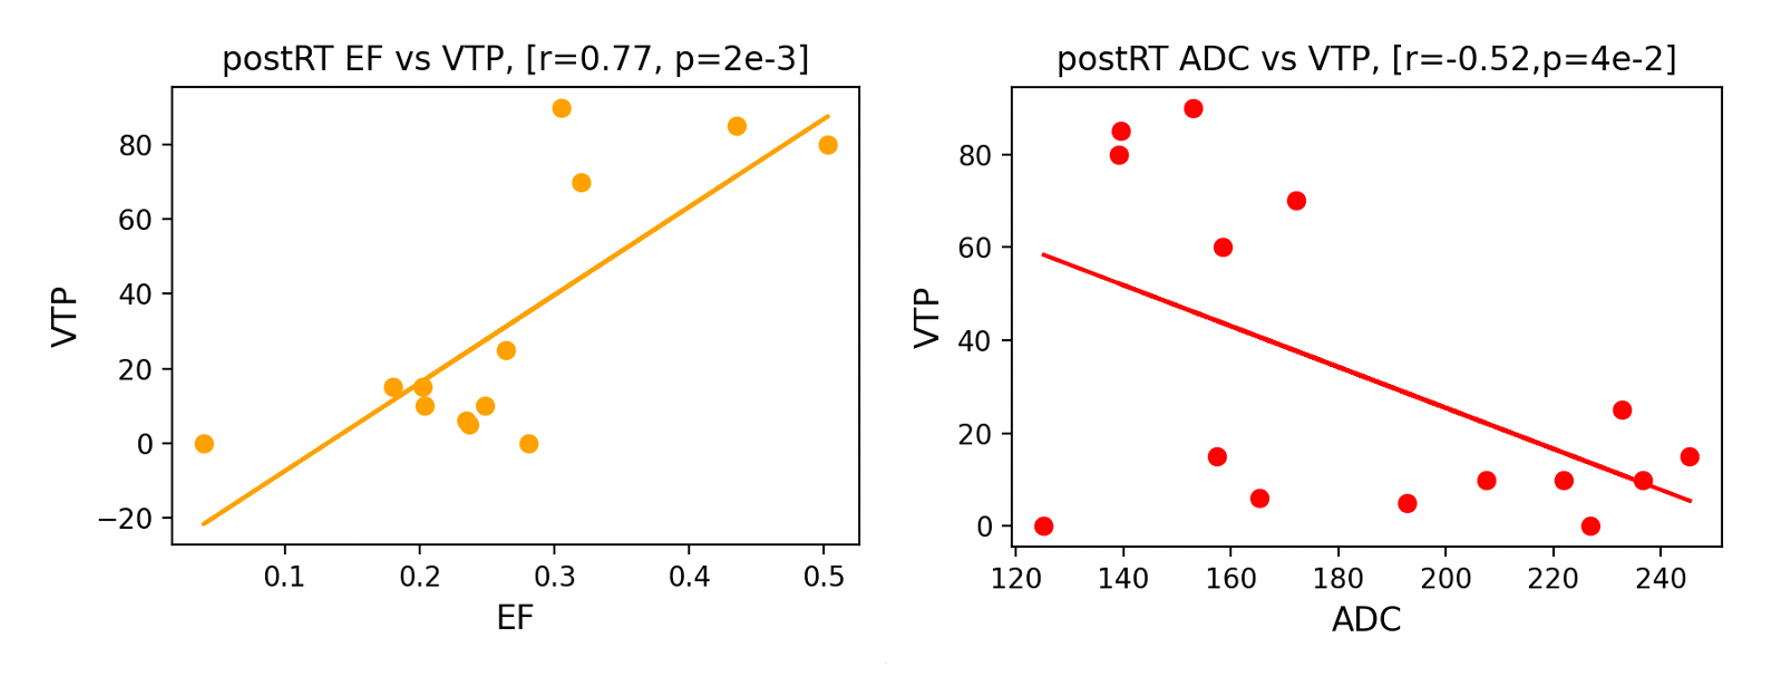
Scatter plots between the post treatment values for EF (left) and ADC (right) versus viable tumour percentage.