1164
Intra-tumor heterogeneity based on synthetic MRI in predicting Ki-67 status of nasopharyngeal carcinoma1Chongqing University Cancer Hospital, Chongqing, China, 2GE HealthCare MR Research, Beijing, China
Synopsis
Keywords: Cancer, Cancer
Motivation: The staging and prognosis of nasopharyngeal carcinoma (NPC) remain significant challenges, with potential correlations to the Ki-67 proliferation status.
Goal(s): To assess and analyze an ITH model based on pre-treatment synthetic MRI (SyMRI) for predicting Ki-67 status in patients with pathologically confirmed NPC.
Approach: Twenty-eight NPC patients who underwent pre-treatment SyMRI. SyMRI data were processed to generate T1, T2, and PD maps. The ITHscore, derived from quantitative parameter maps, was utilized to establish models for predicting Ki-67 status based on clinical data.
Results: The ITHscore, based on quantitative parameter maps, demonstrated promise as an imaging marker for predicting Ki-67 status in NPC.
Impact: The ITHscore derived from SyMRI holds potential as a non-invasive imaging marker for predicting Ki-67 status, which can have clinical implications in the management of NPC.
Introduction
Nasopharyngeal carcinoma (NPC) is a prevalent malignancy in Southeast Asia, particularly Southern China1. Ki-67 serves as a marker of tumor cell proliferation, with associations found between Ki-67 expression, NPC staging, and prognosis2,3. Synthetic MRI (SyMRI), an innovative imaging technique, provides simultaneous quantification of intrinsic tissue properties, including longitudinal and transverse relaxation times4. Recent research has established correlations between SyMRI parameters and Ki-67 expression in NPC4.Intratumor heterogeneity (ITH) arises from genetic and environmental factors, framing cancer as an intricate disease characterized by a genetically diverse subclonal architecture5. ITH influences not only biomarker expression but also intricately impacts therapeutic responses6. However, whether tissue's intrinsic characteristics can predict Ki-67 status in NPC remains unresolved. Therefore, this study aimed to investigate the potential value of SyMRI-derived ITH concerning Ki-67 status.
Materials and Methods
PatientsThis study received ethical approval, and informed consent was obtained from all participants. Twenty-eight NPC patients were prospectively recruited. Based on their Ki-67 values, the patients were categorized into two groups: high (>50%) and low (≤50%).
MRI Acquisition
All subjects underwent SyMRI using a 3T scanner (SIGNATM Premier, GE Healthcare) equipped with a 48-channel head coil. The acquisition parameters were as follows: TR, 4000 ms; TE, 16.0/89.4 ms; slice thickness/gap, 3.0/0 mm; FOV, 180 mm; acquisition matrix, 192 × 192; NEX, 1; acquisition time, 4 min 32 s.
Data Analysis
The raw images acquired were processed using SyMRI software (version 8.0, Synthetic MR) to generate T1, T2, and PD maps. Subsequently, radiologists outlined volumes of interest (VOIs) covering the entire primary tumor region on SyT2WI images employing ITK-SNAP software. The ITHscore, a freely available Python package (https://pypi.org/project/ITHscore)7, was employed to derive quantitative map values. Modeling We established three models using clinical data, ITH data, and a combination of both data types, respectively.
Statistical Analysis
All statistical analyses were conducted using SPSS 27.0 software. Continuous variables were compared using either Student's t-test or ANOVA. Categorical variables were analyzed using the chi-square test. Receiver operating characteristic curves were generated based on significant features.
Results
Clinical characteristicsThe baseline characteristics of the patients are shown in Table 1. There was no statistical significance in age (p = 0.387), gender (p = 0.711), histopathologic subtypes (p = 0.600), T stage (p = 0.212), N stage (p = 0.290), AJCC stage (p = 0.274), EBV-DNA (p = 0.662), PD_map_ITH (p = 0.294), and T2_map_ITH (p = 0.467) between Ki-67high and Ki-67low groups. T1_map_ITH was lower in the Ki-67high group than the Ki-67low one (p = 0.040). The proportion of the Ki-67high group was 53.57% (15 of 28) .
Model Evaluation
We developed the clinical model based on EBV-DNA and AJCC stage after stepwise logistic regression, ITH model based on T1_map_ITH. In identifying NPC patients with high Ki-67 level, the clinical model showed an AUC of 0.671 (95% CI, 0.500–0.837), the ITH model of 0.790 (95% CI, 0.580-0.972), and combined model of 0.825 (95% CI, 0.628-0.993) (Figure 2 and Table 2). The DeLong test showed there was no significant difference between clinical and ITH model (p = 0.391), and between ITH and combined model (p = 0.666).
Discussion and Conclusion
We have successfully developed models for predicting Ki-67 status in NPC based on the ITHscore derived from pre-treatment SyMRI in combination with clinical indicators. This non-invasive imaging indicator holds promise for predicting Ki-67 and may have significant implications for future patient management, contributing to the implementation of precision medicine.T1 map, an advanced MRI modality, enables the quantification and visualization of T1 relaxation time, and reflects the content of extracellular free water8. This study indicated that T1_map_ITH was lower in the Ki-67high group than the Ki-67low one. Perhaps due to the high expression of Ki-67 indicating higher tumor cell proliferation activity9, with less hemorrhage and necrosis in NPC, the tumor cell density is high and uniform, resulting in a lower ITHscore. But this result needs to be confirmed, and the mechanism still needs further exploration. We have introduced an innovative ITH model with strong predictive performance. Our results suggest that the ITHscore can capture valuable information regarding intra-tumor heterogeneity from MRI images and is a valuable tool for predicting Ki-67 expression in NPC.
In conclusion, this study established an ITH model and a combination model to predict the expression status of Ki-67, which is valuable in the management of NPC.
Acknowledgements
No acknowledgement found.References
1 Huang W, Zhang Q, Wu G, et al. DCE-MRI quantitative transport mapping for noninvasively detecting hypoxia inducible factor-1α, epidermal growth factor receptor overexpression, and Ki-67 in nasopharyngeal carcinoma patients. Radiother Oncol. 2021;164:146-154.
2 Zhao Y, Shen L, Huang X, et al. High expression of Ki-67 acts a poor prognosis indicator in locally advanced nasopharyngeal carcinoma. Biochem Biophys Res Commun 2017;494:390-6.
3 Zhao L, Chen H, Hu B, et al. Prognostic significance of Ki67 expression and the derived neutrophillymphocyte ratio in nasopharyngeal carcinoma. Cancer Manag Res 2018;10:1919-26.
4 Nowell PC. The clonal evolution of tumor cell populations. Science 1976;194:23–8.
5 Yang F, Li X, Li Y, et al. Histogram analysis of quantitative parameters from synthetic MRI: correlations with prognostic factors in nasopharyngeal carcinoma. Eur Radiol 2023;33(8):5344-5354.
6 Marusyk A, Janiszewska M, Polyak K. Review intratumor heterogeneity: The Rosetta stone of therapy resistance. Cancer Cell 2020;37:471–84.
7 Li J, Qiu Z, Zhang C, et al. ITHscore: comprehensive quantification of intra-tumor heterogeneity in NSCLC by multi-scale radiomic features. Eur Radiol 2023;33(2):893-903.
8 Aherne E, Chow K, Carr J. Cardiac T1 mapping: Techniques and applications. J Magn Reson Imaging 2020;51(5):1336-1356.
9 Xie Z, Suo S, Zhang W, et al. Prediction of high Ki-67 proliferation index of gastrointestinal stromal tumors based on CT at non-contrast-enhanced and different contrast-enhanced phases. Eur Radiol 2023.
Figures
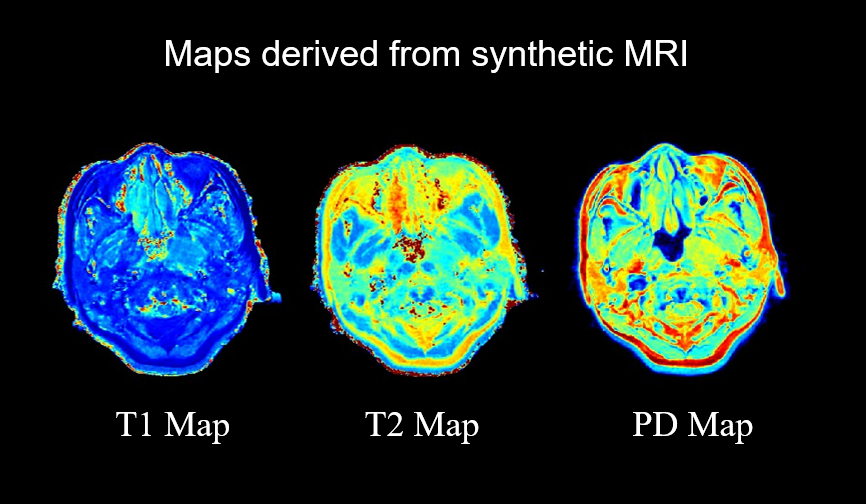
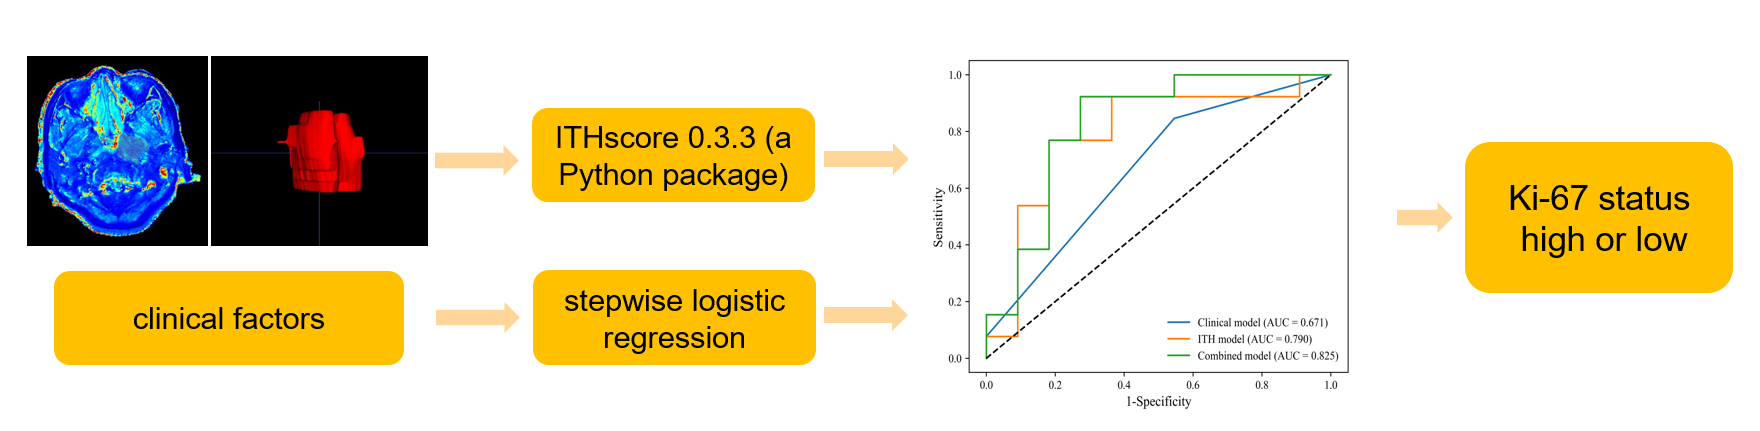
Figure 2 The workflow of building models
Note: ITH model, the model developed based on the intra-tumor heterogeneity of T1 map from synthetic MRI.
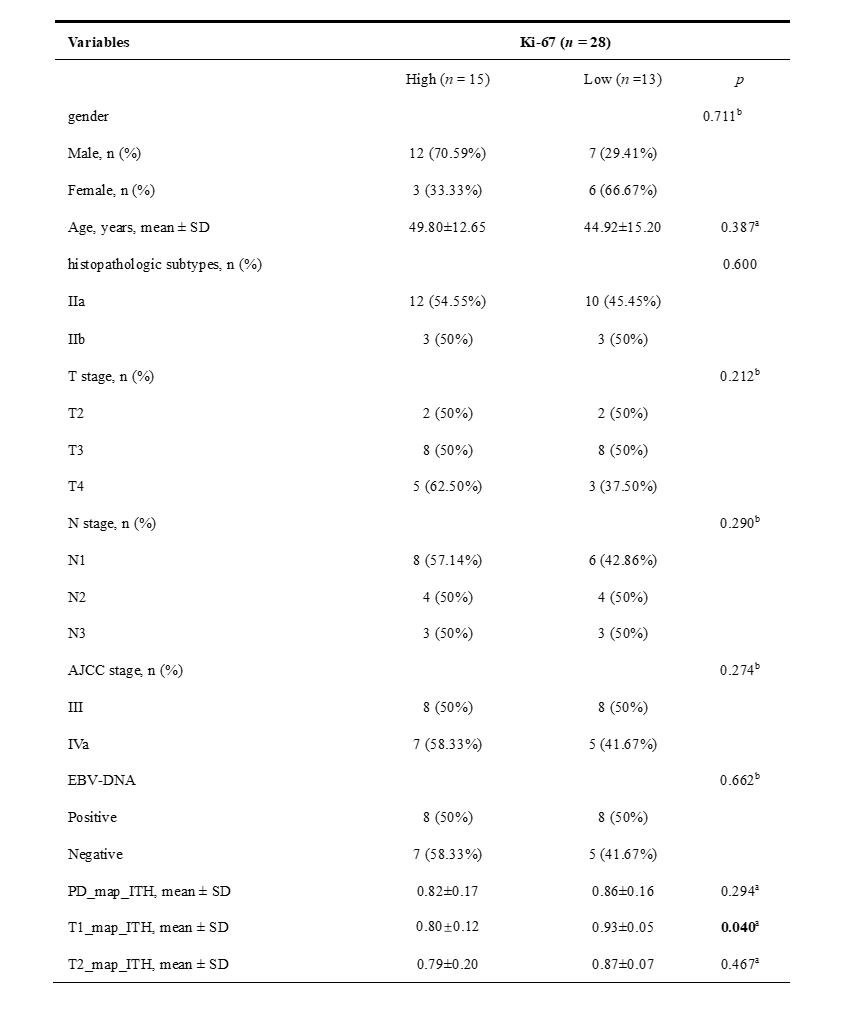
Table 1 Patients’clinical characteristics and radiological intra-tumor heterogeneity features
Note: AJCC, American Joint Committee on Cancer; PD_map_ITH, the ITHscore obtained from PD map; T1_map_ITH, the ITHscore obtained from T1 map; T2_map_ITH, the ITHscore obtained from T2 map. a, Student’s t-test; b, Chi-Squared Test

Table 2 Performance of models for predicting the Ki-67 status based on pre-treatment clinical and intra-tumor heterogeneity of T1 map
Note: ITH model, the model developed based on the intra-tumor heterogeneity of T1 map from synthetic MRI; AUC: area under curve; PPV: Positive predictive value; NPV: Negative predictive value; 95% CI: 95% bootstrap confidence interval.
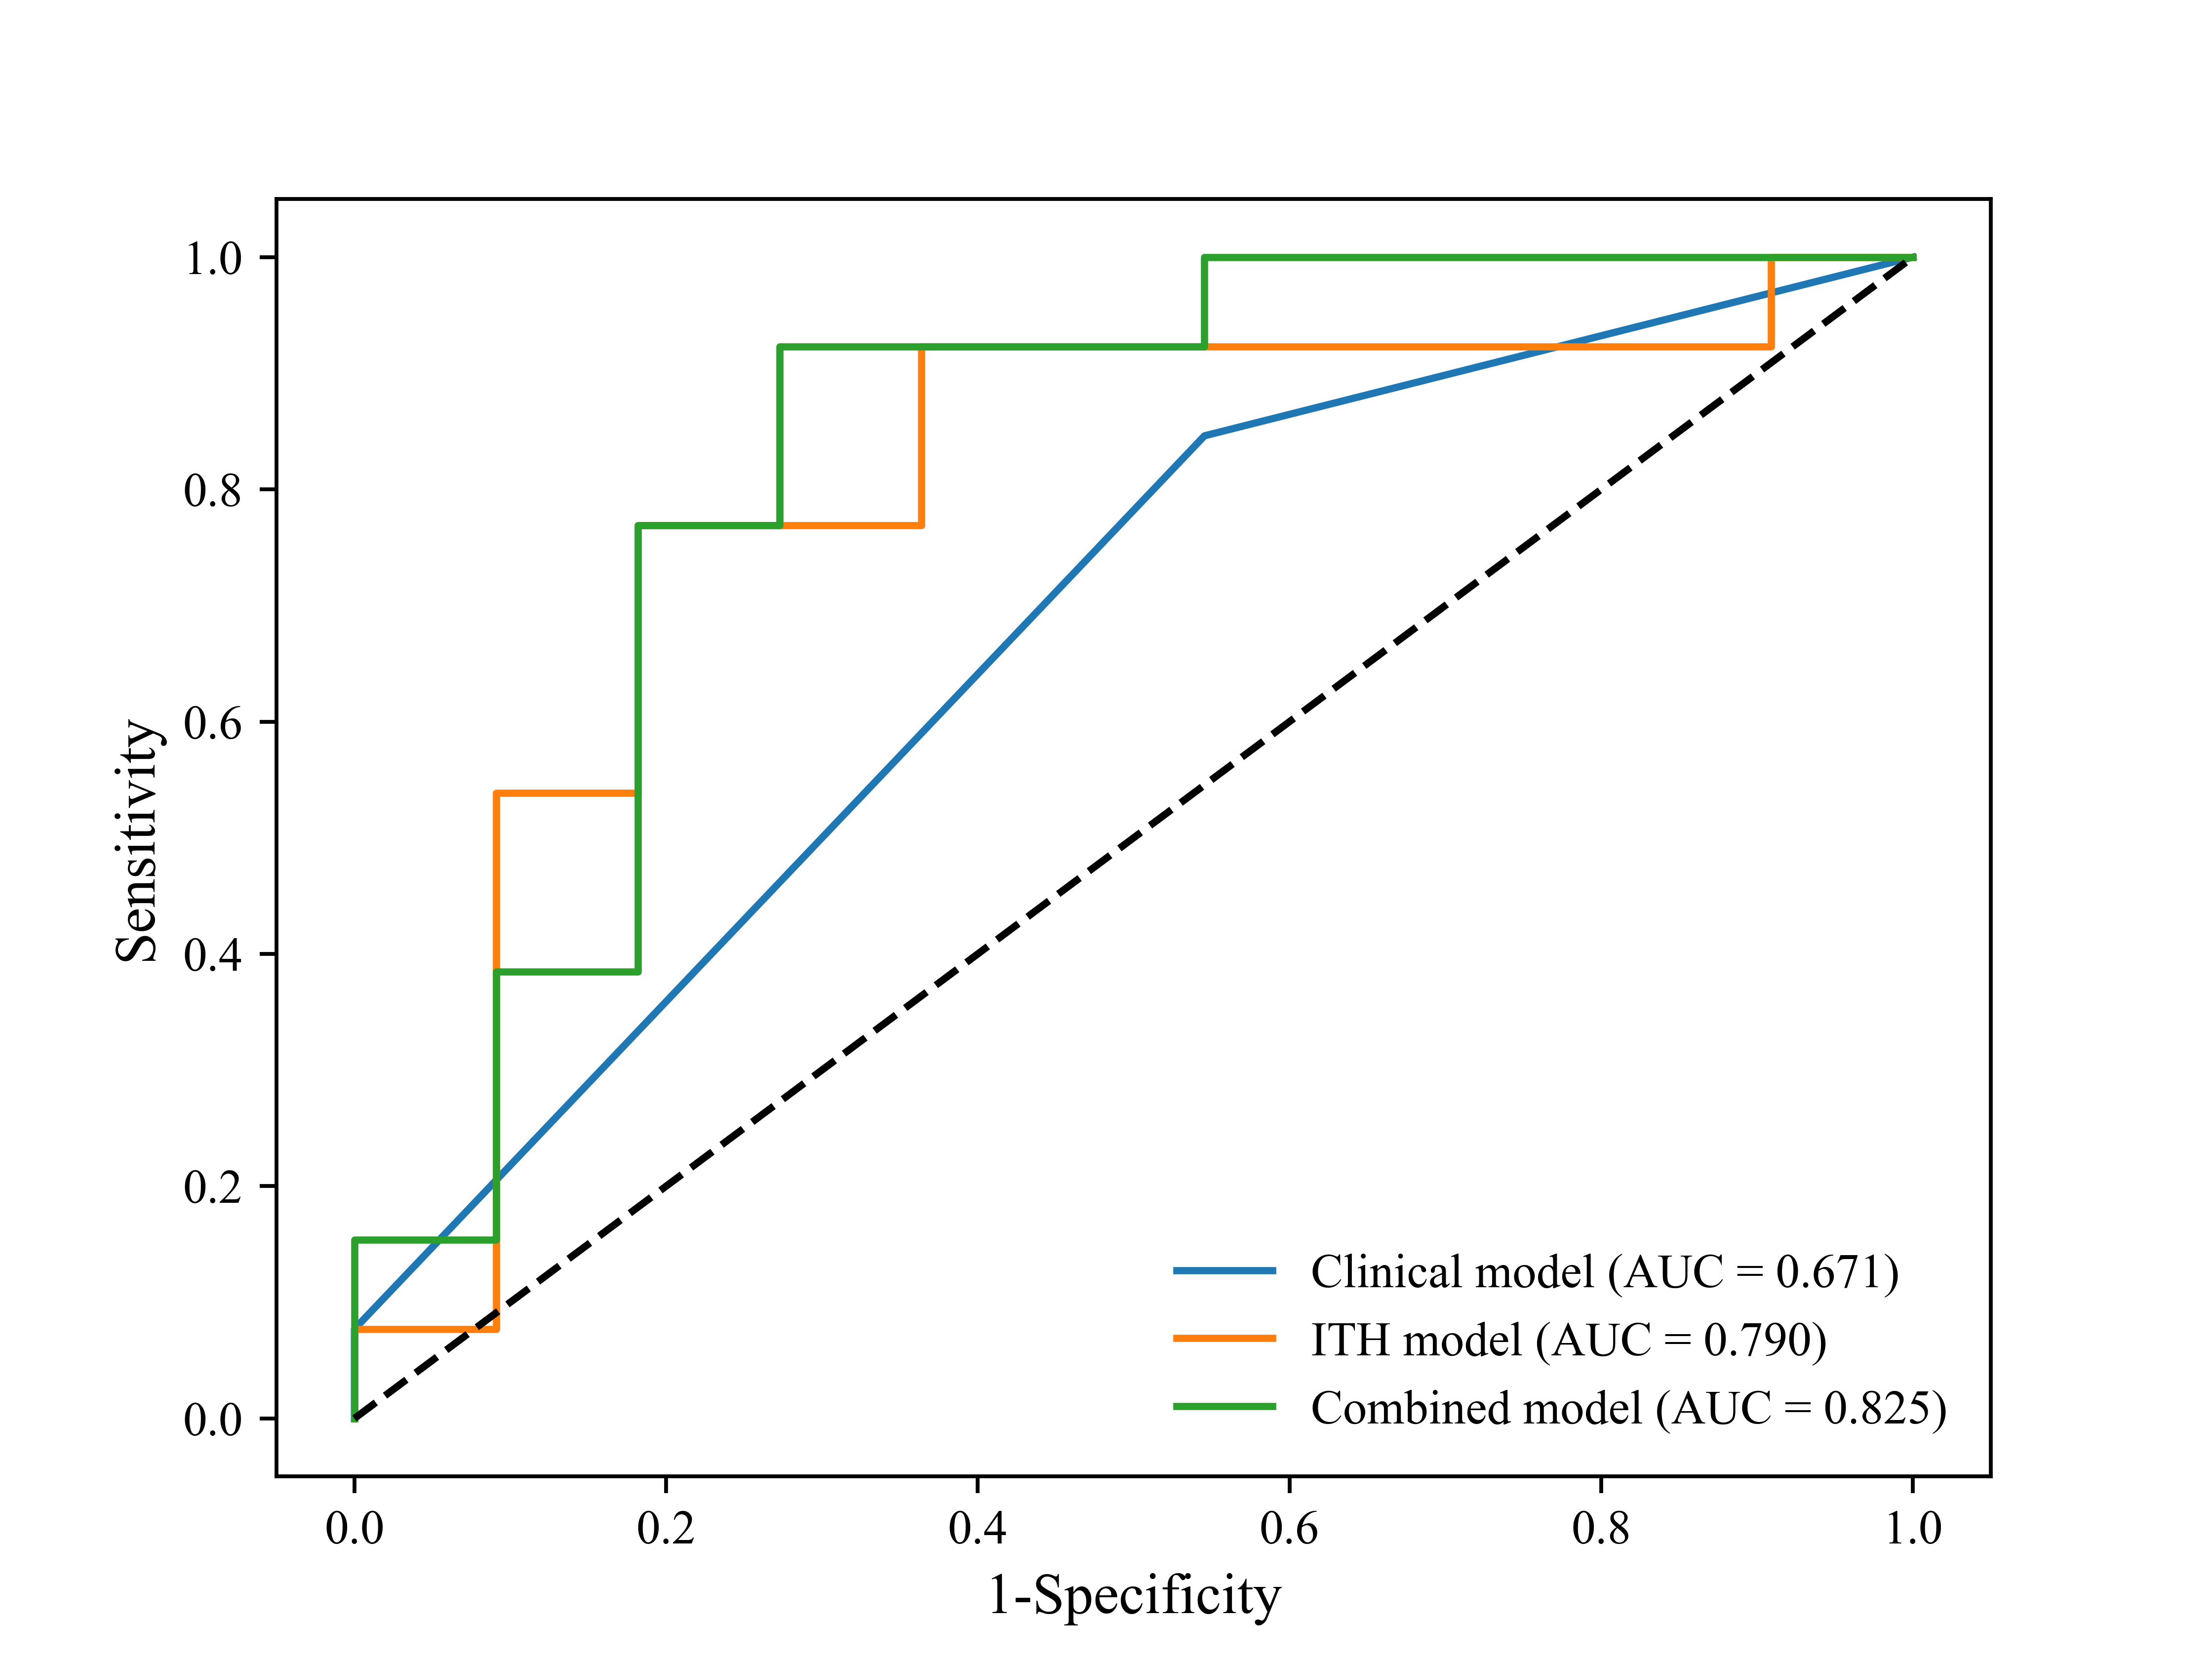
Figure 3 Performance of models for predicting the Ki-67 status based on pre-treatment clinical and intra-tumor heterogeneity of T1 map
Note: ITH model, the model developed based on the intra-tumor heterogeneity of T1 map from synthetic MRI; AUC, area under curve.