1161
The causal effect of screen uses versus reading on the brain development in early adolescents1Department of Biomedical Engineering, Zhejiang University, Hangzhou, China, 2Department of Psychology, Hangzhou Normal University, Hangzhou, China
Synopsis
Keywords: Adolescents, Adolescents, screen use, reading, brain volume, brain development
Motivation: The causal relationships between screen use and mental health were not clear.
Goal(s): We used genetic, imaging, and questionnaire data from ABCD study to investigate the causal relationships between screen use and mental health in early adolescents.
Approach: One-sample Mendelian randomization analysis.
Results: We found a direct causal relationship between screen use and behavior problems and an indirect effect between screen use and brain volume by the changes in reading habits.
Impact: These findings provide new evidence for a causal influence of screen use and reading habits on brain development and highlight the importance of monitoring media use and related habits change in children.
Introduction
The rise of new media has greatly changed our lifestyles, leading to increased time spent on new platforms and less time spent reading 1,2. Previous studies have found associations between screen use and mental health in children 3–8. However, the causal relationships between screen use and specific outcomes need further elucidation. Causal analysis has become possible with advanced statistical tools, such as the Mendelian randomization (MR) analysis 9, which uses genetic variation as a tool to infer causal relationships between two variables. Therefore, we aim to investigate the causal associations between screen use on neuroimaging, cognition, and behavior in young adolescents, and the potential displacement (or competing) effect between screen use and reading habits.Method
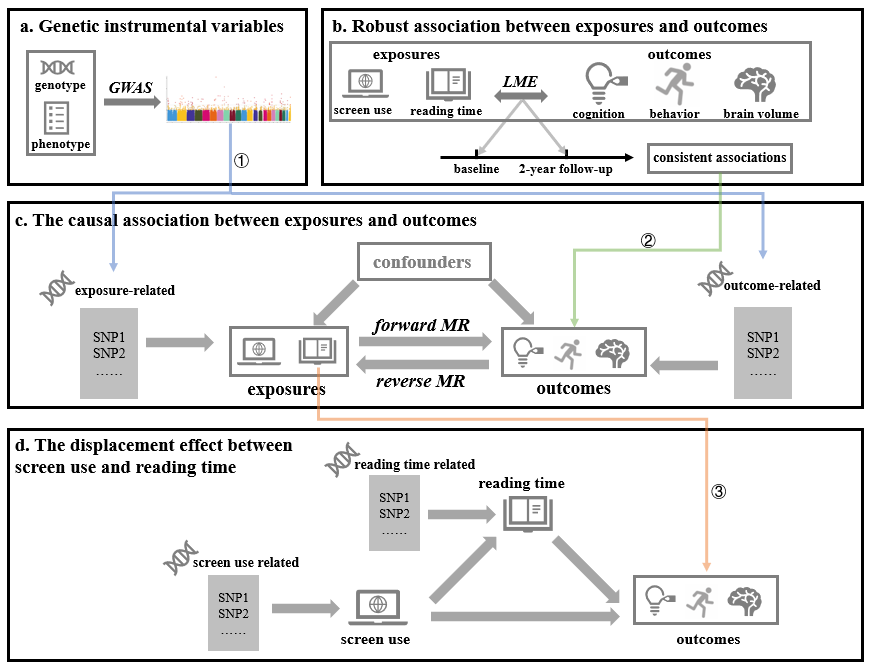
Participants: This study utilized data from the Adolescent Brain Cognitive Development (ABCD) study (v4). We excluded preterm-born infants with gestational age less than 37 weeks (n = 1629). And randomly excluded one participant from each pair of twins/siblings with a close gene relationship (pi-hat > 0.4). Finally, 7107 subjects remained at baseline and 4505 at two-year follow-up. Exposure, outcome, and confounding variables The study focused on six different exposure variables related to screen use 10,11 (e.g. TV shows or movies, videos, video games, texting, social networks, and video chatting) and reading time 12. The outcome variables in this study included five cognitive abilities assessed by the NIH Toolbox 11,13 and eight behavioral problems in the CBCL 11,14 (Fig 2). Neuroimaging traits included brain volumes of 160 regions estimated using the Destrieux and ASEG atlas 15,16. T1-weighted images were included in an optimized MRI acquisition protocol (FOV: 256 x 256, 1.0 x 1.0 x 1.0mm, TR = 2500ms, TE = 2.88ms, Flip angle = 8°) that is harmonized to be compatible across three 3T scanner platforms: Siemens Prisma, General Electric 750, and Phillips at 21 sites. And were preprocessed following the ABCD preprocessing pipeline 17. We adjusted for common confounding variables in our study, including age, sex, household income, parental education, race, ethnicity, prematurity, sibling, and site effect. Statistical analyses: We first used a linear mixed-effects model to explore the consistent association between the exposures and outcomes at two waves(e.g. baseline and two-year follow-up). Then we performed a one-sample MR analysis on the variables that had significant associations. We further employed a mediation analysis and a two-step MR analysis to examine whether screen use indirectly influences the outcomes by changing reading habits (Fig 1 shows the flowchart). Bonferroni correction was applied at each time point for non-neuroimage outcome variables, and FDR correction was applied for neuroimage variables.Results
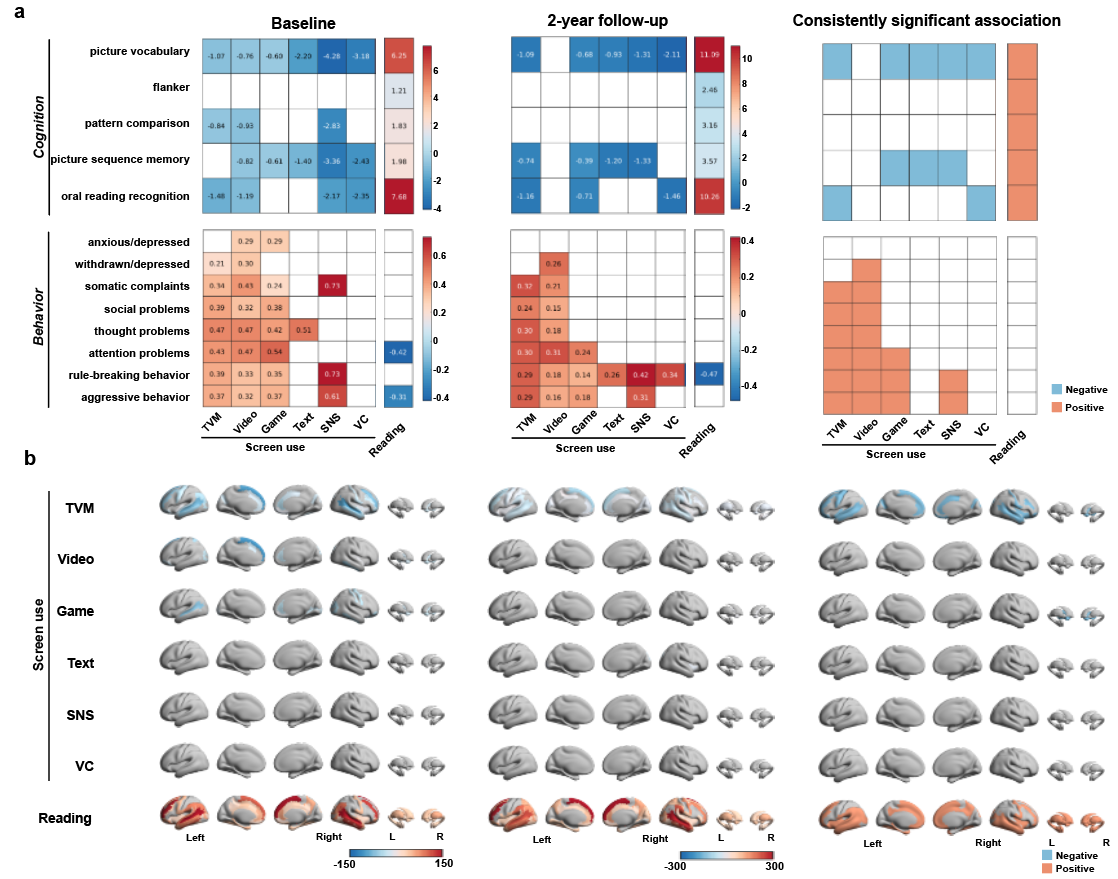
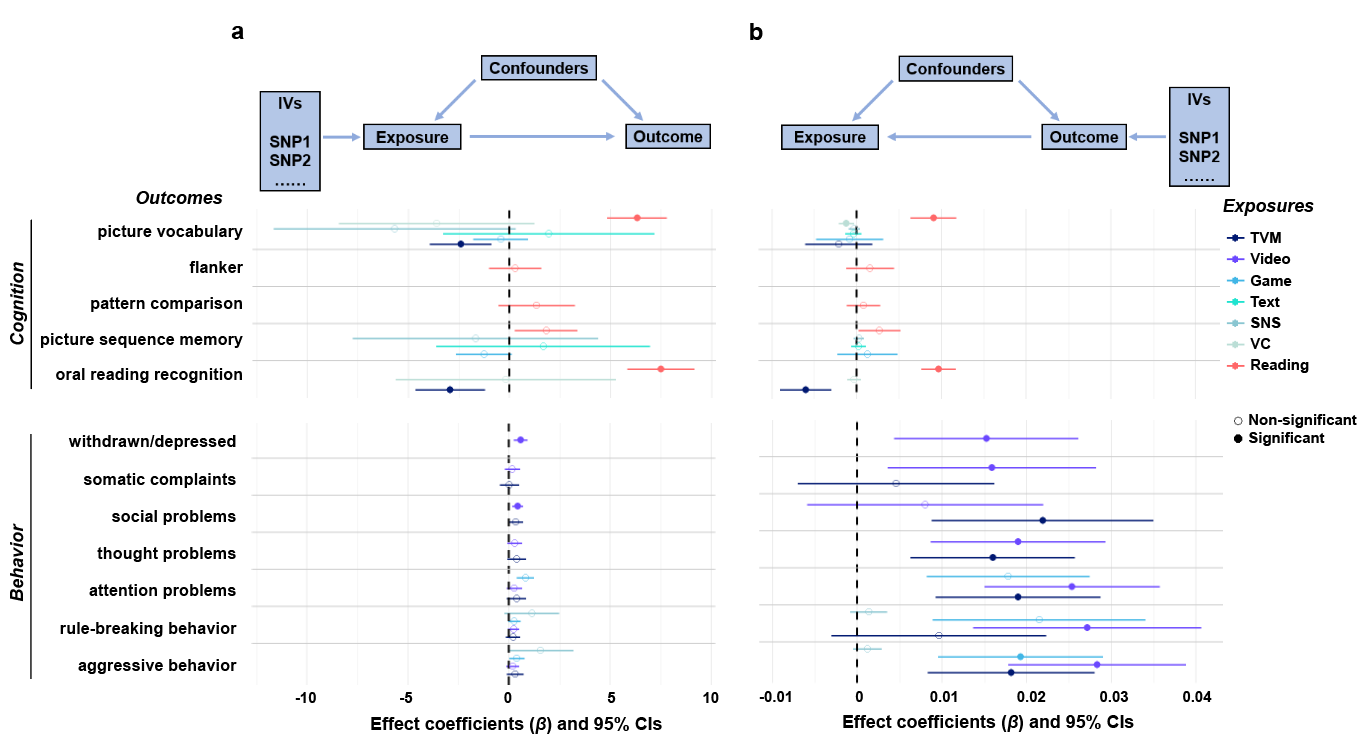
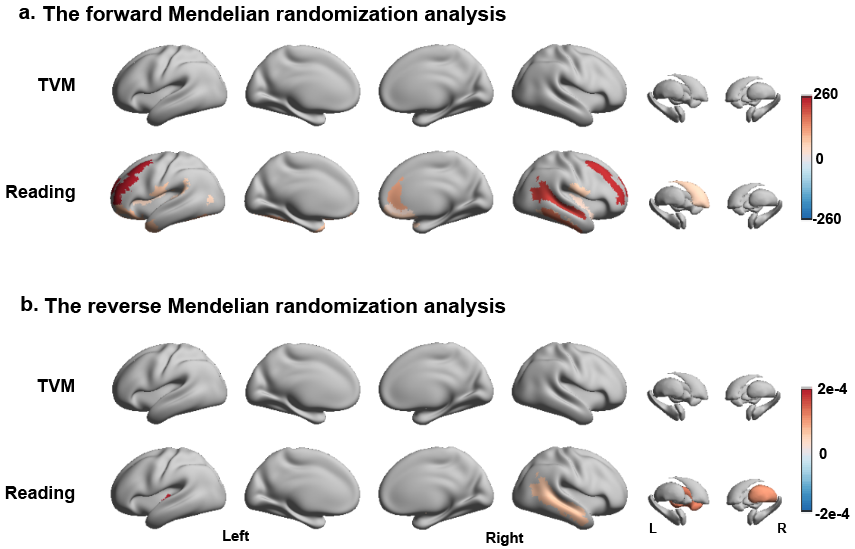
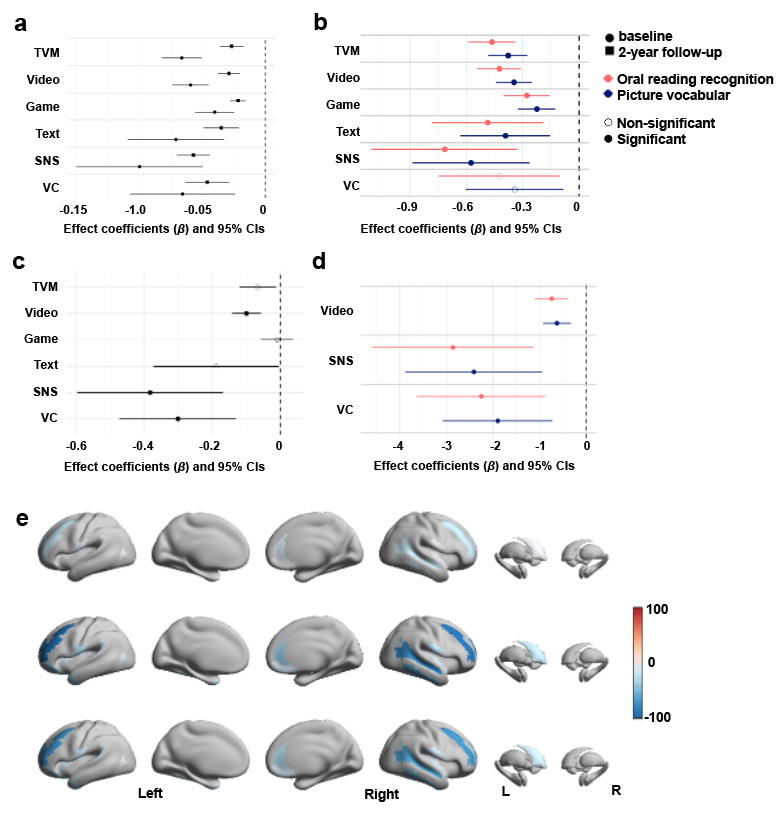
The linear mixed-effects model revealed consistently significant adverse associations between screen use and cognitive abilities, behavioral problems (corrected p < 0.05, Fig 1a), and brain volume in 32 regions (corrected p < 0.05, Fig 1b) at two time points. In contrast, reading habits showed significant positive associations with all cognitive abilities (Fig 1a) and brain volumes in 85 regions (Fig 1b), widely distributed in the temporal and frontal regions. MR analysis further revealed significant causal effects among the above associations. For instance, negative causal effect between TV use and oral reading recognition (β = -2.93, corrected p < 0.007, Fig 3a), and between reading habits and brain volume in 22 regions including the prefrontal, and temporal (corrected p < 0.05, Fig 4). Interestingly, increased screen use was identified as a result, rather than a cause, of certain behavioral issues such as rule-breaking and aggressive behaviors (Fig 3b). Regarding the displacement effect, we found a significant negative association between screen use and reading habits (β = -0.10 to -0.02, corrected p < 0.05, Fig 5a), and a significant mediation effect of screen use on the reading-related outcomes (Fig 5b). The two-step MR analysis further showed that screen use causally decreases reading time (Fig 5c), and indirectly impacts language abilities (Fig 5d). Specially, although screen use did not directly alter the brain volume, but it indirectly reduced brain volume via reducing reading time (Fig 5e).Discussion and Conclusion
Our study employed MR analysis to investigate the causal impact of screen use and reading on brain development in early adolescents. The results indicate that screen use has both direct and indirect effects on brain development. On the other hand, it is important to avoid exaggerating the negative consequences of screen use, as some behavioral problems may precede and contribute to excessive screen use. In summary, these findings underscore the importance of monitoring media use and the associated changes in habits resulting from media exposure.Acknowledgements
This work was supported by the Ministry of Science and Technology of the People’s Republic of China (2021ZD0200202), the National Natural Science Foundation of China (81971606, 82122032), and the Science and Technology Department of Zhejiang Province (202006140, 2022C03057). Data used in the preparation of this article were obtained from the Adolescent Brain Cognitive DevelopmentSM (ABCD) Study (https://abcdstudy.org), held in the NIMH Data Archive (NDA).References
1. Auhuber, L., Vogel, M., Grafe, N., Kiess, W. & Poulain, T. Leisure Activities of Healthy Children and Adolescents. Int. J. Environ. Res. Public Health 16, (2019).
2. Twenge, J. M., Martin, G. N. & Spitzberg, B. H. Trends in U.S. Adolescents’ Media Use, 1976-2016: The Rise of Digital Media, the Decline of TV, and the (Near) Demise of Print. Psychol. Pop. Media Cult. 8, 329–345 (2018).
3. Maza, M. T. et al. Association of Habitual Checking Behaviors on Social Media With Longitudinal Functional Brain Development. JAMA Pediatr. 177, 160–167 (2023).
4. Paulus, M. P. et al. Screen media activity and brain structure in youth: Evidence for diverse structural correlation networks from the ABCD study. Neuroimage 185, 140–153 (2019).
5. Hutton, J. S., Dudley, J., Horowitz-Kraus, T., Dewitt, T. & Holland, S. K. Associations between Screen-Based Media Use and Brain White Matter Integrity in Preschool-Aged Children. JAMA Pediatr. 174, 1–10 (2020).
6. Nagata, J. M. et al. Contemporary screen time modalities and disruptive behavior disorders in children: a prospective cohort study. J. Child Psychol. Psychiatry Allied Discip. 64, 125–135 (2023).
7. Odgers, C. L. & Jensen, M. R. Annual Research Review: Adolescent mental health in the digital age: facts, fears, and future directions. J. Child Psychol. Psychiatry Allied Discip. 61, 336–348 (2020).
8. Stiglic, N. & Viner, R. M. Effects of screentime on the health and well-being of children and adolescents: A systematic review of reviews. BMJ Open 9, (2019).
9. Sanderson, E. et al. Mendelian randomization. Nat. Rev. Methods Prim. 2, (2022).
10. Nagata, J. M. et al. Sociodemographic Correlates of Contemporary Screen Time Use among. J. Pediatr. 240, 213-220.e2 (2021).
11. Barch, D. M. et al. Demographic , physical and mental health assessments in the adolescent brain and cognitive development study : Rationale and description. Dev. Cogn. Neurosci. 32, 55–66 (2018).
12. Nagata, J. M. et al. Social epidemiology of early adolescent problematic screen use in the United States. Pediatr. Res. 92, 1443–1449 (2022).
13. Luciana, M. et al. Adolescent neurocognitive development and impacts of substance use : Overview of the adolescent brain cognitive development ( ABCD ) baseline neurocognition battery. Dev. Cogn. Neurosci. 32, 67–79 (2018).
14. Wainberg, M., Jacobs, G. R. & Voineskos, A. N. Neurobiological , familial and genetic risk factors for dimensional psychopathology in the Adolescent Brain Cognitive Development study. Mol. Psychiatry 27, 2731–2741 (2022).
15. Destrieux, C., Fischl, B., Dale, A. & Halgren, E. NeuroImage Automatic parcellation of human cortical gyri and sulci using standard anatomical nomenclature. Neuroimage 53, 1–15 (2010).
16. Fischl, B. et al. Whole Brain Segmentation : Neurotechnique Automated Labeling of Neuroanatomical Structures in the Human Brain. Neuron 33, 341–355 (2002).
17. Hagler, D. J. et al. NeuroImage Image processing and analysis methods for the Adolescent Brain Cognitive Development Study. Neuroimage 202, (2019).
Figures