1160
Abnormal white matter development during early childhood in autism spectrum disorder1School of Artificial Intelligence, Beijing University of Posts and Telecommunications, Beijing, China, 2State Key Laboratory of Cognitive Neuroscience and Learning, Beijing Key Laboratory of Brain Imaging and Connectomics, IDG/McGovern Institute for Brain Research, Beijing Normal University, Beijing, China, 3Developmental and Behavioural Paediatric Department and Child Primary Care Department, Ministry of Education-Shanghai Key Laboratory for Children's Environmental Health, Xinhua Hospital, Shanghai Jiao Tong University School of Medicine, Shanghai, China, 4Institute of Science and Technology for Brain-Inspired Intelligence, Fudan University, Shanghai, China, 5Department of Computer Science, University of Warwick, Coventry, United Kingdom, 6Oxford Centre for Computational Neuroscience, Oxford, UK, Oxford, United Kingdom, 7Key Laboratory of Computational Neuroscience and Brain-Inspired Intelligence (Fudan University), Ministry of Education, Shanghai, China
Synopsis
Keywords: Neuro, Brain, Autism, Neurodevelopment
Motivation: The axon morphology underlying the evolution of Autism Spectrum Disorder (ASD) symptoms during early childhood is still enigmatic.
Goal(s): To uncover the developmental patterns of axon density in early childhood of ASD , and further explore their relationships with clinical measures in ASD.
Approach: We used a multi-shell diffusion MRI dataset of 1- to 7-year-old children (including 156 ASD , 48 developmental delay/intellectual disability and 160 Typical Development).
Results: ASD reserved three white matter clusters during early childhood as TD, but exhibited abnormal curves with various developmental stages. The development-stage-specific associations between axon density and clinical measures were elucidated in ASD.
Impact: Whilst reserving uneven spatial layouts of white matter development during early childhood as TD, ASD exhibited developmental curves with altered growth rates and distinct clinical associations in different developmental stages, elucidating potential targets for early diagnoses and interventions in ASD.
Background
Autism spectrum disorder (ASD) is a typical neurodevelopmental disorder (NDD)1 and its presenting symptoms depend on age2. It often co-occurs at a high prevalence with developmental delay/intellectual disability (DD/ID)3,4. The neurophysiology underlying the evolution of their symptoms and cognitive impairments is still enigmatic.Atypical axon morphology in ASD individuals were identified by postmortem studies, highlighted by lower axon numbers and smaller axon sizes5,6. Diffusion tensor imaging (DTI) suggested atypical white matter (WM) development in ASD and DD/ID, with reduced fractional anisotropy (FA) and flatter developmental trajectories in WM7-9. However, DTI metrics lack tissue specificity10,11.
Neurite orientation dispersion and density imaging12 provides tissue-specific measures of WM microstructure, neurite density index (NDI) and orientation dispersion index (ODI), validated by postmortem studies13. NDI in Typical Development children (TD) was characterized by initial rapid growths followed by more gradual increases14-16. Moreover, NDI in ASD adults was associated with their clinical implications17-20. However, temporal and spatial developmental patterns of axon morphology in ASD during early childhood and their associations with clinical symptoms are still yet to be explored.
Methods
We employed a large dataset of 364 children under 8 years old21, including 160 TD (1.17-7.94 years, 49.4% males), 105 ASD with DD/ID (1.62-7.89 years, 87.6% males), 51 ASD without DD/ID (1.73-7.95 years, 82.4% males), and 48 DD/ID (2.32-7.77 years, 35.2% males). Clinical diagnoses were made based on Diagnostic and Statistical Manual of Mental Disorders-Fifth Edition (DSM-5)1 and confirmed by ADOS22. The DQ and IQ were assessed by Gesell Developmental Schedules (GDS)23 for children younger than 4 years and age-appropriate Wechsler scales24-25. Informed consent was obtained from parents or guardians of each participant. The study was approved by the local Ethical Committee.We used a 3.0T MRI scanner using an echo-planar imaging (EPI) sequence with parameters: echo time/repetition time = 84/14500 ms; voxel size = 2×2×2 mm3; b=1000 and 2000 s/mm2 with 30 directions per shell; 3 b0 images. Children with high compliance had MR scans without additional preparations. Otherwise, sedation with chloral hydrate orally or by enema was given carefully guided by experienced nurses.
The quality of diffusion MR images was visually checked by two researchers blinded to the diagnosis. Next, images were (pre-)processed: 1) denoising26; 2) Gibbs-ring removal27; 3) eddy-current distortion and motion correction28; 4) B1 bias correction29; 5) computing NODDI metric maps30. To minimize potential biases introduced by inaccurate registrations in early childhood, we defined core WM ROI using a multi-level computational framework: 1) warped ICBM-DTI-81 WM atlas31 into the study-specific group tensor template; 2) skeletonised and warped the skeletonized core WM ROIs into 7 study-specific age-specific tensor templates (one per year). 36 ROIs were chosen due to incomplete coverage of the cerebellum.The study-specific age-specific tensor templates were created from selective participants within the same year. The group-specific tensor template was created using seven age-specific tensor templates. All registrations were conducted using NiftiReg32 and DTI-TK33. For all participants, their NDI maps were transformed from native space into the space of age-specific tensor templates and mean NDI of core WM ROIs were computed.
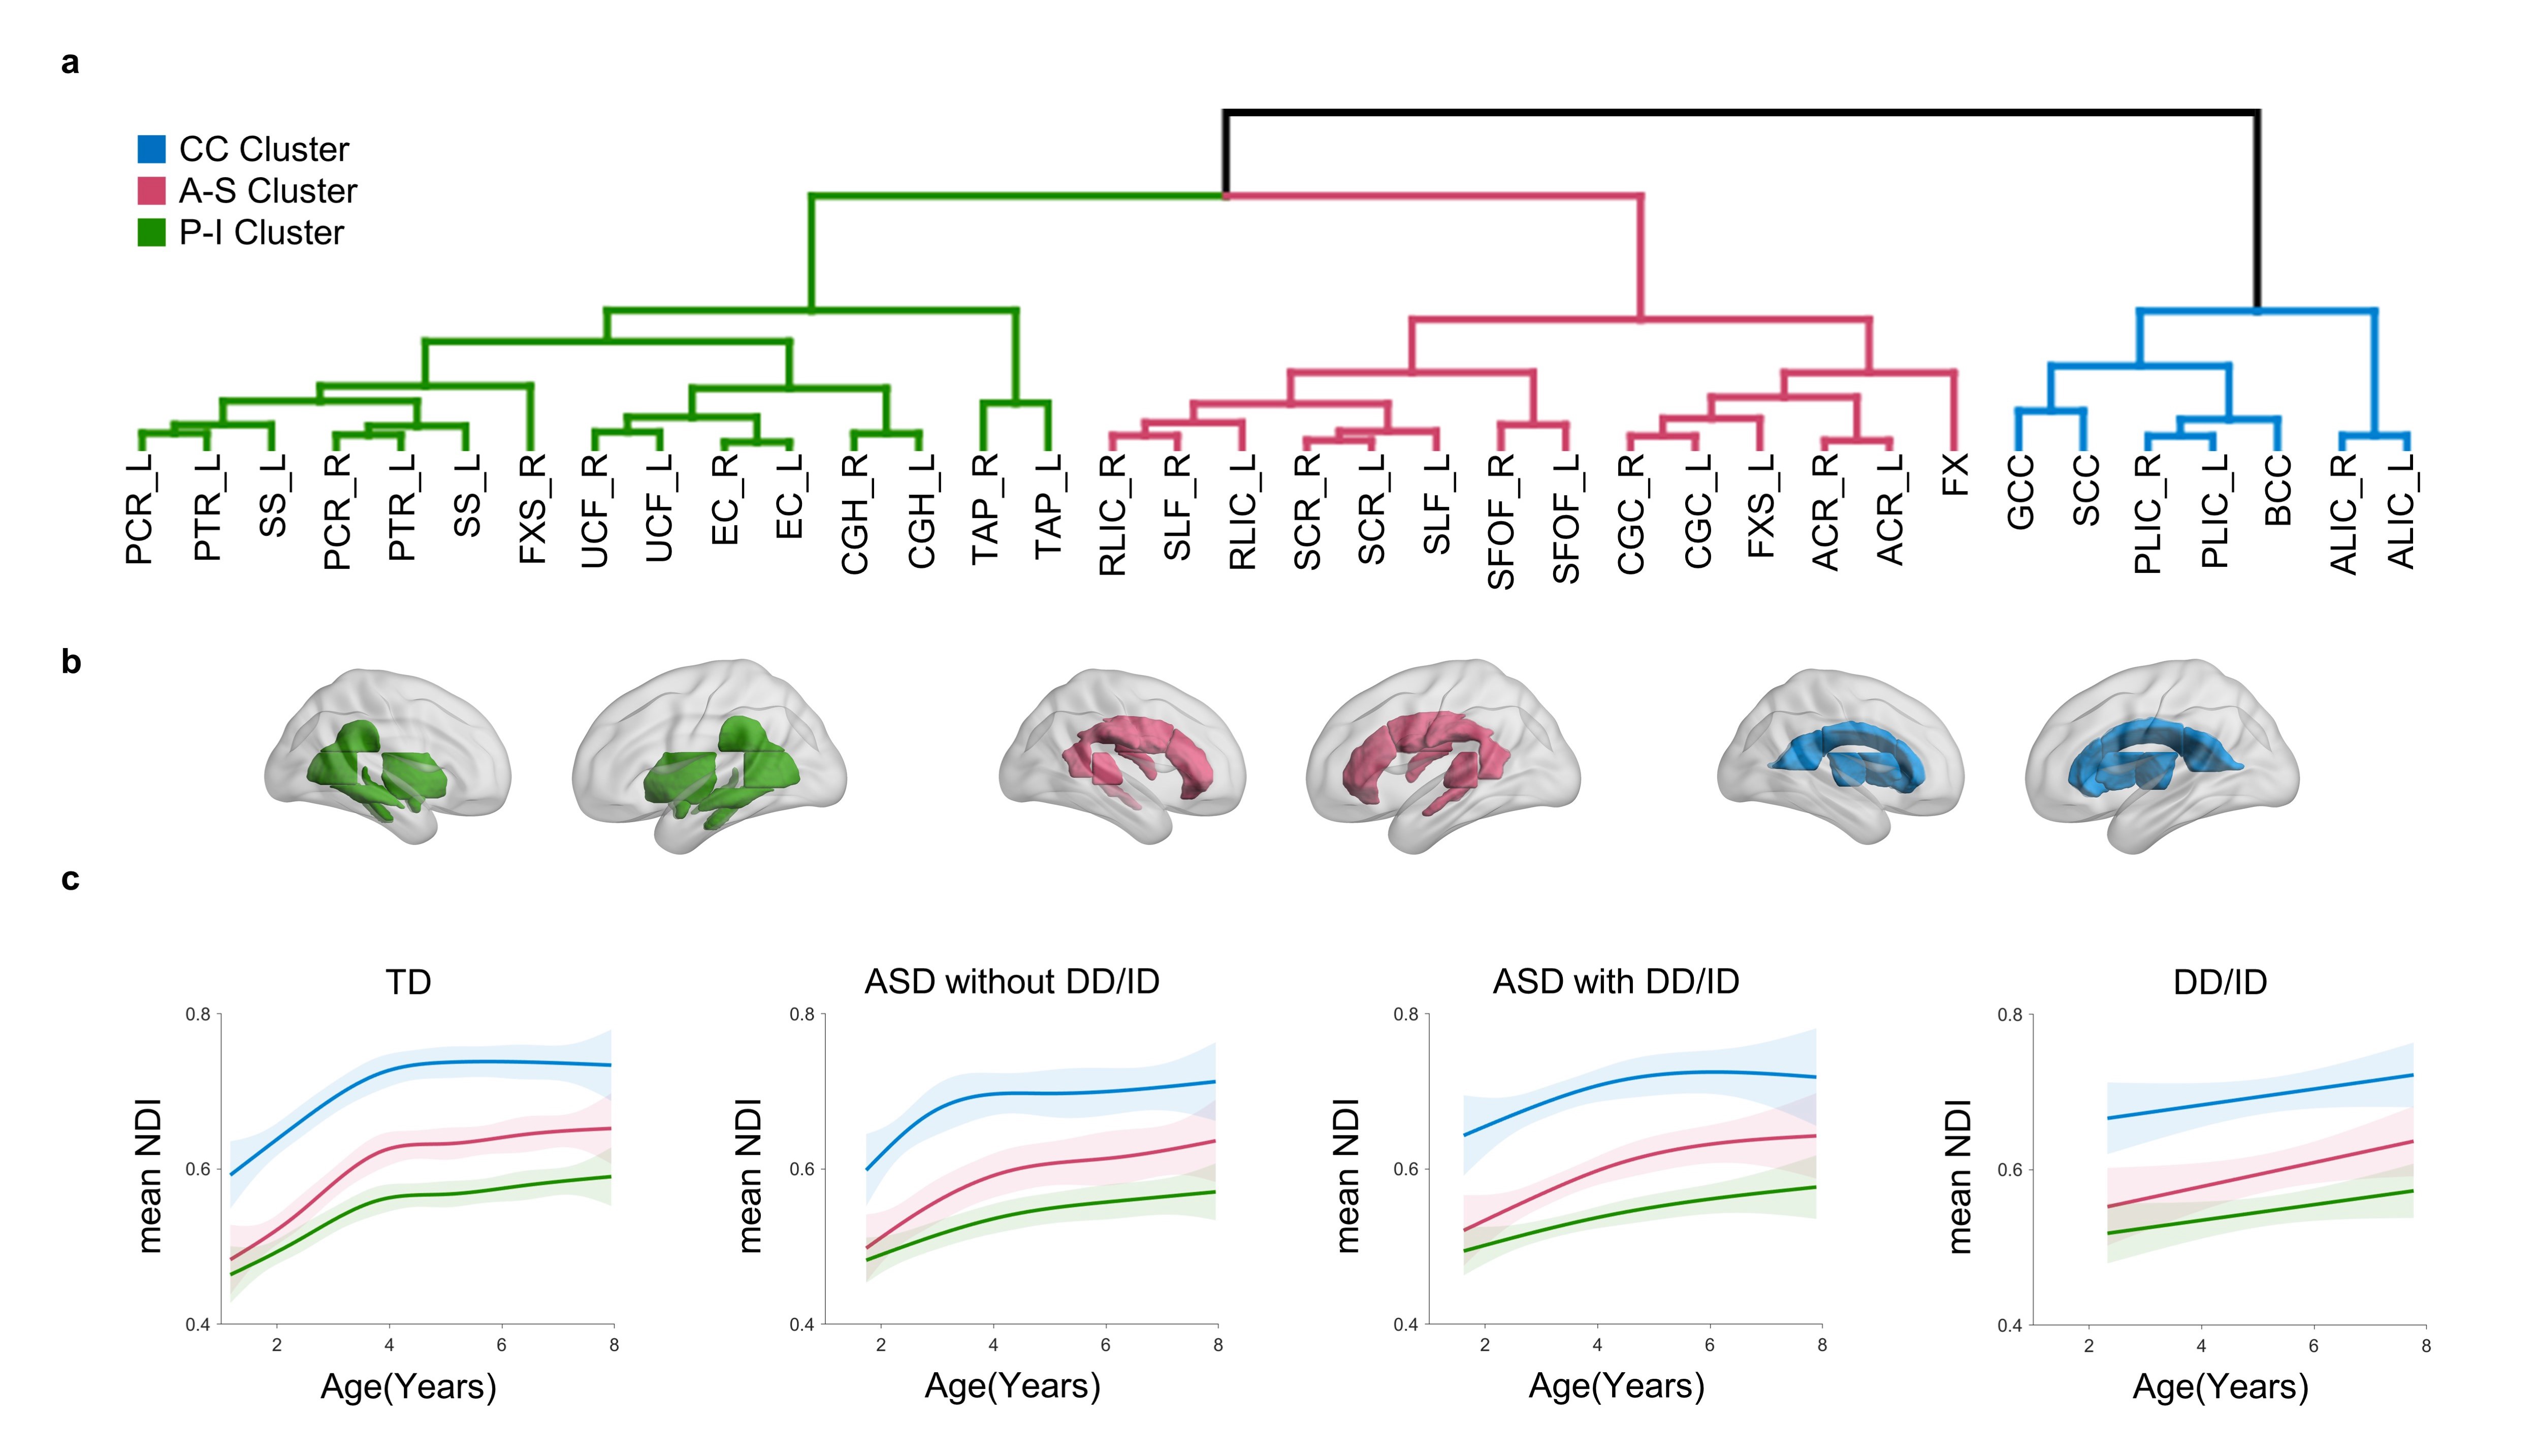
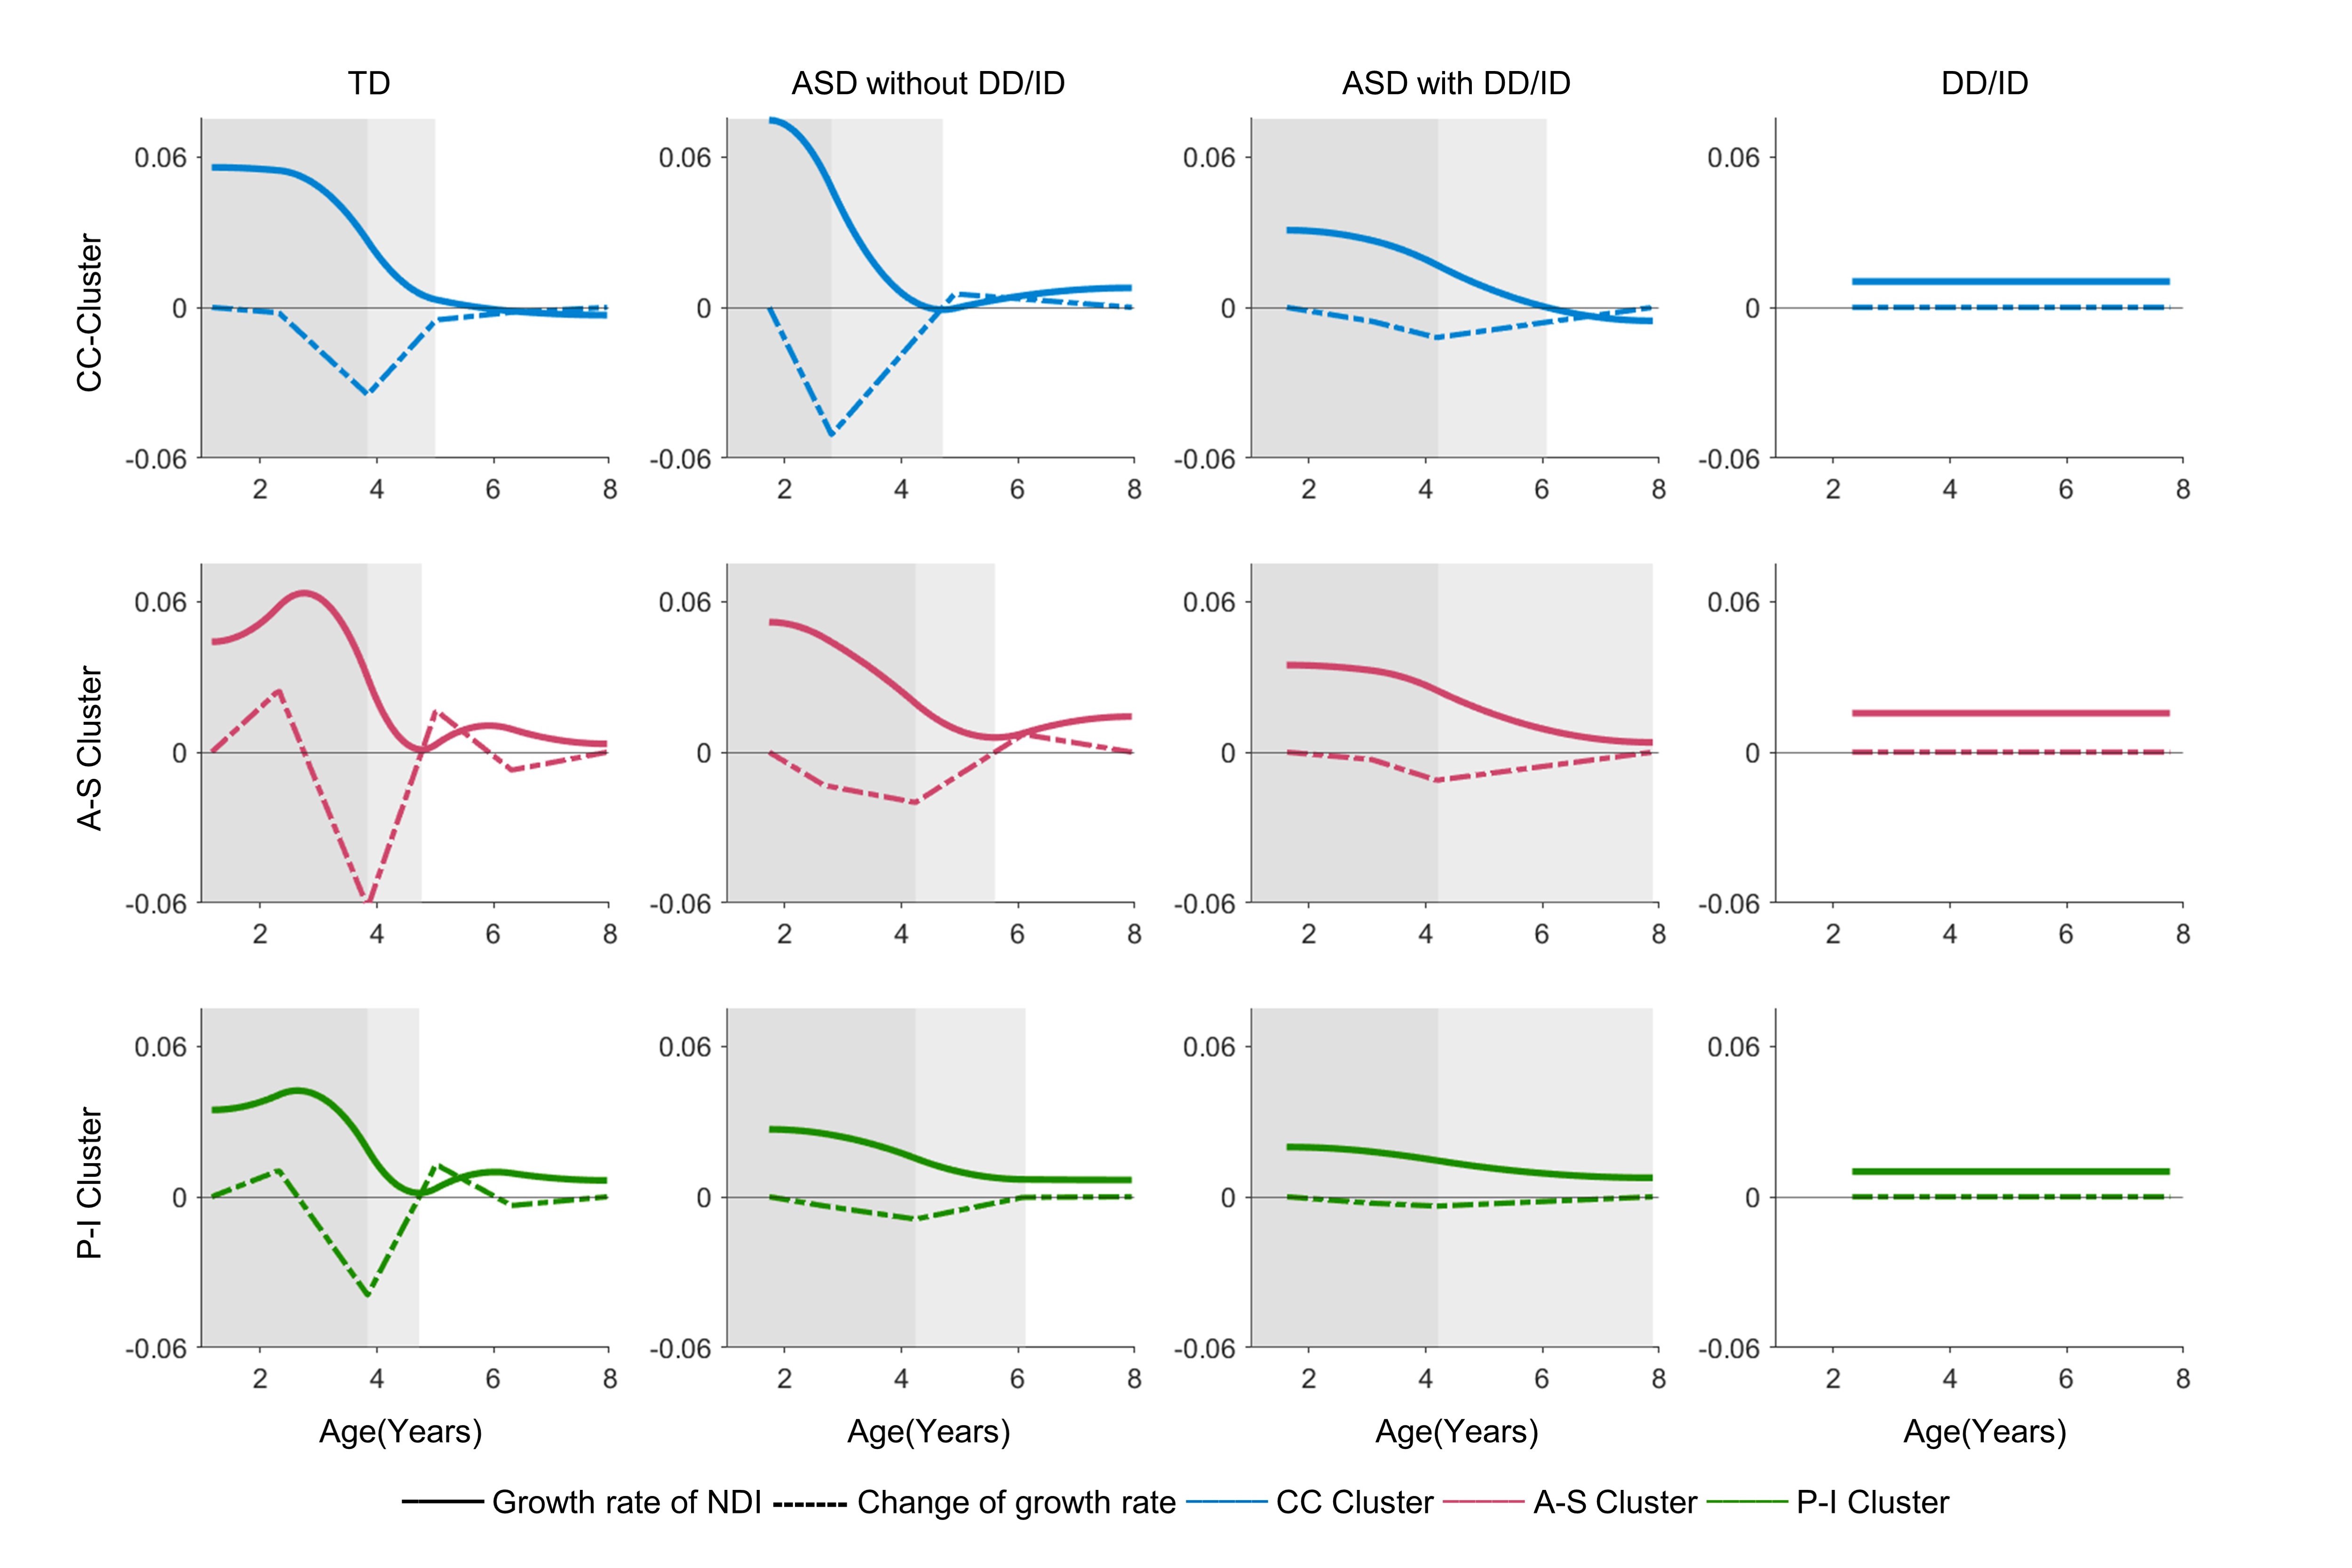
As we identified NDI but not ODI correlated with age in early childhood, we used NDI to elucidate the spatial patterns of WM development during early childhood using hybrid hierarchical clustering34. We further used generalized additive model to fit the developmental curves of WM clusters. We then delineated growth rates of NDI using first derivatives of developmental curves and defined growth stages accordingly. Finally, we explored the relationship between NDI and clinical measures in atypical development. FDR using Benjamini‒Hochberg was conducted for correcting multiple comparisons (P<.05).
Results
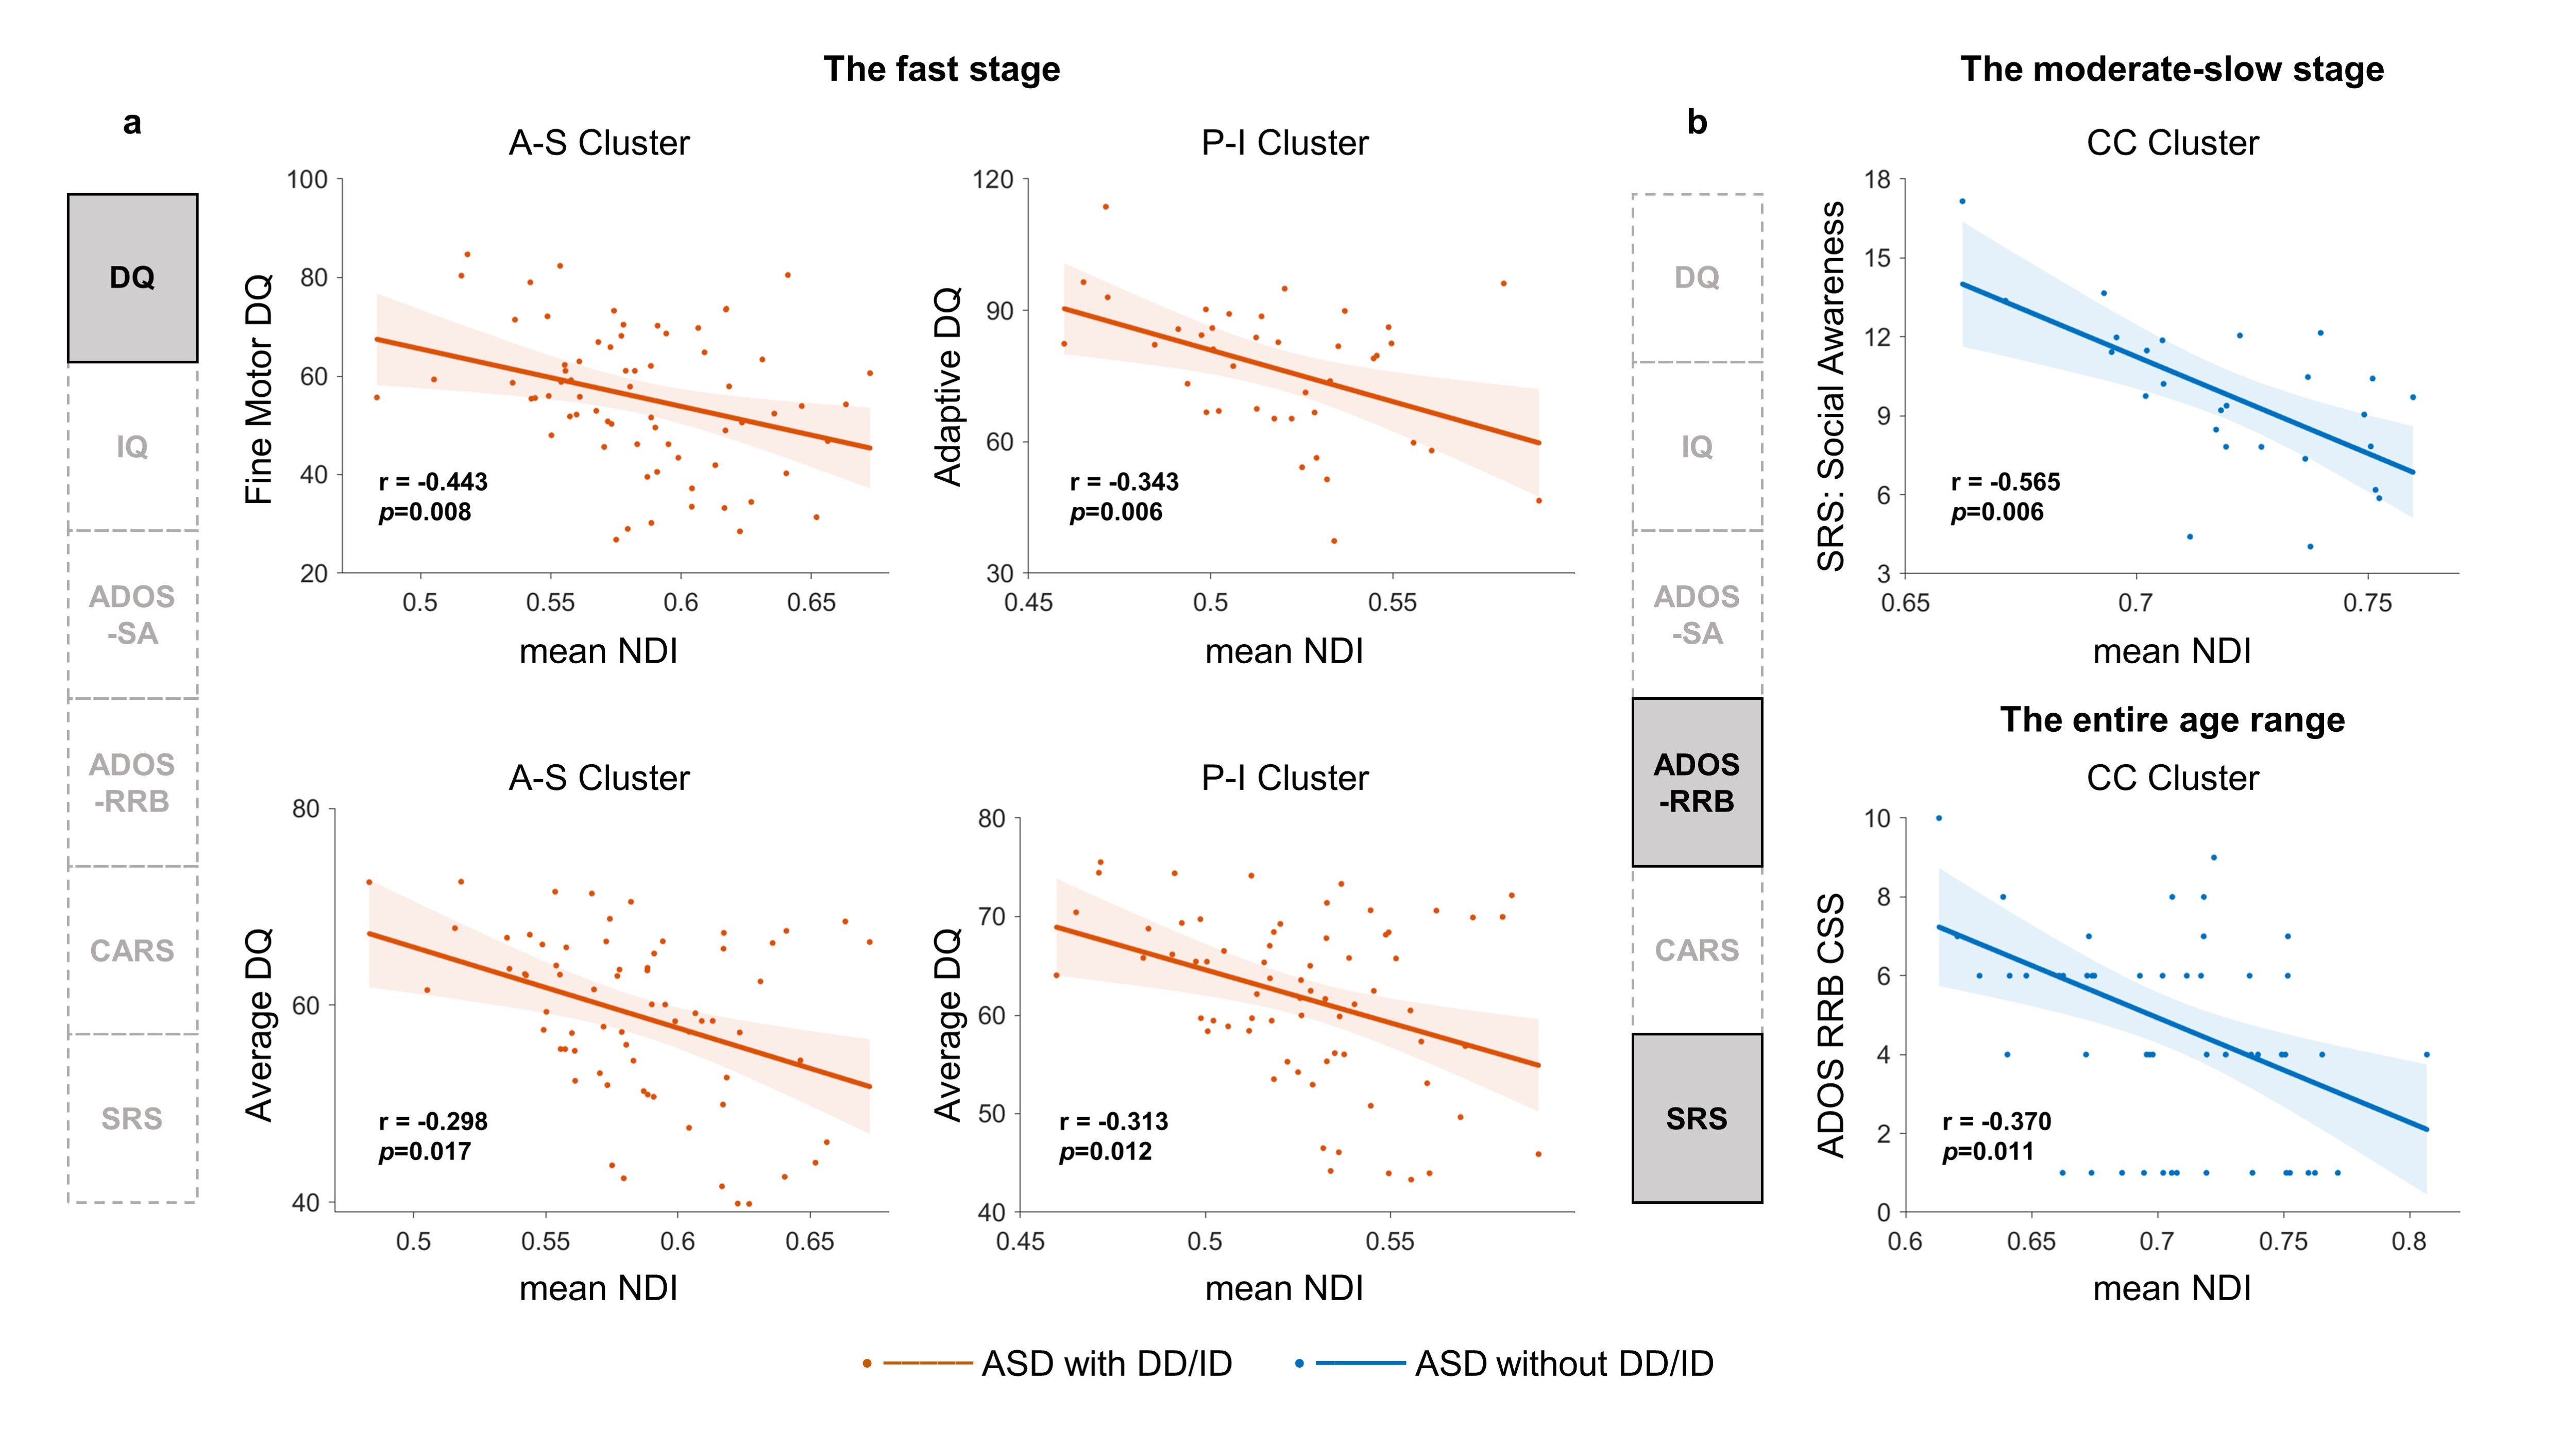
We consistently detected three WM clusters across all typical and atypical groups which indicated that the spatial layout of WM was conserved in the early developmental process of ASD and DD/ID children. Furthermore, we identified three stages with successively lower developmental rates in ASD, which similar to those of TD but delayed overall with more severe manifestations in ASD with DD/ID. In contrast, DD/ID showed the slowest growth rates and lacked staging features. Finally, for ASD, NDI in A-S and P-I Cluster correlated with cognitive impairments in the fast stage while NDI in CC Cluster was associated with social deficits during the moderate-slow stages.Conclusions
In conclusion, we identified that ASD reserved three WM clusters during early childhood as TD, but exhibited abnormal curves with various developmental stages. The development-stage-specific associations between axon density and clinical measures were elucidated in ASD. Our findings may help elucidate the neurophysiology underlying the evolution of its clinical symptoms and highlight potential targets for early diagnoses and effective interventions.Acknowledgements
We thanked Dr. Yong He from Beijing Normal University and Dr. Daniel Alexander from University College London for their helpful comments and discussions. This study was supported by grants from the National Natural Science Foundation of China (82125032, 81930095, 81901826, 81761128035, 82202243, 82204048 and 82001771), the Science and Technology Commission of Shanghai Municipality (19410713500 and 2018SHZDZX01), the Shanghai Municipal Commission of Health and Family Planning (GWV-10.1-XK07, 2020CXJQ01, 2018YJRC03), the Shanghai Clinical Key Subject Construction Project (shslczdzk02902), the Shanghai Municipal Science and Technology Major Project [No.2018SHZDZX01], Innovative research team of high-level local universities in Shanghai (SHSMU-ZDCX20211100), the Guangdong Key Project (2018B030335001), the Shanghai Municipal Commission of Health and Family Planning (20214Y0125).References
1. American Psychiatric Association, DSM-5 Task Force. (2013). Diagnostic and statistical manual of mental disorders: DSM-5™ (5th ed.). American Psychiatric Publishing, Inc.. https://doi.org/10.1176/appi.books.9780890425596.
2. Hirota T, King BH. Autism Spectrum Disorder. Jama. 2023;329(2).
3. Li HH, Feng JY, Wang B, Zhang Y, Wang CX, Jia FY. Comparison Of The Children Neuropsychological And Behavior Scale And The Griffiths Mental Development Scales When Assessing The Development Of Children With Autism. Psychol Res Behav Manag. 2019;12:973-981.
4. Shenouda J, Barrett E, Davidow AL, et al. Prevalence and Disparities in the Detection of Autism Without Intellectual Disability. Pediatrics. 2023;151(2).
5. Wegiel J, Kaczmarski W, Flory M, et al. Deficit of corpus callosum axons, reduced axon diameter and decreased area are markers of abnormal development of interhemispheric connections in autistic subjects. Acta Neuropathol Commun. 2018;6(1):143.
6. Trutzer IM, Garcia-Cabezas MA, Zikopoulos B. Postnatal development and maturation of layer 1 in the lateral prefrontal cortex and its disruption in autism. Acta Neuropathol Commun. 2019;7(1):40.
7. Andrews DS, Lee JK, Harvey DJ, et al. A Longitudinal Study of White Matter Development in Relation to Changes in Autism Severity Across Early Childhood. Biol Psychiatry. 2021;89(5):424-432.
8. Ouyang M, Cheng H, Mishra V, et al. Atypical age-dependent effects of autism on white matter microstructure in children of 2-7 years. Hum Brain Mapp. 2016;37(2):819-832.
9. Solso S, Xu R, Proudfoot J, et al. Diffusion Tensor Imaging Provides Evidence of Possible Axonal Overconnectivity in Frontal Lobes in Autism Spectrum Disorder Toddlers. Biol Psychiatry. 2016;79(8):676-684.
10. Jones DK, Knösche TR, Turner R. White matter integrity, fiber count, and other fallacies: the do's and don'ts of diffusion MRI. Neuroimage. 2013;73:239-254.
11. Beaulieu C. The basis of anisotropic water diffusion in the nervous system - a technical review. NMR Biomed. 2002;15(7-8):435-455.
12. Zhang H, Schneider T, Wheeler-Kingshott CA, Alexander DC. NODDI: practical in vivo neurite orientation dispersion and density imaging of the human brain. Neuroimage. 2012;61(4):1000-1016.
13. Grussu F, Schneider T, Tur C, et al. Neurite dispersion: a new marker of multiple sclerosis spinal cord pathology? Ann Clin Transl Neurol. 2017;4(9):663-679.
14. Dimond D, Heo S, Ip A, et al. Maturation and interhemispheric asymmetry in neurite density and orientation dispersion in early childhood. Neuroimage. 2020;221:117168.
15. Lynch KM, Cabeen RP, Toga AW, Clark KA. Magnitude and timing of major white matter tract maturation from infancy through adolescence with NODDI. Neuroimage. 2020;212:116672.
16. Zhao X, Shi J, Dai F, et al. Brain Development From Newborn to Adolescence: Evaluation by Neurite Orientation Dispersion and Density Imaging. Front Hum Neurosci. 2021;15:616132.
17. Yasuno F, Makinodan M, Takahashi M, et al. Microstructural Anomalies Evaluated by Neurite Orientation Dispersion and Density Imaging Are Related to Deficits in Facial Emotional Recognition via Perceptual-Binding Difficulties in Autism Spectrum Disorder. Autism Res. 2020;13(5):729-740.
18. Matsuoka K, Makinodan M, Kitamura S, et al. Increased Dendritic Orientation Dispersion in the Left Occipital Gyrus is Associated with Atypical Visual Processing in Adults with Autism Spectrum Disorder. Cereb Cortex. 2020;30(11):5617-5625.
19. Kitamura S, Matsuoka K, Takahashi M, et al. Association of adverse childhood experience-related increase in neurite density with sensory over-responsivity in autism spectrum disorder: A neurite orientation dispersion and density imaging study. J Psychiatr Res. 2023;161:316-323.
20. Andica C, Kamagata K, Kirino E, et al. Neurite orientation dispersion and density imaging reveals white matter microstructural alterations in adults with autism. Mol Autism. 2021;12(1):48.
21. Dai, Y. et al. Shanghai Autism Early Development: An Integrative Chinese ASD Cohort. Neurosci Bull 38, 1603-1607, doi:10.1007/s12264-022-00904-y (2022).
22. Lord C, Risi S, Lambrecht L, et al. The autism diagnostic observation schedule-generic: a standard measure of social and communication deficits associated with the spectrum of autism. J Autism Dev Disord. 2000;30(3):205-223.
23.Wang Y, Zhang Y, Ji L, et al. Prenatal and postnatal exposure to organophosphate pesticides and childhood neurodevelopment in Shandong, China. Environ Int. 2017;108:119-126.25.
24. Wechsler, D. (2002). Wechsler preschool and primary scale of intelligence (3rd ed.). San Antonio, TX: Psychological Corporation.
25. Wechsler, D. (2003). Wechsler intelligence scale for children (4th ed.). San Antonio: The Psychological Corporation.
26. Cordero-Grande, L., Christiaens, D., Hutter, J., Price, A. N. & Hajnal, J. V. Complex diffusion-weighted image estimation via matrix recovery under general noise models. Neuroimage 200, 391-404, doi:10.1016/j.neuroimage.2019.06.039 (2019).
27. Kellner, E., Dhital, B., Kiselev, V. G. & Reisert, M. Gibbs-ringing artifact removal based on local subvoxel-shifts. Magn Reson Med 76, 1574-1581, doi:10.1002/mrm.26054 (2016).
28. Graham, M. S., Drobnjak, I., Jenkinson, M. & Zhang, H. Quantitative assessment of the susceptibility artefact and its interaction with motion in diffusion MRI. PLoS One 12, e0185647, doi:10.1371/journal.pone.0185647 (2017).
29. Tustison, N. J. et al. N4ITK: improved N3 bias correction. IEEE Trans Med Imaging 29, 1310-1320, doi:10.1109/tmi.2010.2046908 (2010).
30. https://www.nitrc.org/projects/noddi_toolbox
31. Mori, S. et al. Stereotaxic white matter atlas based on diffusion tensor imaging in an ICBM template. Neuroimage 40, 570-582, doi:10.1016/j.neuroimage.2007.12.035 (2008).
32. Modat, M. et al. Fast free-form deformation using graphics processing units. Comput Methods Programs Biomed 98, 278-284, doi:10.1016/j.cmpb.2009.09.002 (2010).
33. Zhang, H., Yushkevich, P. A., Alexander, D. C. & Gee, J. C. Deformable registration of diffusion tensor MR images with explicit orientation optimization. Med Image Anal 10, 764-785, doi:10.1016/j.media.2006.06.004 (2006).
34. Chipman, H. & Tibshirani, R. Hybrid hierarchical clustering with applications to microarray data. Biostatistics 7, 286-301, doi:10.1093/biostatistics/kxj007 (2006).
Figures