1153
Cellular signatures of microstructural development in the human cerebral cortex1Neuroscience Advanced Clinical Imaging Service (NACIS), Department of Neurosurgery, The Royal Children's Hospital, Melbourne, Australia, 2Cardiff University Brain Research Imaging Centre (CUBRIC), Cardiff University, Cardiff, United Kingdom, 3Developmental Imaging, Murdoch Children's Research Institute, Melbourne, Australia, 4Department of Mathematics and Computer Science, Eindhoven University of Technology, Eindhoven, Netherlands, 5Department of Radiology, New York University Grossman School of Medicine, New York, NY, United States, 6Image Sciences Institute, University Medical Center Utrecht, Utrecht, Netherlands
Synopsis
Keywords: Normal Development, Microstructure, Development, cortex, childhood, adolescence
Motivation: The adolescent brain has been well described using MRI, revealing ongoing cortical thinning and volume loss. But which underlying cellular properties drive these changes?
Goal(s): To model developmental patterns of soma and neurite architecture in the human cerebral cortex.
Approach: We quantified in vivo cortical neurite and soma microstructure in a sample of children and adolescents aged 8-18 years. We then analysed two human gene expression databases to determine cell-type specific profiles underlying these MR-based changes.
Results: Developmental increases in neurite density and reductions in soma radius suggest increasing cortical oligodendrocyte density, supporting the model of protracted intra-cortical myelination throughout the adolescent period.
Impact: Our novel study suggests that ongoing intracortical myelination underpins developmental patterns of cortical neurite and soma microstructure. Once thought to be driven by synaptic pruning, increasing cortical oligodendrocyte density may underlie previously reported patterns of cortical volume loss in adolescence.
Introduction
Structural MRI permits the study of cortical development, highlighting decreases in cortical thickness and volume with age through late childhood and adolescence1,2. Microstructural development of the cortex during this period has been studied to a lesser extent3, partly due to limitations in feasible imaging acquisitions. Recent hardware4 and software5,6 developments now enable microstructural modelling of soma and neurite components of the cortex7. To complement microstructural modelling, human gene expression databases can offer insight into cell type-specific mechanisms that underpin microscopic and macroscopic changes observed with in vivo MRI. Here we study cortical microstructural development in a sample of children and adolescents to identify specific changes in neurite and soma properties with age. To identify putative cellular substrates, we compare these changes to contemporaneous trajectories of cortical cell-type specific gene expression measured in the developing cortex.Methods
In vivo MRI: A sample of typically developing children and adolescents (N=88, mean age=12.6 years, SD=2.9 years, 46 female) underwent MRI on a 3T Siemens Connectom system with ultra-strong (300 mT/m) gradients. Structural T1-weighted (voxel-size=1x1x1mm; TE/TR=2/2300 ms) and multi-shell dMRI (TE/TR = 59/3000 ms; voxel-size=2x2x2mm; b-values=0(14 vols);500,1200(30 dirs),2400,4000,6000(60 dirs) s/mm2) data were acquired.T1 data were processed to obtain both a network-level8 and regional cortical parcellation9. Pre-processing of dMRI data followed: denoising10, and correction for drift11; motion, eddy, and susceptibility-induced distortions12,13, Gibbs ringing artefact14, bias field15; and gradient non-uniformities16. For each subject, the soma and neurite density imaging (SANDI) compartment model was fitted6 on dMRI data to compute neurite, soma and extracellular signal fractions (fneurite, fsoma, fextracellular) and the soma radius (Rsoma, in µm) in seven functionally-defined networks8. Follow-up analyses using a fine cortical parcellation9 were performed to complement the gene expression data sampled from multiple regions in the frontal cortex.
Cortical gene expression: Pre-processed, batch-corrected and normalised microarray and mRNA-seq data from postmortem human tissue samples of the frontal cortex were obtained from the BrainCloud17 (n=214; aged 6months – 78.2years; 144 male; postmortem interval [PMI]=29.96[15.28]; RNA integrity [RIN]=8.14[0.83]) and PsychENCODE (n=20; 6months-40years; 10 male; PMI=17.85[6.75]; RIN=8.45[0.79]) projects, respectively18. Genes were filtered to include only protein-coding genes enriched in cortical cell types (n=3100). To identify genes differentially expressed over age (pFDR<.05), we modelled age-related changes in all available postnatal tissue samples using nonlinear Generalised Additive Models (GAM) with thin plate splines (k=5)19.
Using a database of single-cell RNA-seq studies, we identified genes differentially expressed across major cortical cell types (excitatory and inhibitory neurons, oligodendrocytes, oligodendrocyte precursor cells [OPCs], microglia, astrocytes, and endothelial cells20). For each cell class, we tested for significant enrichment of age-related genes (p<.05).
Results
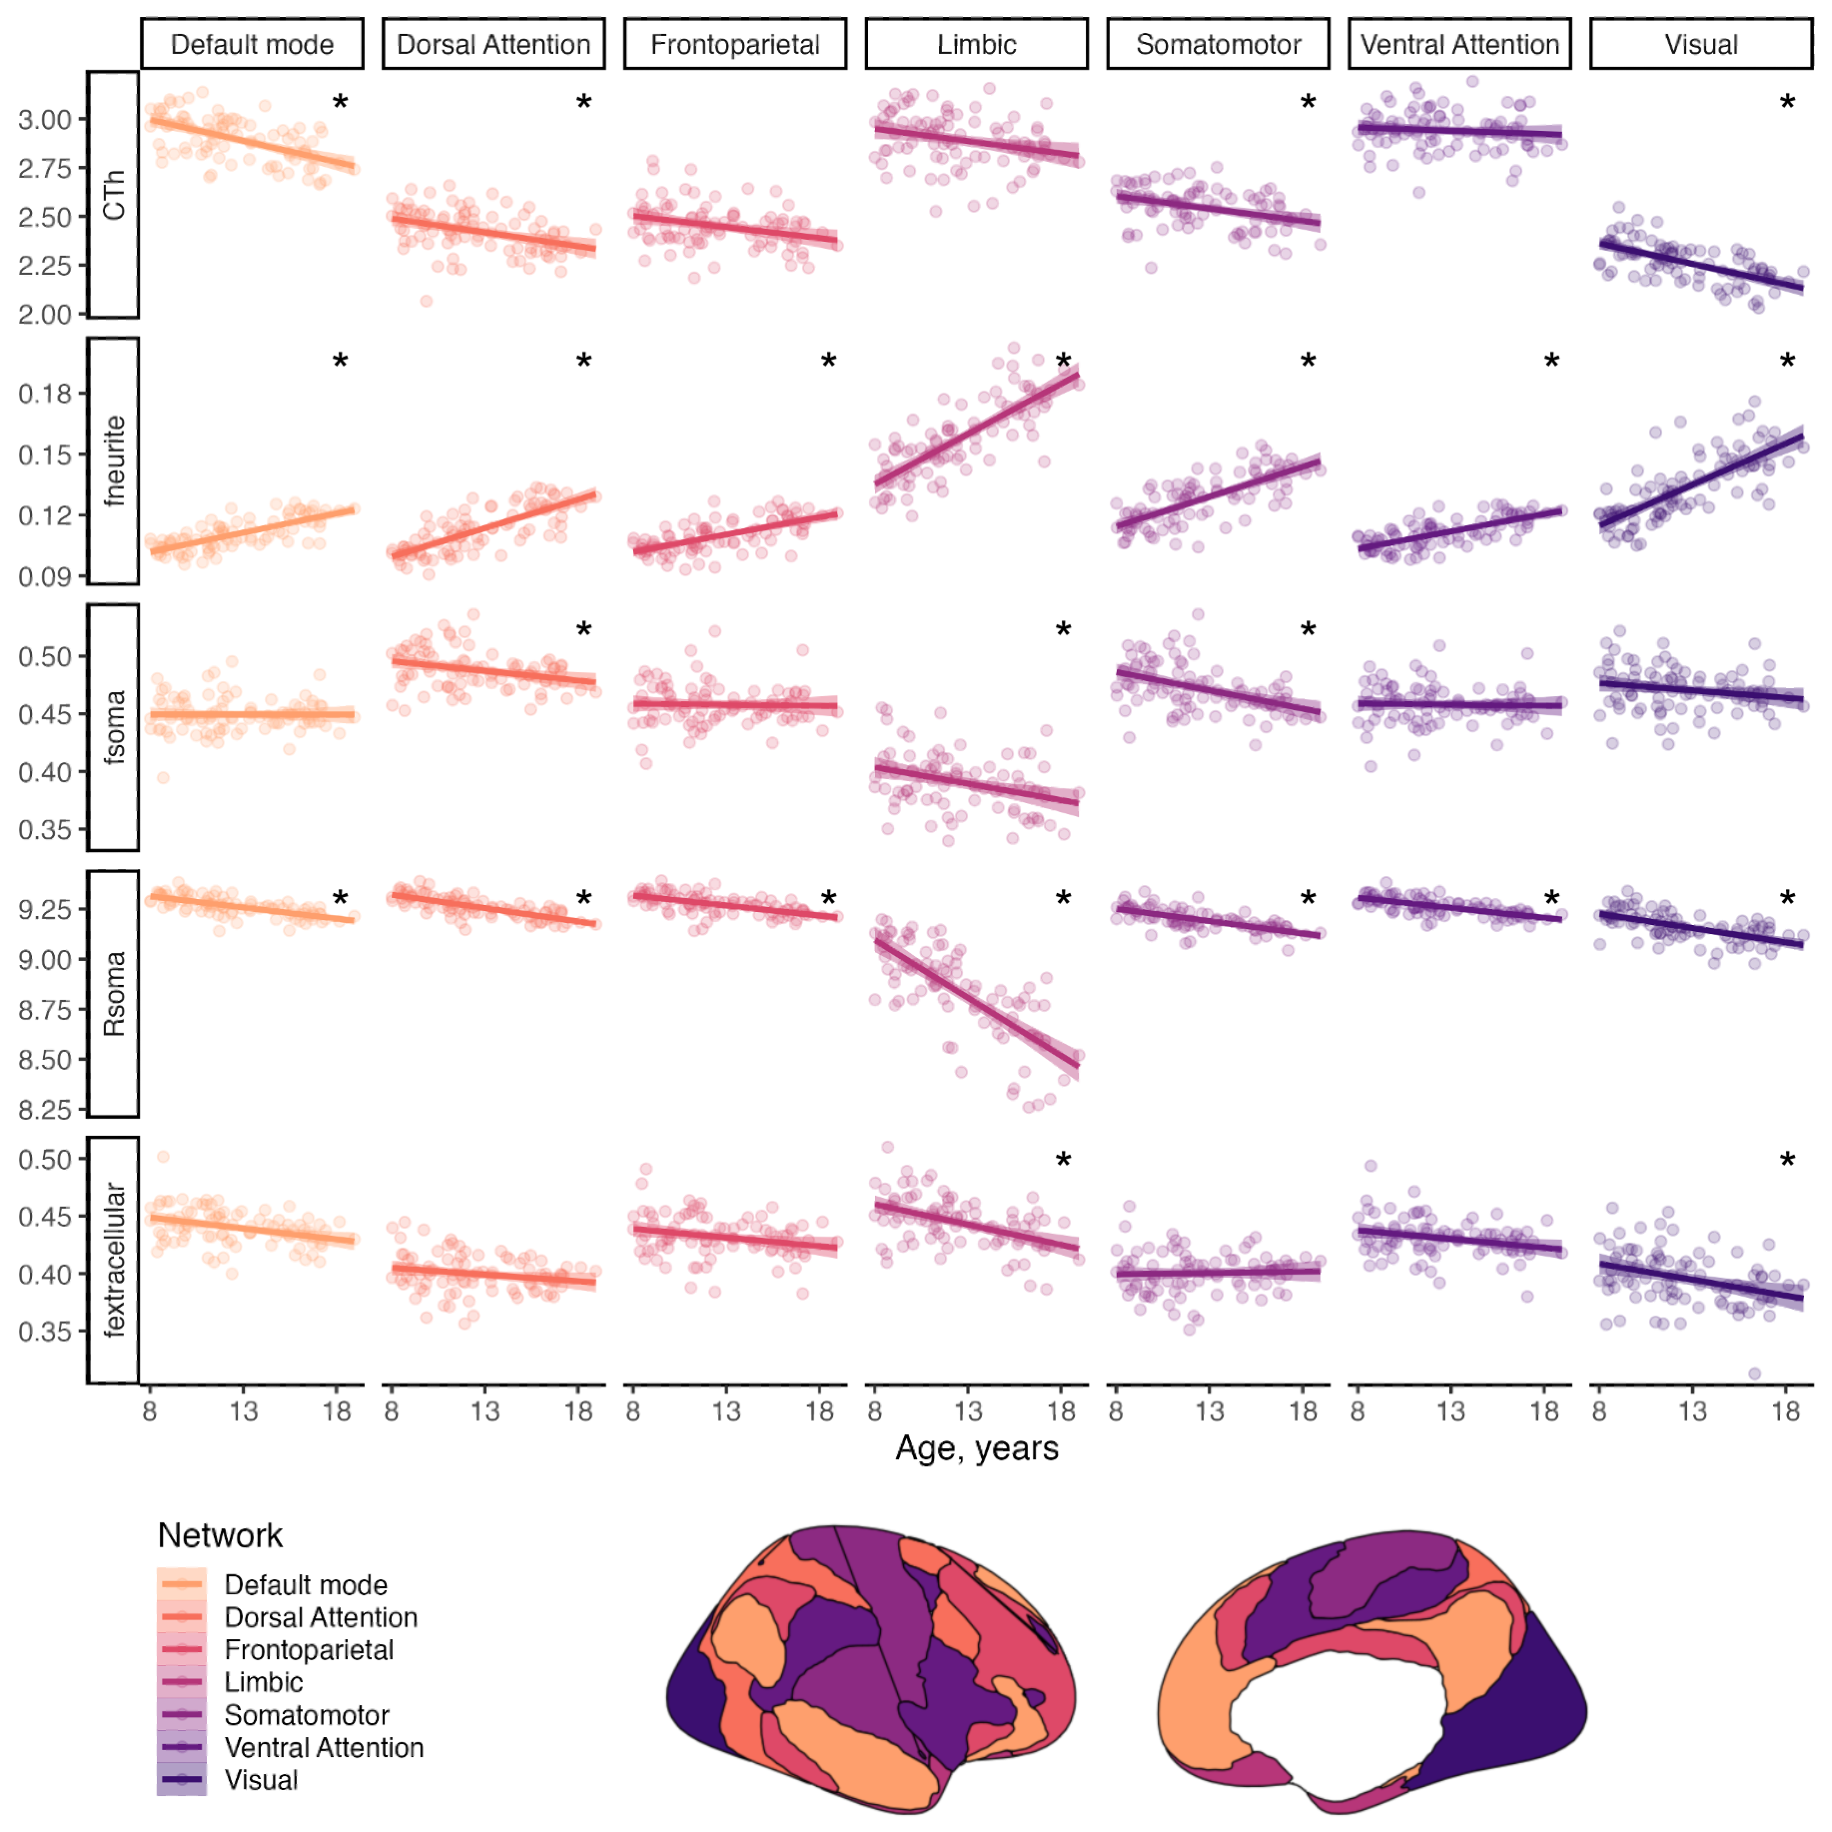
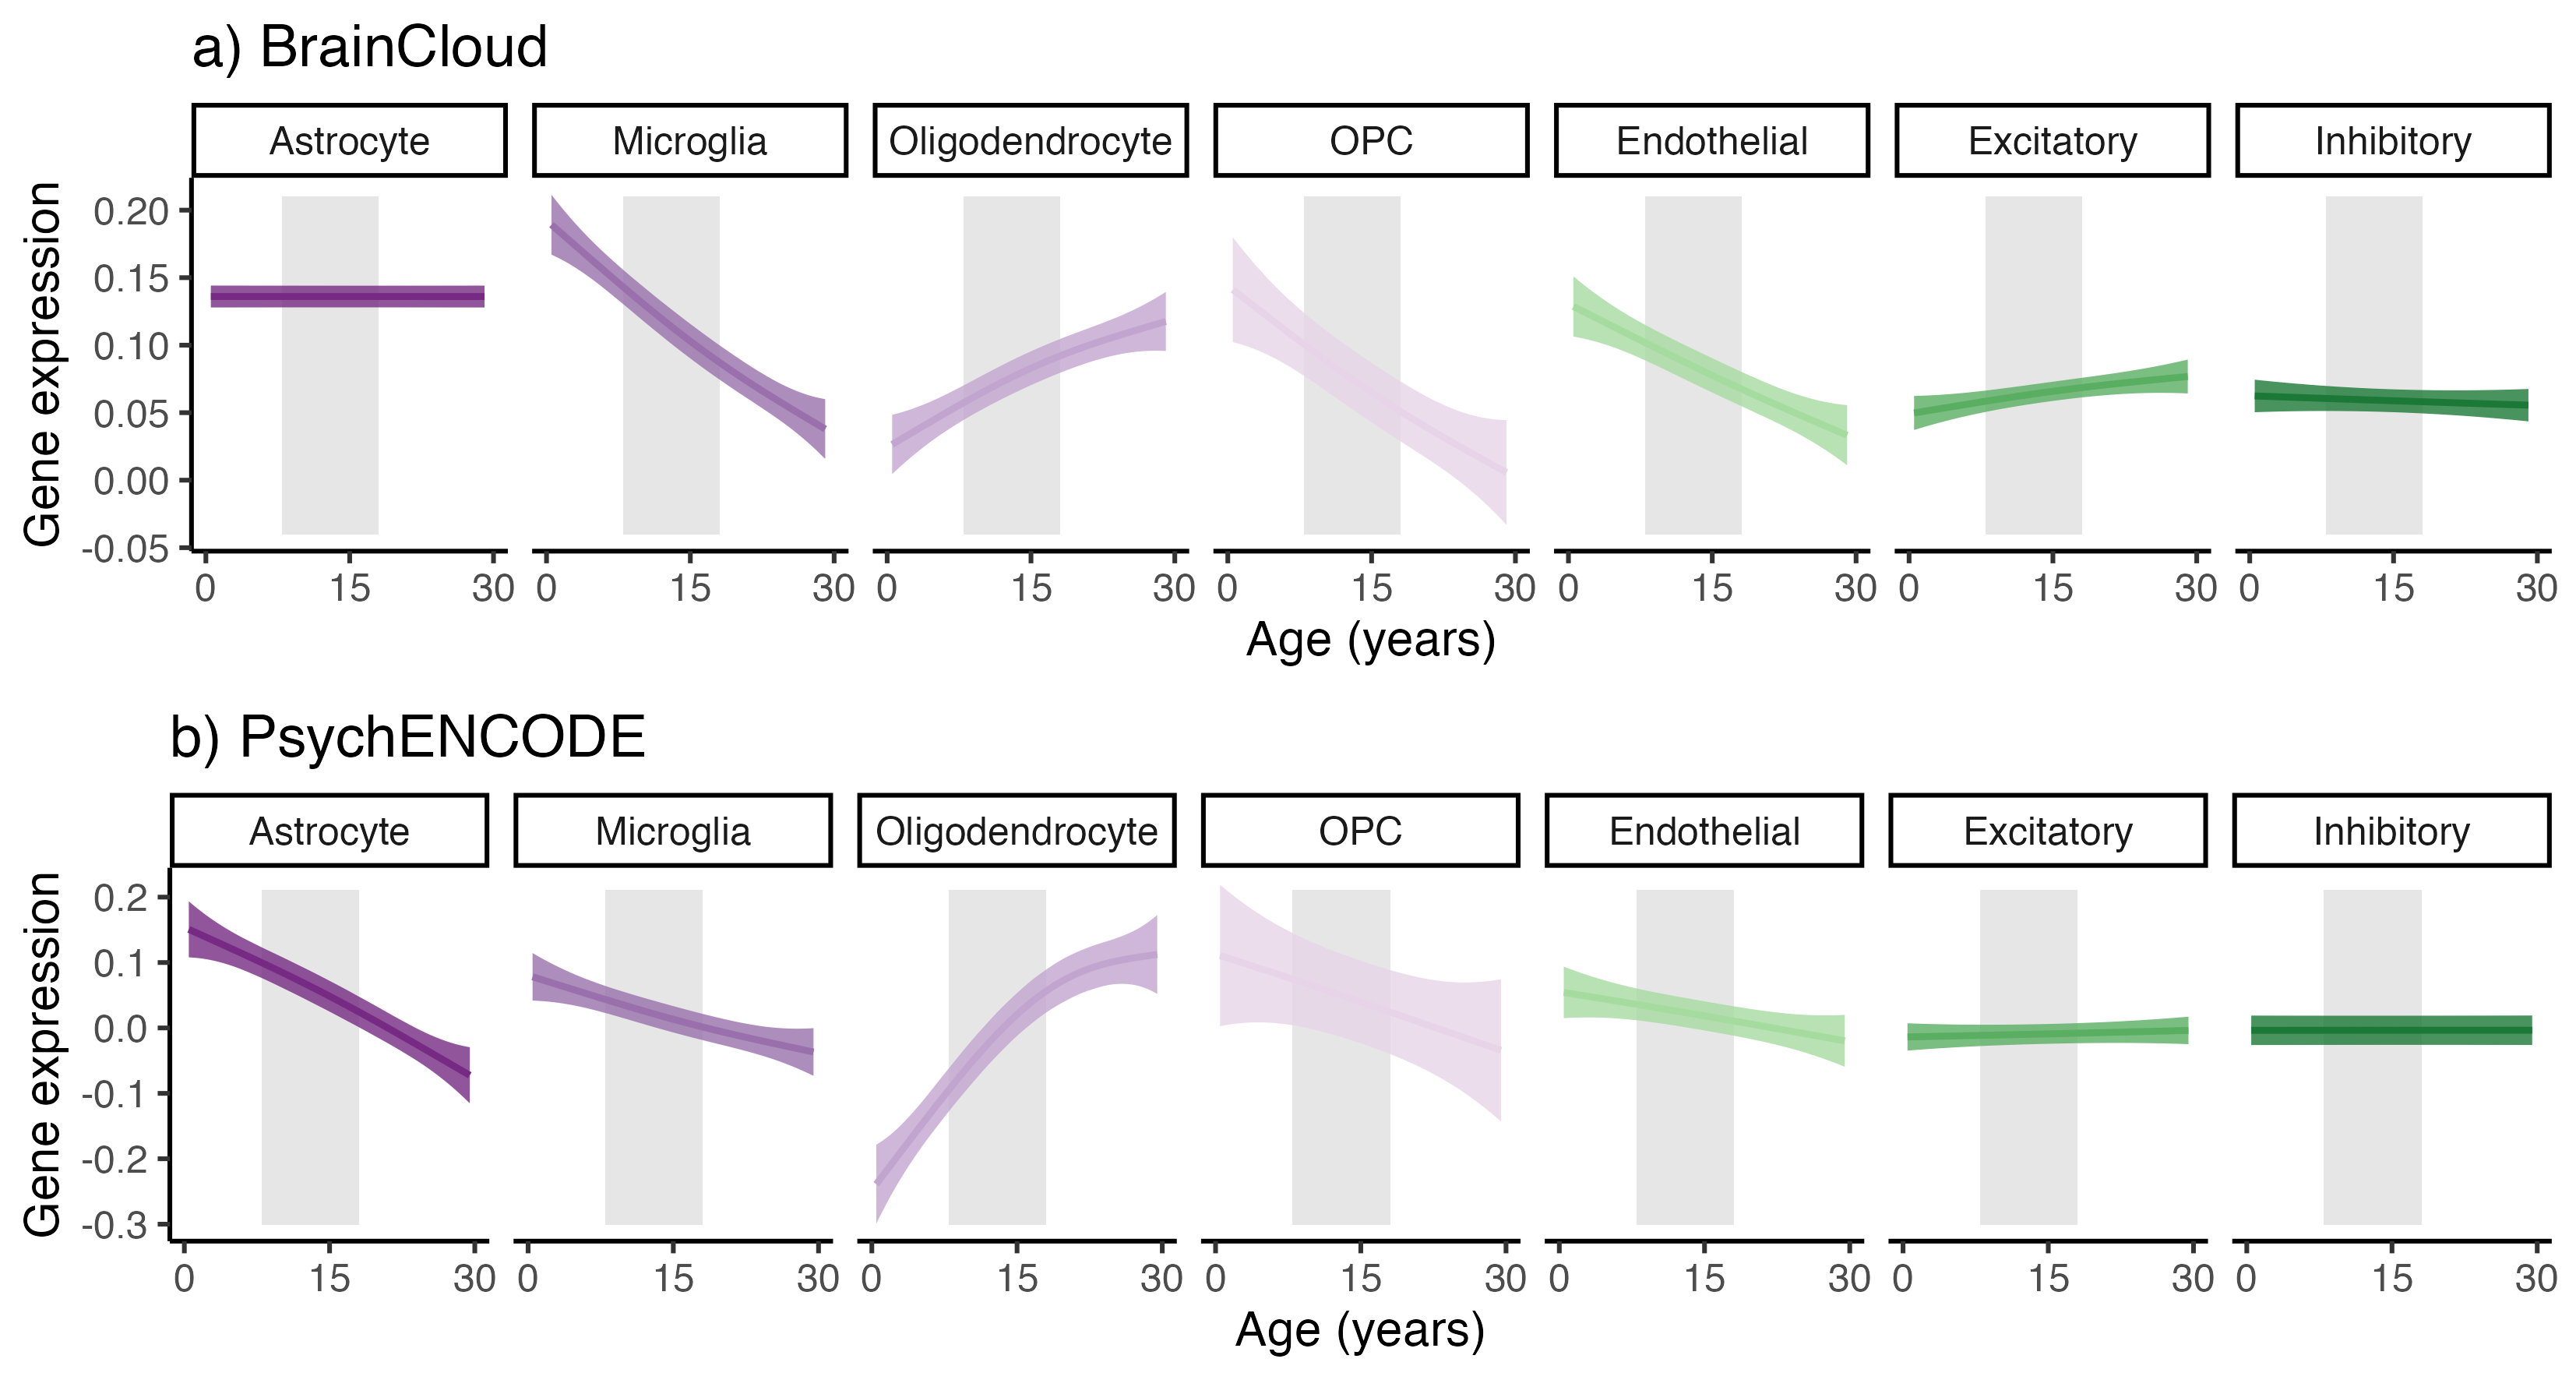
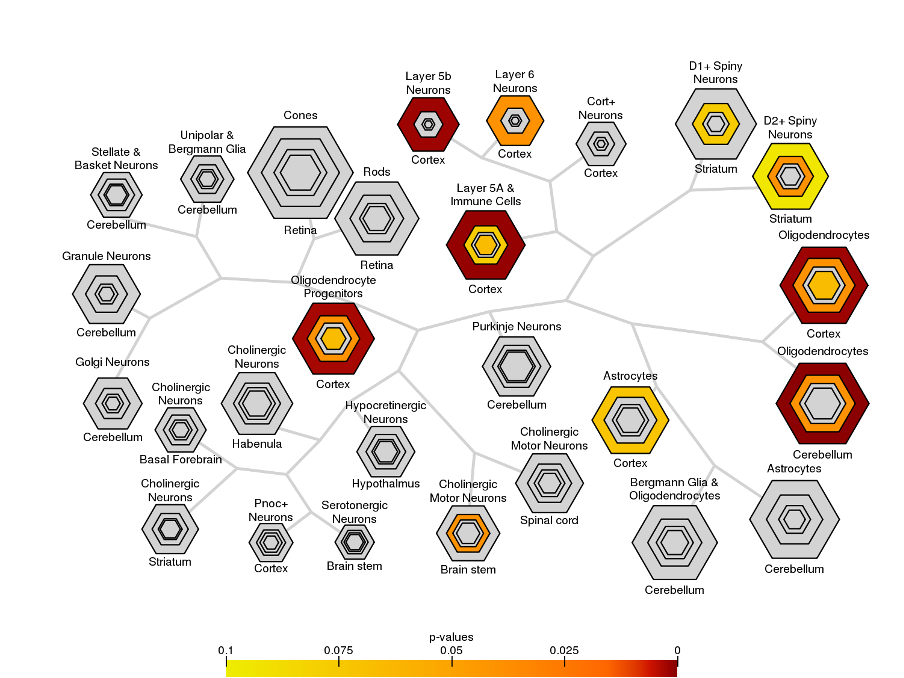
Across late childhood and adolescence, fneurite increased (mean R2=.53), and Rsoma decreased (mean R2=.48) across the whole cortex. With increasing age, we observed lower fsoma for the somatomotor, dorsal attention and limbic networks (mean R2=.19), and lower fextracellular for the visual and limbic networks (mean R2=.16). Overall, developmental patterns of SANDI measures suggest increased neurite density and decreased soma radius with age, with some regional changes to soma density (Fig1).In the BrainCloud dataset, we identified n=2057 genes with differential expression over the lifespan (pFDR<0.05). We validated this selection in an independent RNA-seq dataset (PsychENCODE; n=20), identifying n=467 (22.7%) genes with significant age-associations (p<.05) across both datasets. Oligodendrocyte-expressed genes increased significantly over childhood and adolescence (Fig2). The age-related genes we identified were preferentially expressed in cortical oligodendrocytes, OPCs, and layer 5-6 neurons (Fig3).
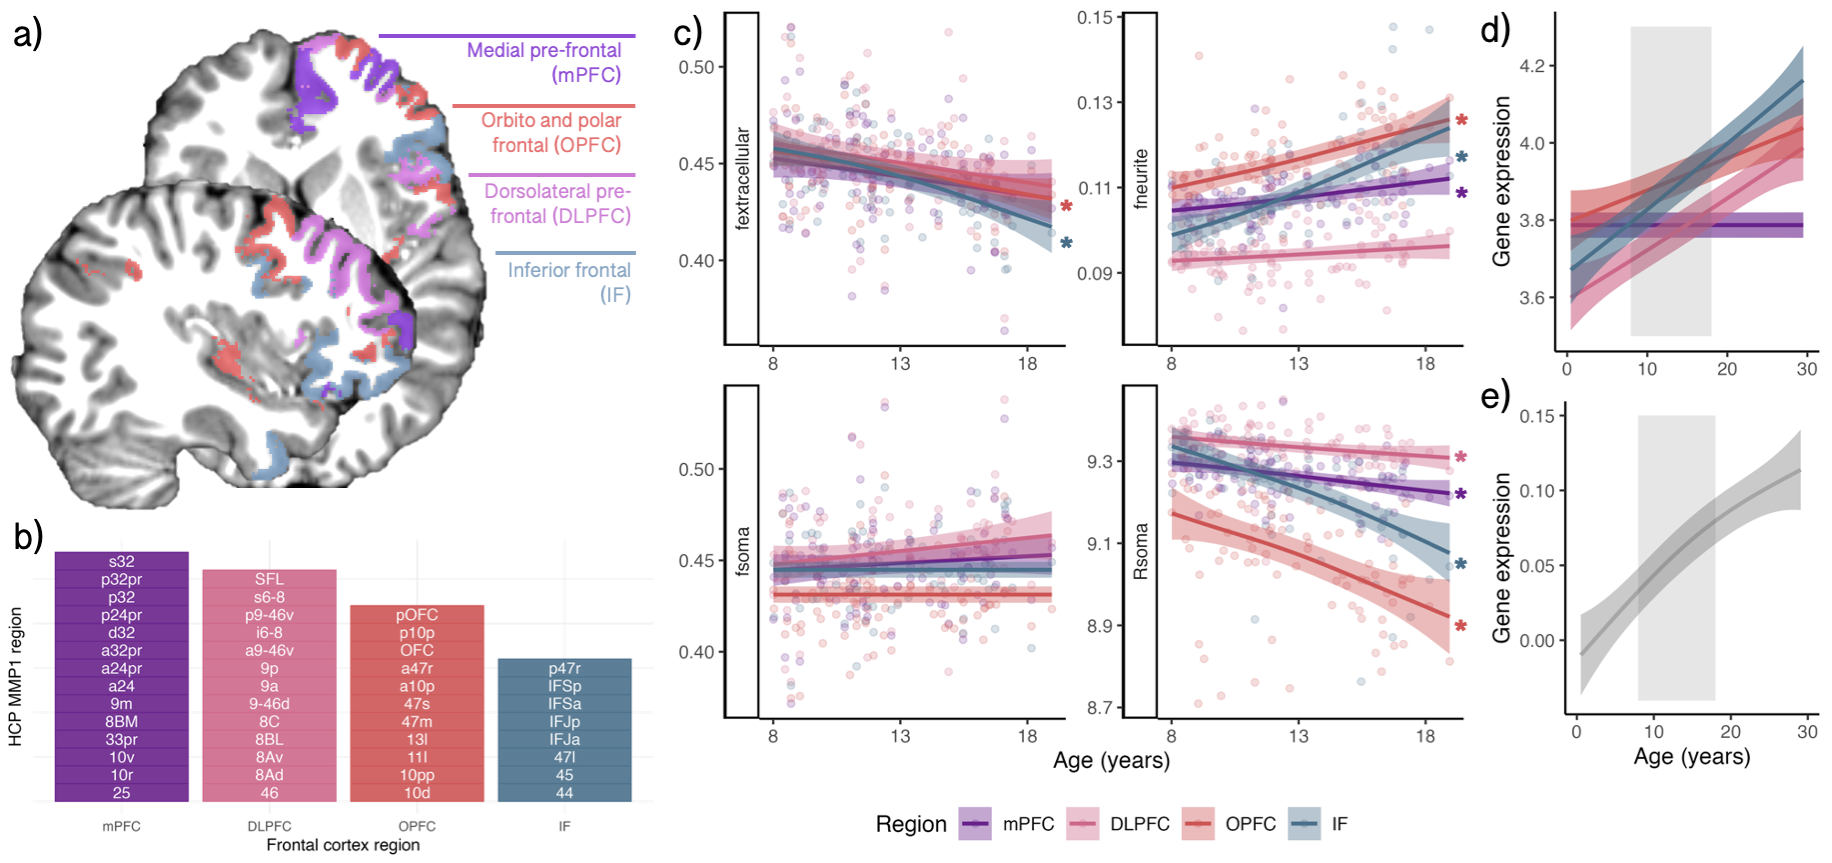
Focusing on the frontal cortex (Fig4a-b), we observed regional variation in age-related patterns of fneurite and Rsoma (Fig4c). This pattern was reflected by regional oligodendrocyte gene expression profiles across the same four frontal regions over the same age period (Fig4d).
Discussion
Our in vivo microstructural imaging findings of increased neurite signal fraction in the cortical grey matter suggest that elongated structures (e.g. axons, spines, dendrites) increase in density with development, likely driven by intracortical myelination21,22. Our analysis into soma architecture revealed that older adolescents had, on average, smaller soma radii, with some networks exhibiting lower soma density with age. As neuronal soma are larger than glial soma23, our observed age-related reductions in soma radius may suggest either preferential neuronal loss, or an increase in the glial/neuronal ratio. Previous ex vivo evidence suggests an increase in the density of cortical oligodendrocytes24, not astrocytes or microglia25, across development. Indeed, our gene expression analysis revealed that across two independent ex vivo datasets, expression of gene transcripts unique to oligodendrocytes increased with age.Together, our findings point to increasing cortical oligodendrocyte density over childhood and adolescence, which supports the model of protracted intra-cortical myelination over the adolescent period26,27.
Acknowledgements
The authors are grateful to the participants and their families for their participation in this study. We would like to thank Umesh Rudrapatna and John Evans for their support with MR acquisition, and Greg Parker for contributions to data preprocessing and model fitting pipelines.References
1. Gogtay N, Giedd JN, Lusk L, Hayashi KM, Greenstein D, Vaituzis AC, et al. Dynamic mapping of human cortical development during childhood through early adulthood. Proc Natl Acad Sci U S A. 2004;101(21):8174-9.2. Giedd JN, Blumenthal J, Jeffries NO, Castellanos FX, Liu H, Zijdenbos A, et al. Brain development during childhood and adolescence: a longitudinal MRI study. Nature neuroscience. 1999;2(10):861-3.
3. Ball G, Srinivasan L, Aljabar P, Counsell SJ, Durighel G, Hajnal JV, et al. Development of cortical microstructure in the preterm human brain. Proceedings of the National Academy of Sciences. 2013;110(23):9541-6.
4. Jones DK, Alexander DC, Bowtell R, Cercignani M, Dell'Acqua F, McHugh DJ, et al. Microstructural imaging of the human brain with a 'super-scanner': 10 key advantages of ultra-strong gradients for diffusion MRI. Neuroimage. 2018;182:8-38.
5. Tax CMW, Szczepankiewicz F, Nilsson M, Jones DK. The dot-compartment revealed? Diffusion MRI with ultra-strong gradients and spherical tensor encoding in the living human brain. Neuroimage. 2020;210:116534.
6. Palombo M, Ianus A, Guerreri M, Nunes D, Alexander DC, Shemesh N, et al. SANDI: A compartment-based model for non-invasive apparent soma and neurite imaging by diffusion MRI. Neuroimage. 2020;215:116835.
7. Genc S, Chamberland M, Koller K, Tax CMW, Zhang H, Palombo M, et al., editors. Repeatability of Soma and Neurite Metrics in Cortical and Subcortical Grey Matter. Computational Diffusion MRI; 2021 2021//; Cham: Springer International Publishing.
8. Yeo BT, Krienen FM, Sepulcre J, Sabuncu MR, Lashkari D, Hollinshead M, et al. The organization of the human cerebral cortex estimated by intrinsic functional connectivity. J Neurophysiol. 2011;106(3):1125-65.
9. Glasser MF, Coalson TS, Robinson EC, Hacker CD, Harwell J, Yacoub E, et al. A multi-modal parcellation of human cerebral cortex. Nature. 2016;536(7615):171-8.
10. Veraart J, Fieremans E, Novikov DS. Diffusion MRI noise mapping using random matrix theory. Magn Reson Med. 2016;76(5):1582-93.
11. Vos SB, Tax CM, Luijten PR, Ourselin S, Leemans A, Froeling M. The importance of correcting for signal drift in diffusion MRI. Magn Reson Med. 2017;77(1):285-99.
12. Andersson JLR, Sotiropoulos SN. An integrated approach to correction for off-resonance effects and subject movement in diffusion MR imaging. Neuroimage. 2016;125:1063-78.
13. Andersson JL, Skare S, Ashburner J. How to correct susceptibility distortions in spin-echo echo-planar images: application to diffusion tensor imaging. Neuroimage. 2003;20(2):870-88.
14. Kellner E, Dhital B, Kiselev VG, Reisert M. Gibbs-ringing artifact removal based on local subvoxel-shifts. Magnetic Resonance in Medicine. 2016;76(5):1574-81.
15. Tustison NJ, Avants BB, Cook PA, Zheng Y, Egan A, Yushkevich PA, et al. N4ITK: improved N3 bias correction. IEEE Trans Med Imaging. 2010;29(6):1310-20.
16. Rudrapatna U, Parker GD, Roberts J, Jones DK. A comparative study of gradient nonlinearity correction strategies for processing diffusion data obtained with ultra-strong gradient MRI scanners. Magn Reson Med. 2021;85(2):1104-13.
17. Colantuoni C, Lipska BK, Ye T, Hyde TM, Tao R, Leek JT, et al. Temporal dynamics and genetic control of transcription in the human prefrontal cortex. Nature. 2011;478(7370):519-23.
18. Li M, Santpere G, Imamura Kawasawa Y, Evgrafov OV, Gulden FO, Pochareddy S, et al. Integrative functional genomic analysis of human brain development and neuropsychiatric risks. Science. 2018;362(6420):eaat7615.
19. Wood SN. Thin plate regression splines. Journal of the Royal Statistical Society Series B: Statistical Methodology. 2003;65(1):95-114.
20. Ball G, Seidlitz J, Beare R, Seal ML. Cortical remodelling in childhood is associated with genes enriched for neurodevelopmental disorders. Neuroimage. 2020;215:116803.
21. Natu VS, Gomez J, Barnett M, Jeska B, Kirilina E, Jaeger C, et al. Apparent thinning of human visual cortex during childhood is associated with myelination. Proceedings of the National Academy of Sciences. 2019;116(41):20750-9.
22. Gibson EM, Purger D, Mount CW, Goldstein AK, Lin GL, Wood LS, et al. Neuronal activity promotes oligodendrogenesis and adaptive myelination in the mammalian brain. Science. 2014;344(6183):1252304.
23. Rajkowska G, Selemon LD, Goldman-Rakic PS. Neuronal and Glial Somal Size in the Prefrontal Cortex: A Postmortem Morphometric Study of Schizophrenia and Huntington Disease. Archives of General Psychiatry. 1998;55(3):215-24.
24. Peters A, Sethares C. Oligodendrocytes, their Progenitors and other Neuroglial Cells in the Aging Primate Cerebral Cortex. Cerebral Cortex. 2004;14(9):995-1007.
25. Robillard KN, Lee KM, Chiu KB, MacLean AG. Glial cell morphological and density changes through the lifespan of rhesus macaques. Brain Behav Immun. 2016;55:60-9.
26. Bartzokis G. Neuroglialpharmacology: Myelination as a shared mechanism of action of psychotropic treatments. Neuropharmacology. 2012;62(7):2137-53.
27. Whitaker KJ, Vértes PE, Romero-Garcia R, Váša F, Moutoussis M, Prabhu G, et al. Adolescence is associated with genomically patterned consolidation of the hubs of the human brain connectome. Proceedings of the National Academy of Sciences. 2016;113(32):9105-10.
28. Xu X, Wells AB, O'Brien DR, Nehorai A, Dougherty JD. Cell type-specific expression analysis to identify putative cellular mechanisms for neurogenetic disorders. J Neurosci. 2014;34(4):1420-31.
Figures