1145
Three-Dimensional Balanced Steady State Free Precession Ultra-short Echo Time MRI for Multiple Contrasts Whole Brain Imaging1Radiology and Biomedical Imaging, University of California, San Francisco, San Francisco, CA, United States, 2Department of Brain and Behavioral Sciences, University of Pavia, Pavia, Italy, 3Neurology, University of California, San Francisco, San Francisco, CA, United States, 4School of Health Science, Purdue University, West Lafayette, IN, United States, 5Weldon School of Biomedical Engineering, Purdue University, West Lafayette, IN, United States
Synopsis
Keywords: Pulse Sequence Design, Pulse Sequence Design
Motivation: Typical ultra-short echo time (UTE) sequences lack of meaningful contrast for long T2 components, and lack of straightforward method to derive images with only ultra-short T2 (uT2) components.
Goal(s): To develop a novel high-resolution fast UTE MRI sequence, potentially for myelin imaging.
Approach: The sequence was developed based on combining balanced steady-state free precession (bSSFP) and UTE techniques, together with a 3D rosette dual-echo k-space trajectory.
Results: The sequence provides PD contrast in both echo times (TEs) and enables easy separation of uT2 components by subtraction between two TEs, which is sensitive to MS patients’ lesions.
Impact: The fast and high-resolution (0.94 mm isotropic resolution under three minutes) dual-echo bSSFP UTE sequence provides both structural information (PD contrast) and uT2 components imaging for myelin quantification (by subtraction). It has great potential aiding diagnosis of multiple sclerosis patients.
Introduction
Ultra-short echo time (UTE) sequences can provide images of fast decaying protons. An important application is the imaging of ultra-short transverse relaxation times (uT2) components in whole brain, e.g., myelin bilayer. Loss or damage of myelin is implicated in neurological disorders, including the neurodegenerative disease of multiple sclerosis (MS) (6).The reconstructed images from UTE sequences typically have gradient echo (GRE) like contrast because of unbalanced readout gradients. The combination of UTE techniques and balanced readout gradients results in balanced steady-state free precession (bSSFP) contrast for components whose T2 is longer than the repetition time (TR) (7), while capturing uT2 signals with GRE-like contrast.
This study aims to develop a novel bSSFP UTE sequence with a 3D rosette k-space pattern (8), to sample dual-echo data in a single acquisition. As the uT2 signals were only captured in the first echo data with an ultra-short TE, the subtraction between two TEs has the potential to derive selective images of uT2 components.
Methods
The steady-state magnetization (Mss) immediately after the radiofrequency (RF) pulses is defined by the following equation (7) (only considering passband):Mss=M0*(1-e-TR/T1)sinα/(1-e-TR/T1cosα+e-TR/T2cosα-e-TR/T1*e-TR/T2)
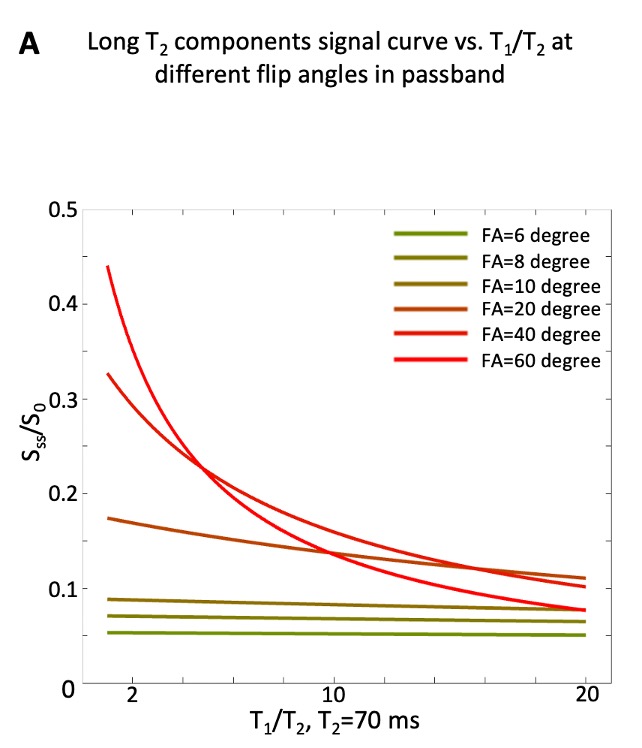
where α is the flip angle, M0 is the equilibrium magnetization. If the flip angle is small (i.e., <10 degrees), the contrast of is proton density weighted (M0) (Figure 1) (9).
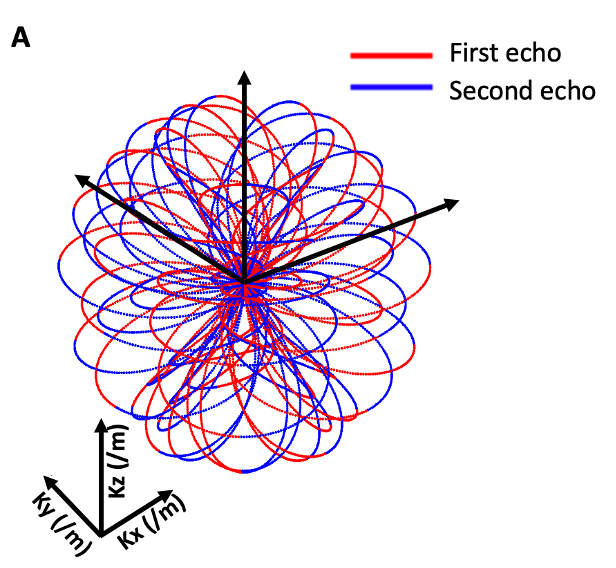
An illustration of the 3D rosette k-space pattern is shown in Figure 2, which is defined by the following equations (8):
kxy(t)=kx(t)+iky(t)=kmax*cosφ*sin(ω1t)*eiω2t+β
kz(t)=kmax*sinφ*sin(ω1t)
where kmax is the maximum extent of k-space, ω1 is the frequency of oscillation in the radial direction, ω2 is the frequency of rotation in the angular direction, φ determines the location in the z-axis, and β determines the initial phase in the angular direction. The parameters used in this study were: ω1=ω2=1611 rad/s, kmax=500/m, samples per petal=432, φ was sampled uniformly in the range of [-π/2, π/2], and β was sampled uniformly in the range of [0,2π].
Simulations were performed to predict the expected contrast from the bSSFP UTE sequence, with the T1 and T2 values based on review papers (10,11). Six healthy volunteers and eight MS patients underwent brain scans with a whole-body 3T MRI system (Skyra, Siemens, Erlangen, Germany). The parameters used in the 3D bSSFP rosette UTE sequence were: field of view (FOV)= 240x240x240 mm3, matrix size= 256x256x256, readout dwell time=5 µs, flip angle= 6-degree, TE1=40, 100, 200, 400, 600 µs, TE2=2.2, 2.26, 2.36, 2.56, 2.76ms, TR=2.4 or 3 ms, readout duration=2.16 ms, and RF pulse duration=10 µs.
Image reconstruction and post-processing steps were performed in MATLAB (MathWorks, USA). The nonuniform fast Fourier transform (NUFFT) was used to calculate the forward encoding transform of the acquired k-space data (30). A regular gridding method applying a density compensated adjoint NUFFT was used for image reconstruction. Subtraction images between two echoes (TE1-TE2) were computed to show primarily uT2 component signals selectively.
Results
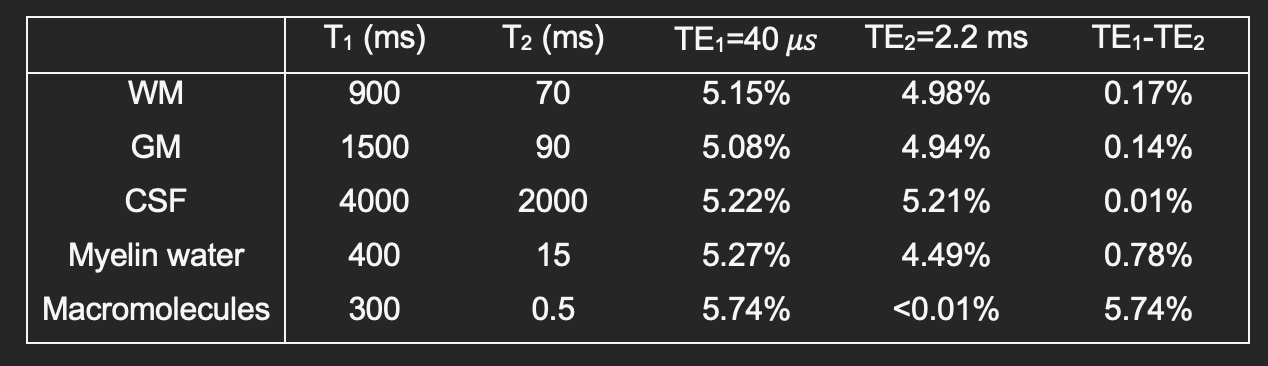
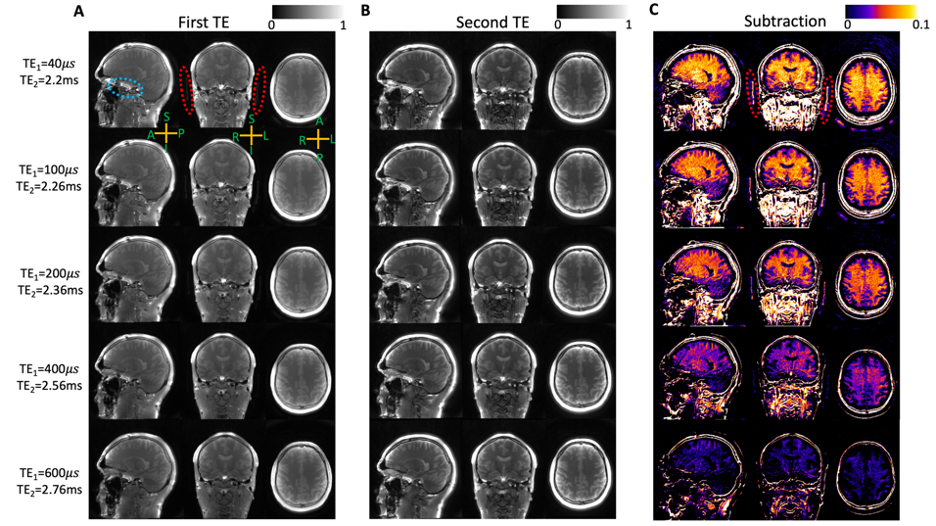
The simulation results of signal intensity and the decay rate were summarized in Figure 3. Except for the macromolecules, which are fully decayed (<0.01%), other tissue components almost remain at 5% of M0 at TE2.Figure 4 shows the reconstructed images from a healthy volunteer, scanned by the bSSFP UTE sequence with an extended TR and various TEs to investigate the signal decay. A typical PD contrast was found in the second TE images (Figure 3B) with precise segmentation among brain tissues. The subtraction images (Figure 3C) showed higher signal intensity in WM than in GM and in CSF. Although the intervals between two TEs remain the same (TE1-TE2=2.16 ms) for all subtraction images, the signal intensity drops as the first TEs are longer.
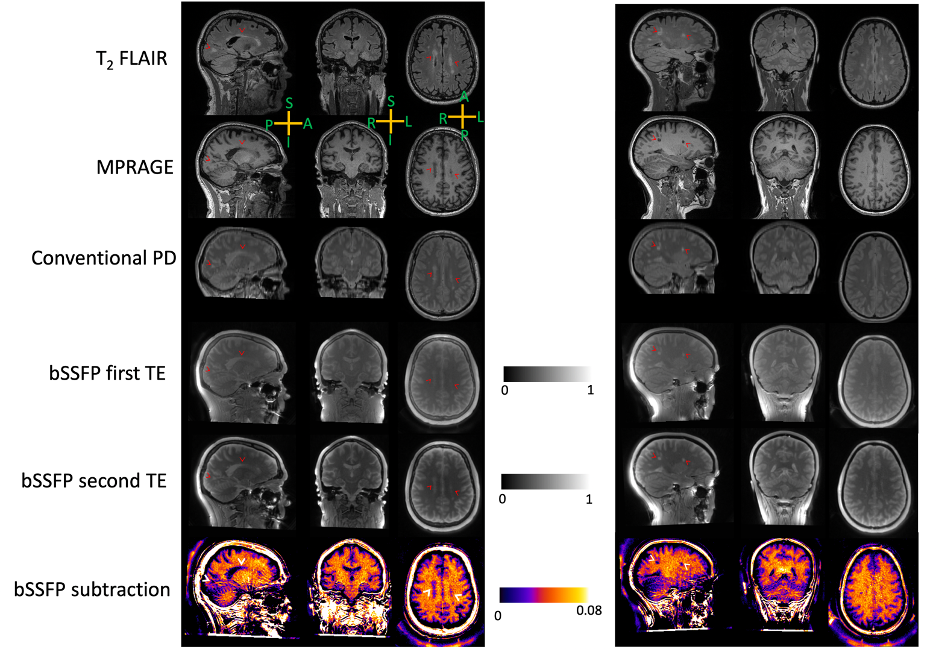
Figure 5 presents two MS patients’ images from multiple MRI sequences. The lesions (red arrows in most images, only white arrows in bSSFP subtraction images) showed hyperintense signals compared to normal WM in T2 FLAIR, conventional PD, and both TEs in bSSFP UTE techniques. However, lesion-related hypointense signals were shown in MPRAGE and subtraction results between two bSSFP TEs.
Discussion and Conclusion
In summary, we demonstrated a novel MRI sequence for extracting uT2 components, by combining low flip angle bSSFP and UTE techniques, together with a 3D rosette dual-echo k-space trajectory. The features of this sequence include: 1) providing high spatial resolution with relatively short scan time; 2) generating PD contrast in both TEs, while only capturing uT2 signals in the first TE; 3) easily separating uT2 components by subtraction between two TEs. In addition, the subtraction uT2 images demonstrated sensitivity to MS patients’ lesions compared to normal-appearing WM (i.e., myelin).Acknowledgements
This work was supported by US Department of Defense Multiple Sclerosis Research Program Grant #MS200272.References
1. Seifert AC, Li C, Wilhelm MJ, Wehrli SL, Wehrli FW. Towards quantification of myelin by solid-state MRI of the lipid matrix protons. Neuroimage 2017;163:358-367.
2. Jerban S, Ma Y, Wong JH, Nazaran A, Searleman A, Wan L, Williams J, Du J, Chang EY. Ultrashort echo time magnetic resonance imaging (UTE-MRI) of cortical bone correlates well with histomorphometric assessment of bone microstructure. Bone 2019;123:8-17.
3. Mulkern R, Haker S, Mamata H, Lee E, Mitsouras D, Oshio K, Balasubramanian M, Hatabu H. Lung Parenchymal Signal Intensity in MRI: A Technical Review with Educational Aspirations Regarding Reversible Versus Irreversible Transverse Relaxation Effects in Common Pulse Sequences. Concepts Magn Reson Part A Bridg Educ Res 2014;43A(2):29-53.
4. Robson MD, Benjamin M, Gishen P, Bydder GM. Magnetic resonance imaging of the Achilles tendon using ultrashort TE (UTE) pulse sequences. Clin Radiol 2004;59(8):727-735.
5. Fukuda T, Wengler K, Tank D, Korbin S, Paci JM, Komatsu DE, Paulus M, Huang M, Gould E, Schweitzer ME, He X. Abbreviated quantitative UTE imaging in anterior cruciate ligament reconstruction. BMC Musculoskelet Disord 2019;20(1):426.
6. Love S. Demyelinating diseases. J Clin Pathol 2006;59(11):1151-1159.
7. Bieri O, Scheffler K. Fundamentals of balanced steady state free precession MRI. J Magn Reson Imaging 2013;38(1):2-11.
8. Shen X, Ozen AC, Sunjar A, Ilbey S, Sawiak S, Shi R, Chiew M, Emir U. Ultra-short T(2) components imaging of the whole brain using 3D dual-echo UTE MRI with rosette k-space pattern. Magn Reson Med 2023;89(2):508-521.
9. Sekihara K. Steady-state magnetizations in rapid NMR imaging using small flip angles and short repetition intervals. IEEE Trans Med Imaging 1987;6(2):157-164.
10. Lee J, Hyun JW, Lee J, Choi EJ, Shin HG, Min K, Nam Y, Kim HJ, Oh SH. So You Want to Image Myelin Using MRI: An Overview and Practical Guide for Myelin Water Imaging. J Magn Reson Imaging 2021;53(2):360-373.
11. Bojorquez JZ, Bricq S, Acquitter C, Brunotte F, Walker PM, Lalande A. What are normal relaxation times of tissues at 3 T? Magn Reson Imaging 2017;35:69-80.
Figures