1138
Unsupervised deep learning for denoising diffusion-weighted images with noise-correction loss functions1Southern Medical University, Guangzhou, China, 2JancsiLab, JancsiTech, HongKong, China
Synopsis
Keywords: DWI/DTI/DKI, Brain, denoise
Motivation: Since the noisy magnitude MR data generally follows Rician distribution, using the noisy images and network’s output to construct unsupervised learning’s loss function for denoising will lead to a biased estimation, especially for DW images which suffers from the lower SNR.
Goal(s): To address the noise bias issue.
Approach: We proposed two noise-correction loss functions for unsupervised denoising of DW images, based on DIP and the characteristics of Rician distribution.
Results: The experimental results on simulated and in-vivo data demonstrated that the proposed loss functions effectively corrected the signal-dependent noise bias and improved the accuracy of unsupervised learning-based DW images denoising method.
Impact: Firstly, we proposed two noise-correction loss functions and validate their effectiveness in denoising DW images. Secondly, the proposed loss functions are not limited to DW images and can be directly applied to other modality MR images.
Introduction
Diffusion Magnetic Resonance Imaging (dMRI) can reflect the microscopic tissue structures by non-invasively probing the water molecules’ diffusion movement. Nowadays, it plays a pivotal role in the clinical diagnosis and neuroscience. However, diffusion-weighted (DW) images suffer from low signal-to-noise ratio (SNR), which degrades the reliability of subsequent quantitative analysis (e.g. diffusion tensor imaging, DTI1). Remarkably, several unsupervised learning methods3,4 for denoising DW images have emerged recently, significantly improving the SNR of DW images. Nevertheless, these researches mainly focus on how to design task-aware networks or train in an unsupervised manner, without consideration of characteristics in noisy dMRI data, which only uses the difference between the noisy images and the output as the loss function.This will result in biased estimation in denoised DW images due to the expectation of noisy dMRI data is not equal to the noise-free. To obtain optimal estimation, we constructed two noise-correction loss functions based on Deep Image Prior2 (DIP) and the characteristics of Rician distribution.Theory and Methods
Multi-channel Deep image prior (MDIP)Based on DIP, we adopted the multi-channel network to utilize the correlation of different diffusion directions to denoise noisy dMRI data. The loss function is defined as
$$L=\|\textit{Y}-f_{\theta}(\mathbf{\textit{Z}})\|^{2} \tag{1}$$
where $$$Y\epsilon\mathbb{R}^{\mathrm{m\times n\times h\times g}}$$$ is the noisy dMRI data, m×n×h represents the data size, and g is the number of directions, $$$\textit{Z}\epsilon\mathbb{R}^{\mathrm{m\times n\times h\times g}}$$$ is the random noise, $$$f_{\theta}$$$ is the network with learnable parameters $$${\theta}$$$.
Since the noisy dMRI data follows Rician distribution, leading to the expectation of noisy dMRI data is deviate from the noise-free data. In such case, using the loss function of eq. (1) will lead to a biased result.
M1-W Loss
To achieve unbiased estimation, we utilized the first-moment8 of noisy dMRI data under the Rician distribution to construct the loss function
$$L=\|\mathbf{\textit{Y}}-\mathrm{h}(f_{\theta}(\mathbf{\textit{Z}}),\sigma)\|^{2} \tag{2}$$
where $$$\mathrm{h}(\textit{X},\sigma)$$$ is the first-moment, which is characterized as
$$\mathrm{h}(\textit{X},\sigma)=\frac1{2\sigma^2}\left(\exp\left(-\frac{\textit{X}^2}{4\sigma^2}\right)\sqrt{\frac\pi2}\sigma\left[(\textit{X}^2+2\sigma^2)I_0\left(\frac{\textit{X}^2}{4\sigma^2}\right)+\textit{X}^2I_1\left(\frac{\textit{X}^2}{4\sigma^2}\right)\right]\right) \tag{3}$$
where $$${\textit{X}}$$$ is noisy-free dMRI data, σ is standard deviation (SD) of Gaussian noise, $$$I_{0}$$$ and $$$I_{1}$$$ are the zeroth- and first- order Modified Bessel functions, respectively. In brief, eq. (2) is referred to as M1 loss. Theoretically, the expectations between $$${\textit{Y}}$$$ and $$$\mathrm{h}(\textit{X},\sigma)$$$ are equal.
Although $$$f_{\hat{\theta}}(\textit{Z})$$$ obtained from M1 loss is unbiased, the signal-dependent variance generated by noise fluctuations affects its accuracy. To achieve optimal estimation, we utilized the weight that equal to the variance of the error in M1 to correct the variance heterogeneity. The weight is defined as
$$W_1(\mathbf{\textit{X}},\mathbf{\sigma})=\mathbf{\sigma}\sqrt{2+\frac{\mathbf{\textit{X}}^2}{\sigma^2}-\frac{\pi}{8}\exp\left(-\frac{\mathbf{\textit{X}}^2}{\sigma^2}\right)\left[\left(2+\frac{\mathbf{\textit{X}}^2}{\sigma^2}\right)I_0\left(\frac{\mathbf{\textit{X}}^2}{4\sigma^2}\right)+\frac{\mathbf{\textit{X}}^2}{\sigma^2}I_1\left(\frac{\mathbf{\textit{X}}^2}{4\sigma^2}\right)\right]^2} \tag{4}$$
The loss function of M1-W as follows
$$L=\left\|\frac{\boldsymbol{\textit{Y}}-\mathrm{h}(f_{\boldsymbol{\theta}}(\mathbf{\textit{Z}}),\mathbf{\sigma})}{W_1(f_{\boldsymbol{\theta}}(\mathbf{\textit{Z}}),\mathbf{\sigma})}\right\|^2 \tag{5}$$
M2-W Loss
Similar to M1-W, we proposed M2-W loss with the second-moment8 of noisy dMRI data for bias correction and the weight for variance correction
$$L=\left\|\frac{\textit{Y}^2-2\sigma^2-f_{\theta}^2(\mathbf{\textit{Z}})}{2\sigma\sqrt{f_\theta^2(\mathbf{\textit{Z}})+\sigma^2}}\right\|^2 \tag{6}$$
To validate the effectiveness of weighting term of eq. (6), we also construct the M2 loss without variance correction as
$$L=\left\|\mathbf{\textit{Y}}^{2}-2\sigma^{2}-f_{\theta}^{2}(\mathbf{\textit{Z}})\right\|^{2} \tag{7}$$
Network Architecture
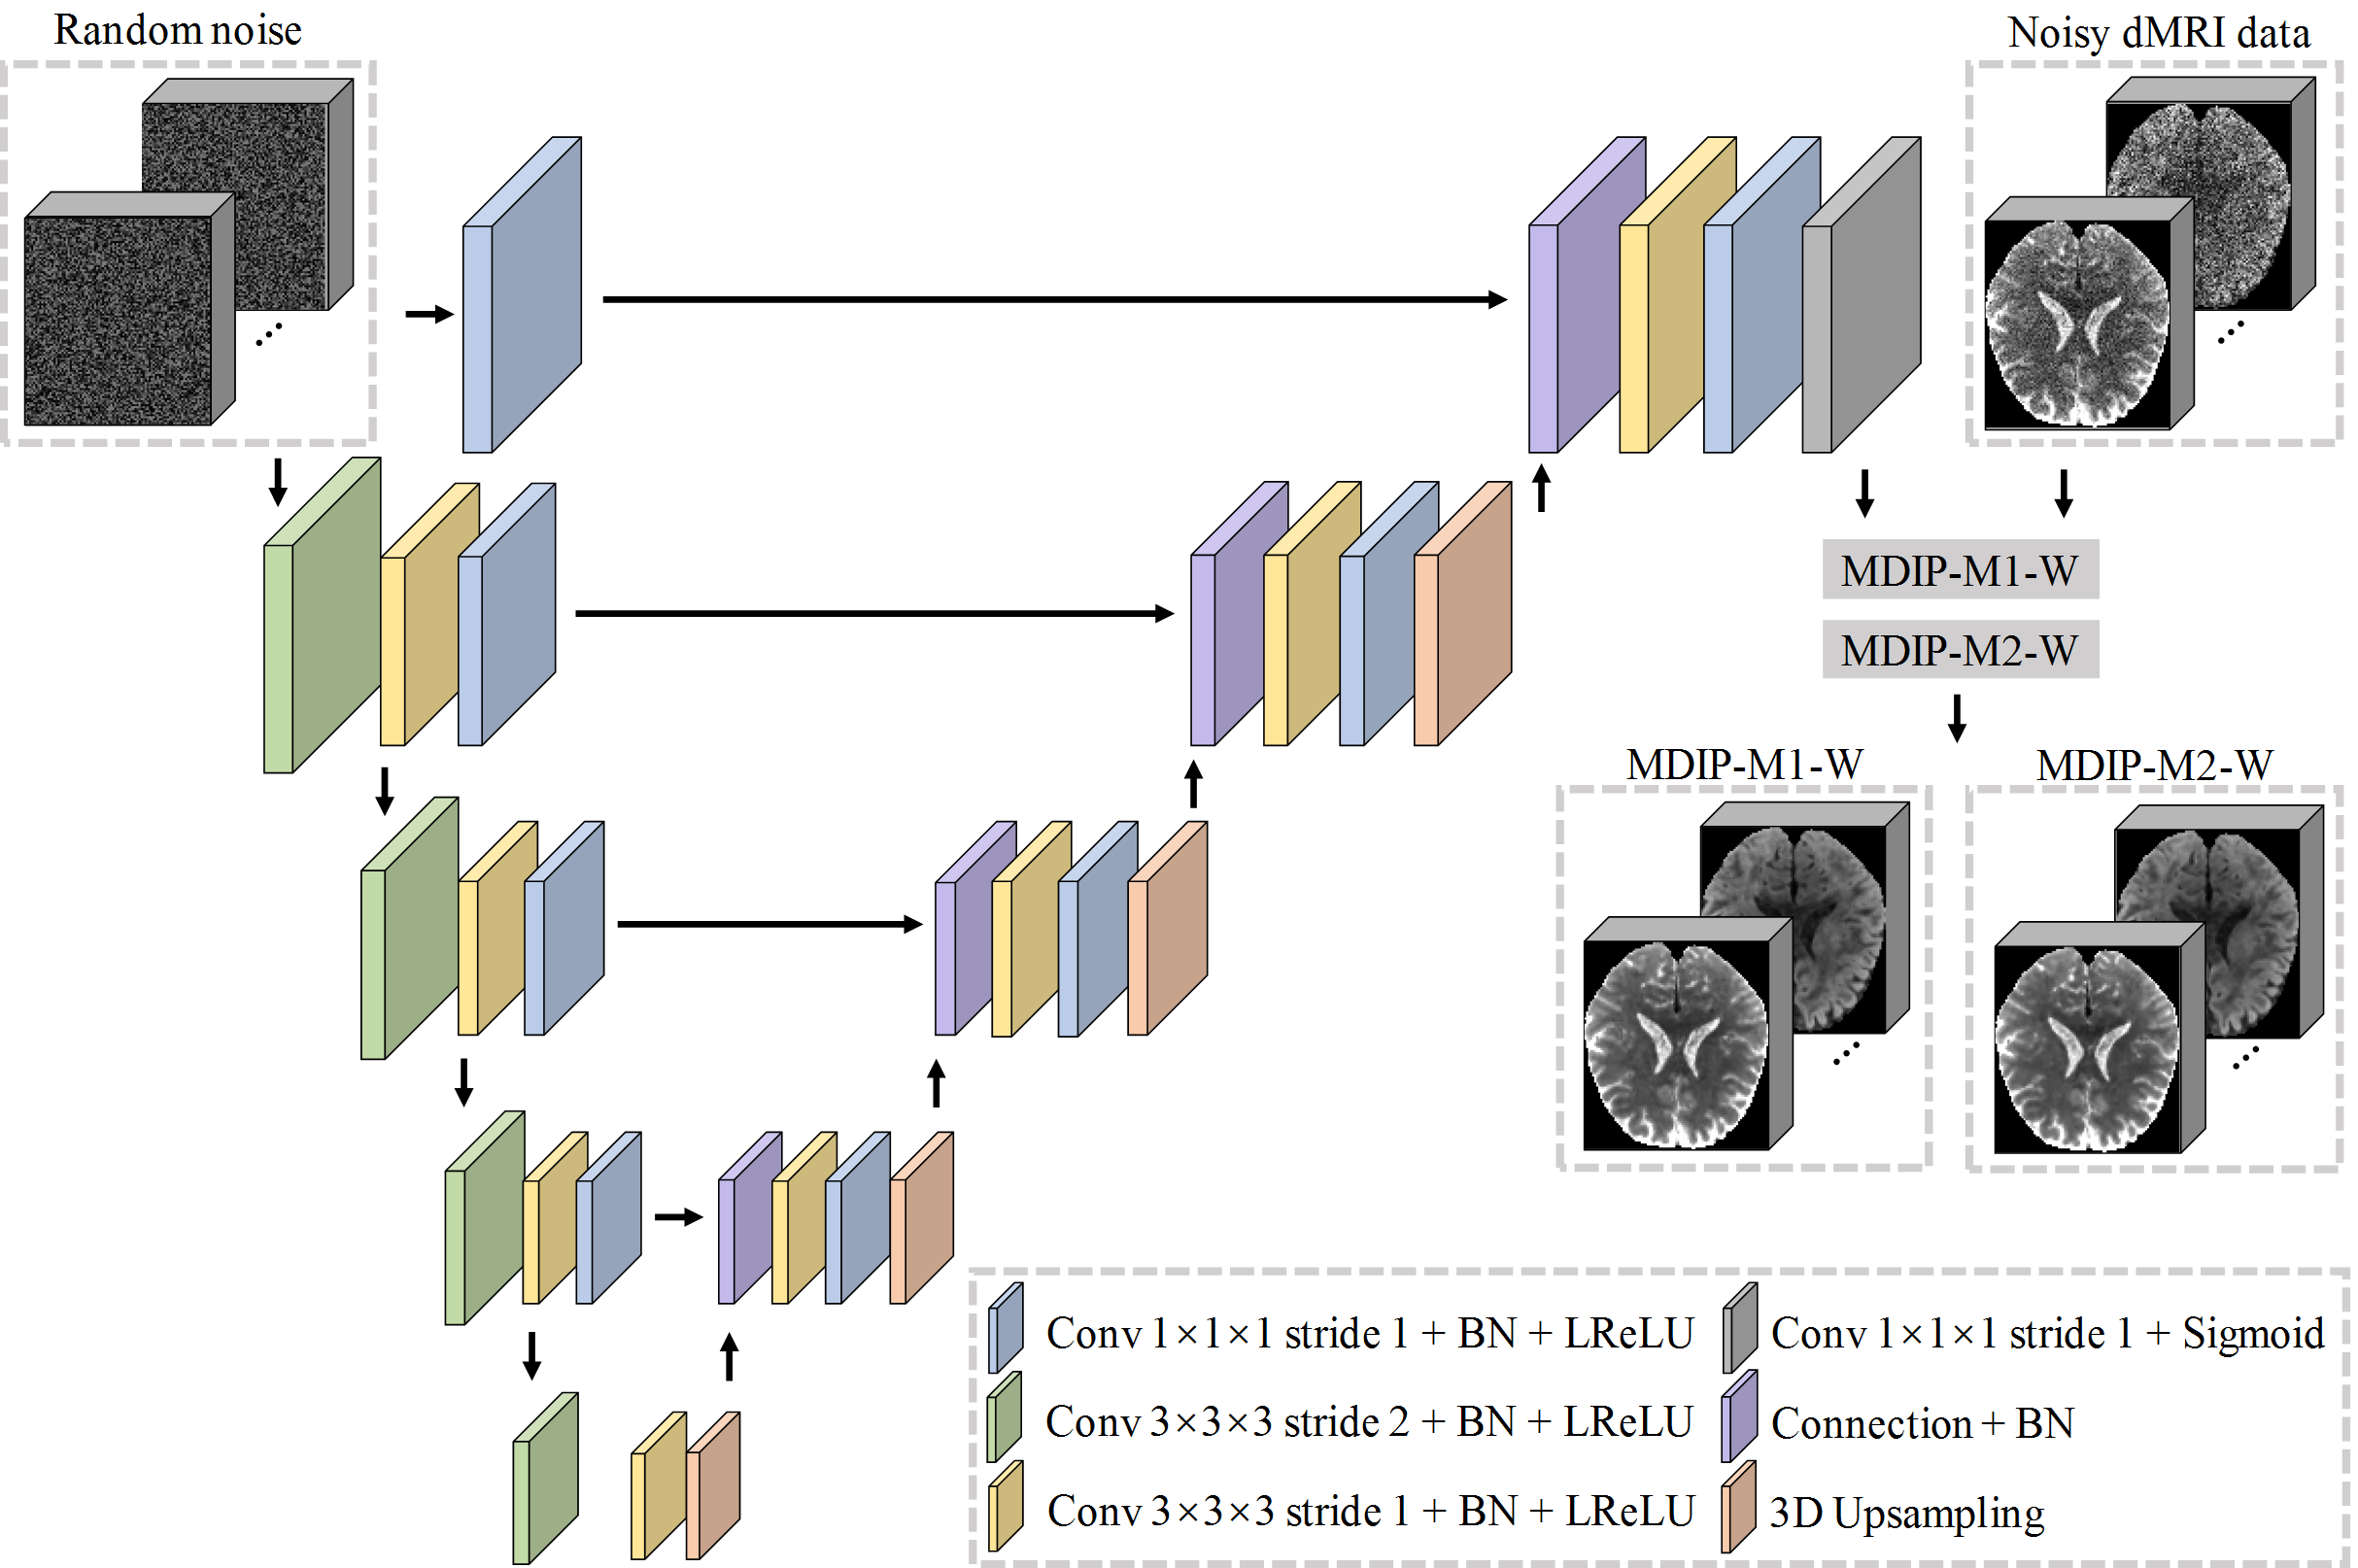
The network we used is a 3D U-net9 (Fig.1). It consist of convolution layers, downsampling layers, upsampling layers and skip connection layers. We take random noise as the network’s input and noisy dMRI data as the target to realize the denoise process.
Datasets
Simulated data: The simulated data is from HCP10, with one b=0 and 32 b=1000 s/mm2 volumes. Its resolution is 1.5×1.5×1.5 mm3.
In-vivo data: The in-vivo data is from our internal datasets, with one b=0 and 12 b=800 s/mm2 volumes. Its resolution is 0.875×0.875×0.9 mm3.
Results
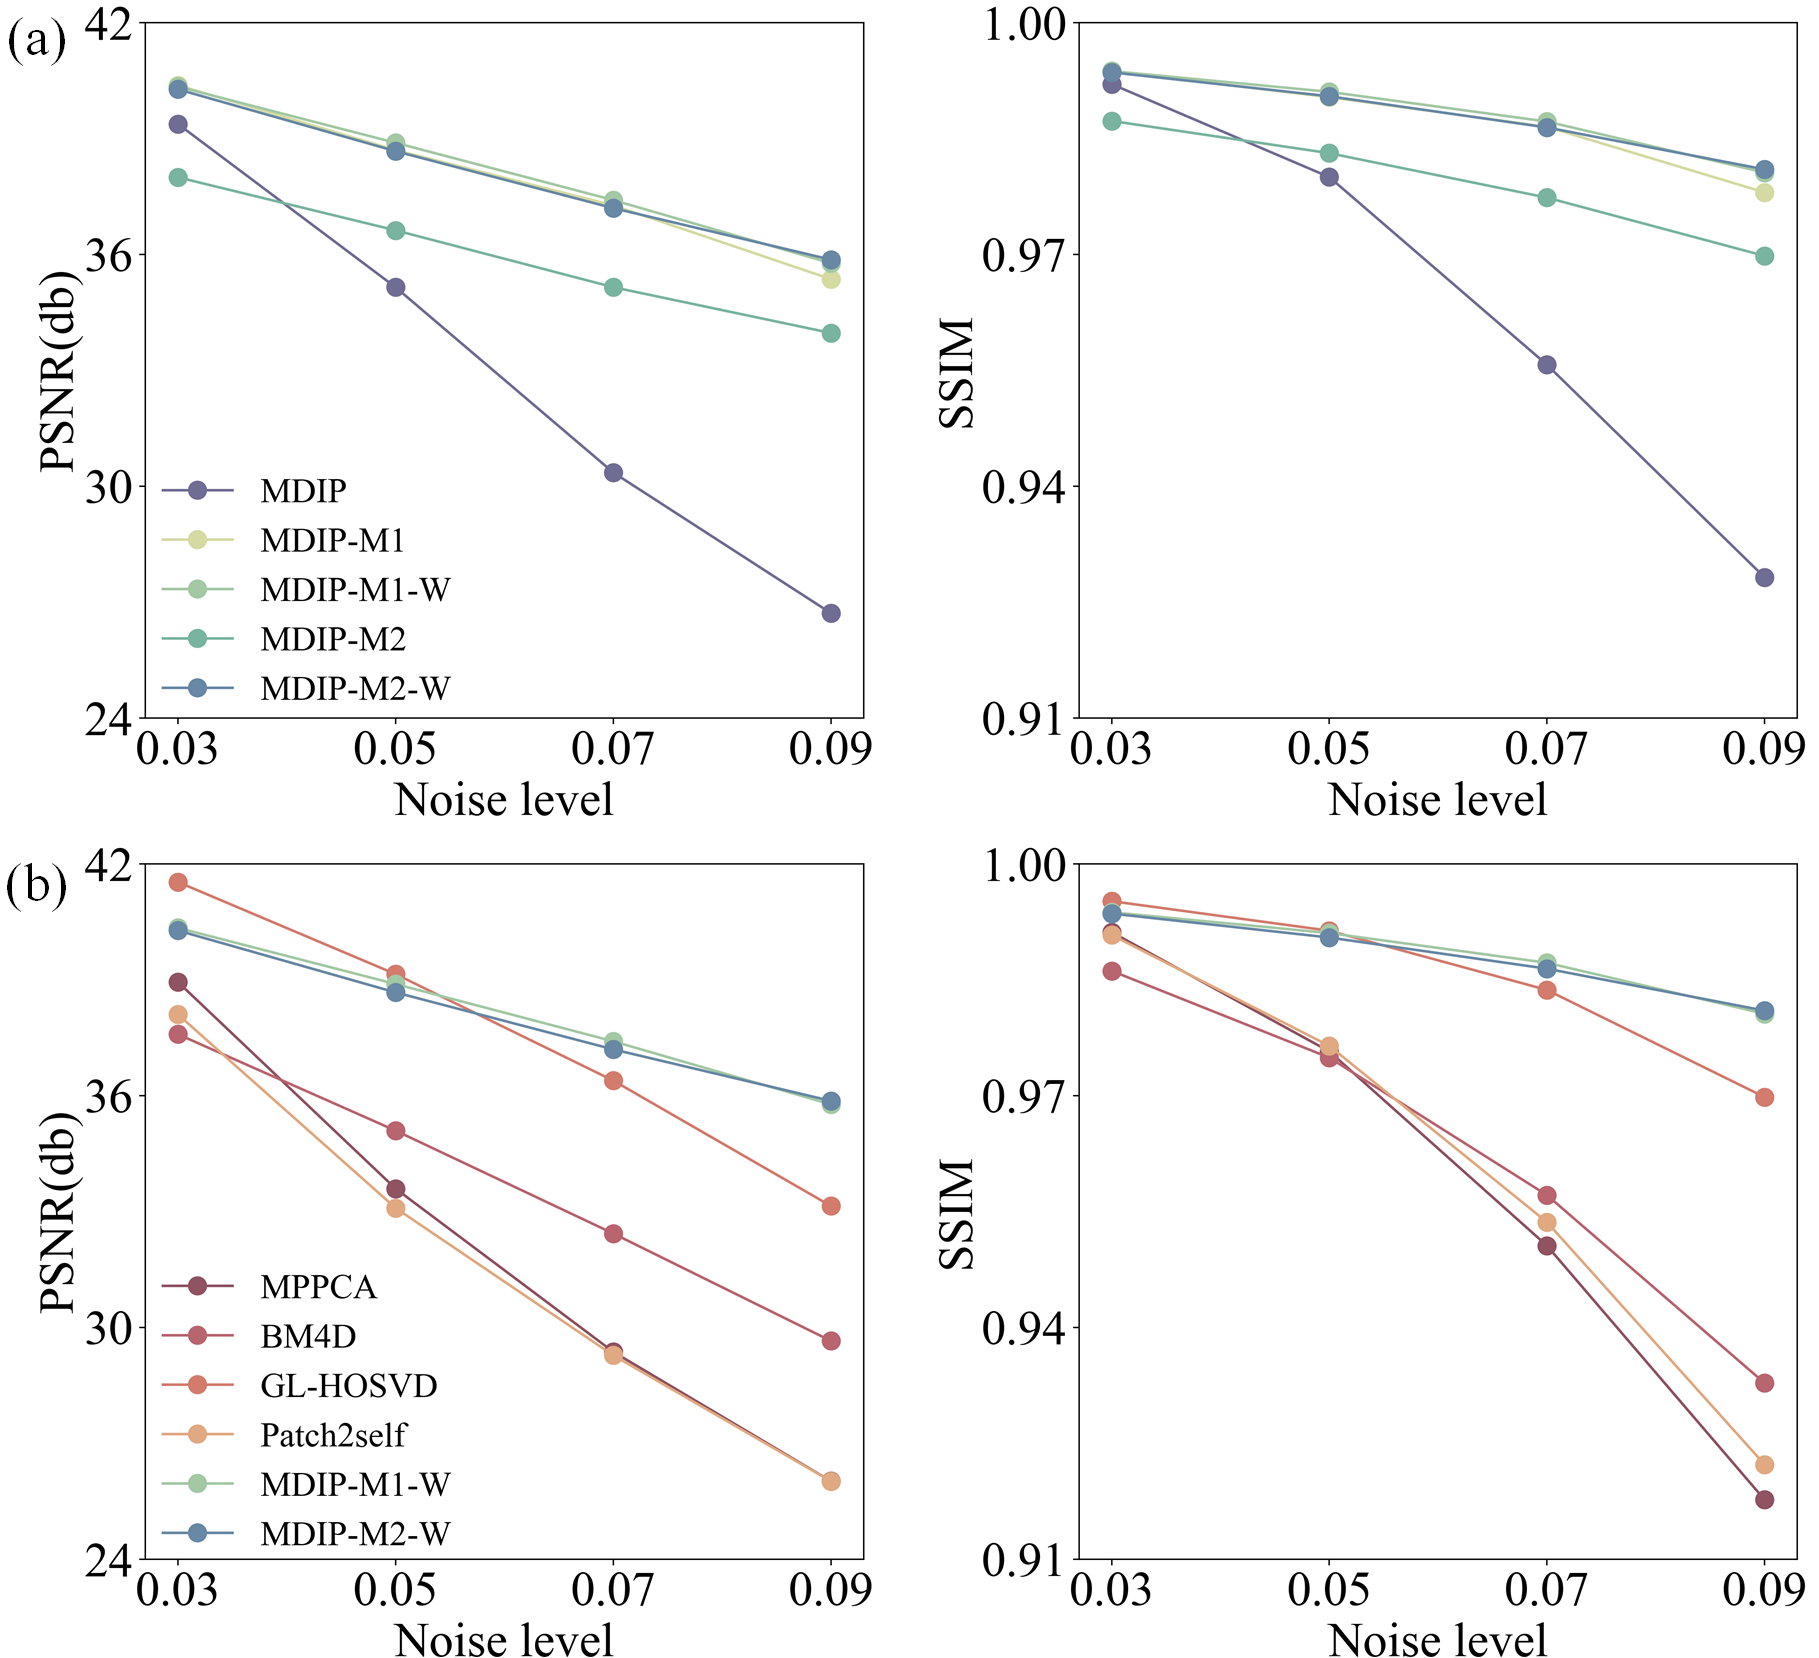
Fig.2 (a) shows the PSNR and SSIM values of the dMRI data denoised by different DIP methods, using the simulated data under different noise levels. The result demonstrated the effectiveness of our proposed noise-correction loss functions.Fig.2 (b) shows the PSNR and SSIM values of the dMRI data denoised by different compared methods4-7, using the simulated data under different noise levels. In noise levels from 0.05 to 0.09, the proposed methods performed better or comparable than other methods.
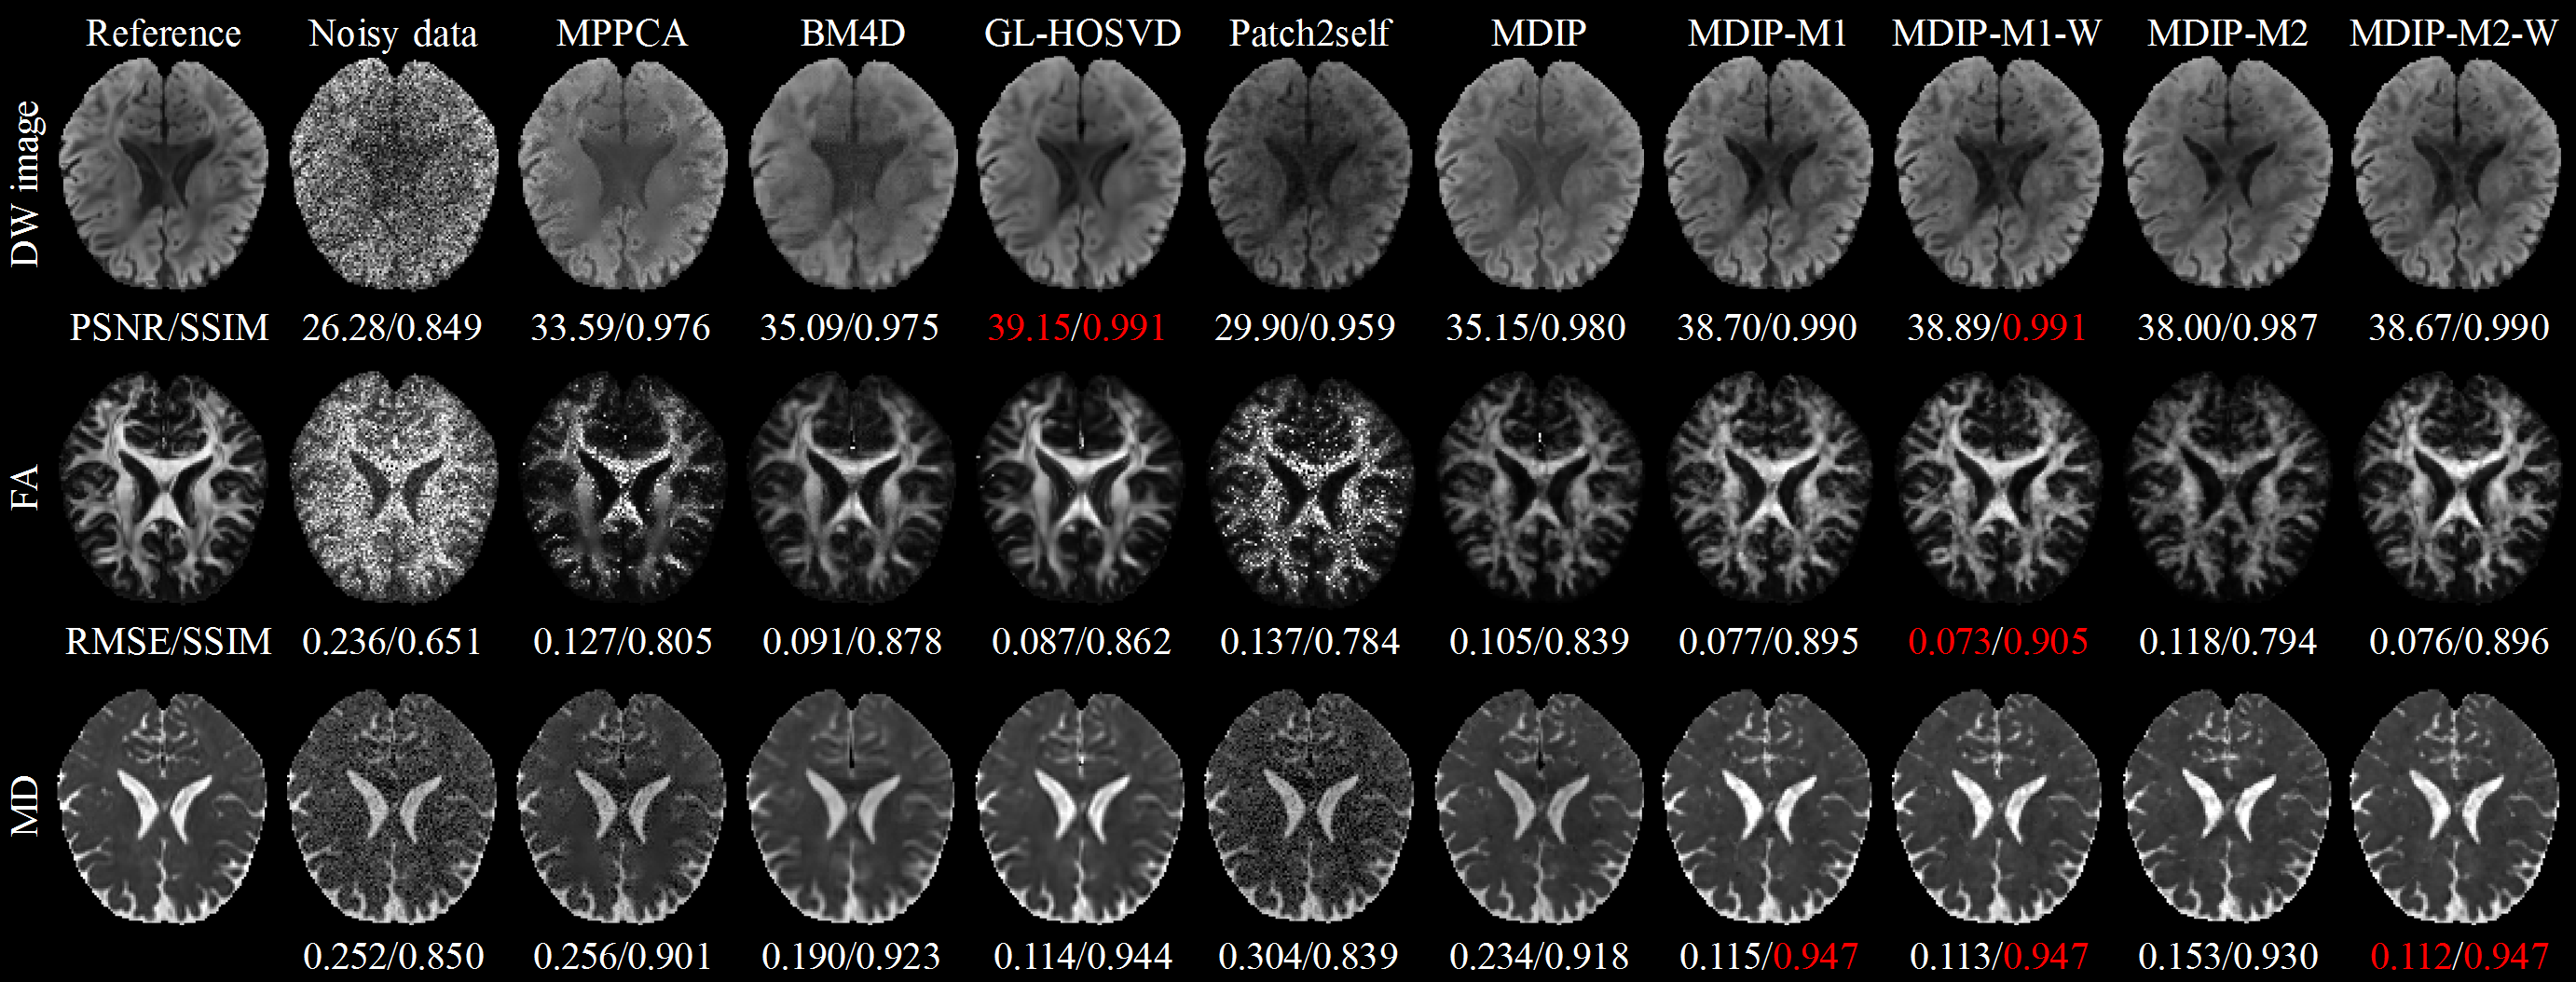
Fig.3 presents a visual comparison of DW images, FA and MD maps for different methods, using the simulated data with a noise level of 0.05. The proposed methods contains richer details with lower RMSE and higher SSIM values than other methods.
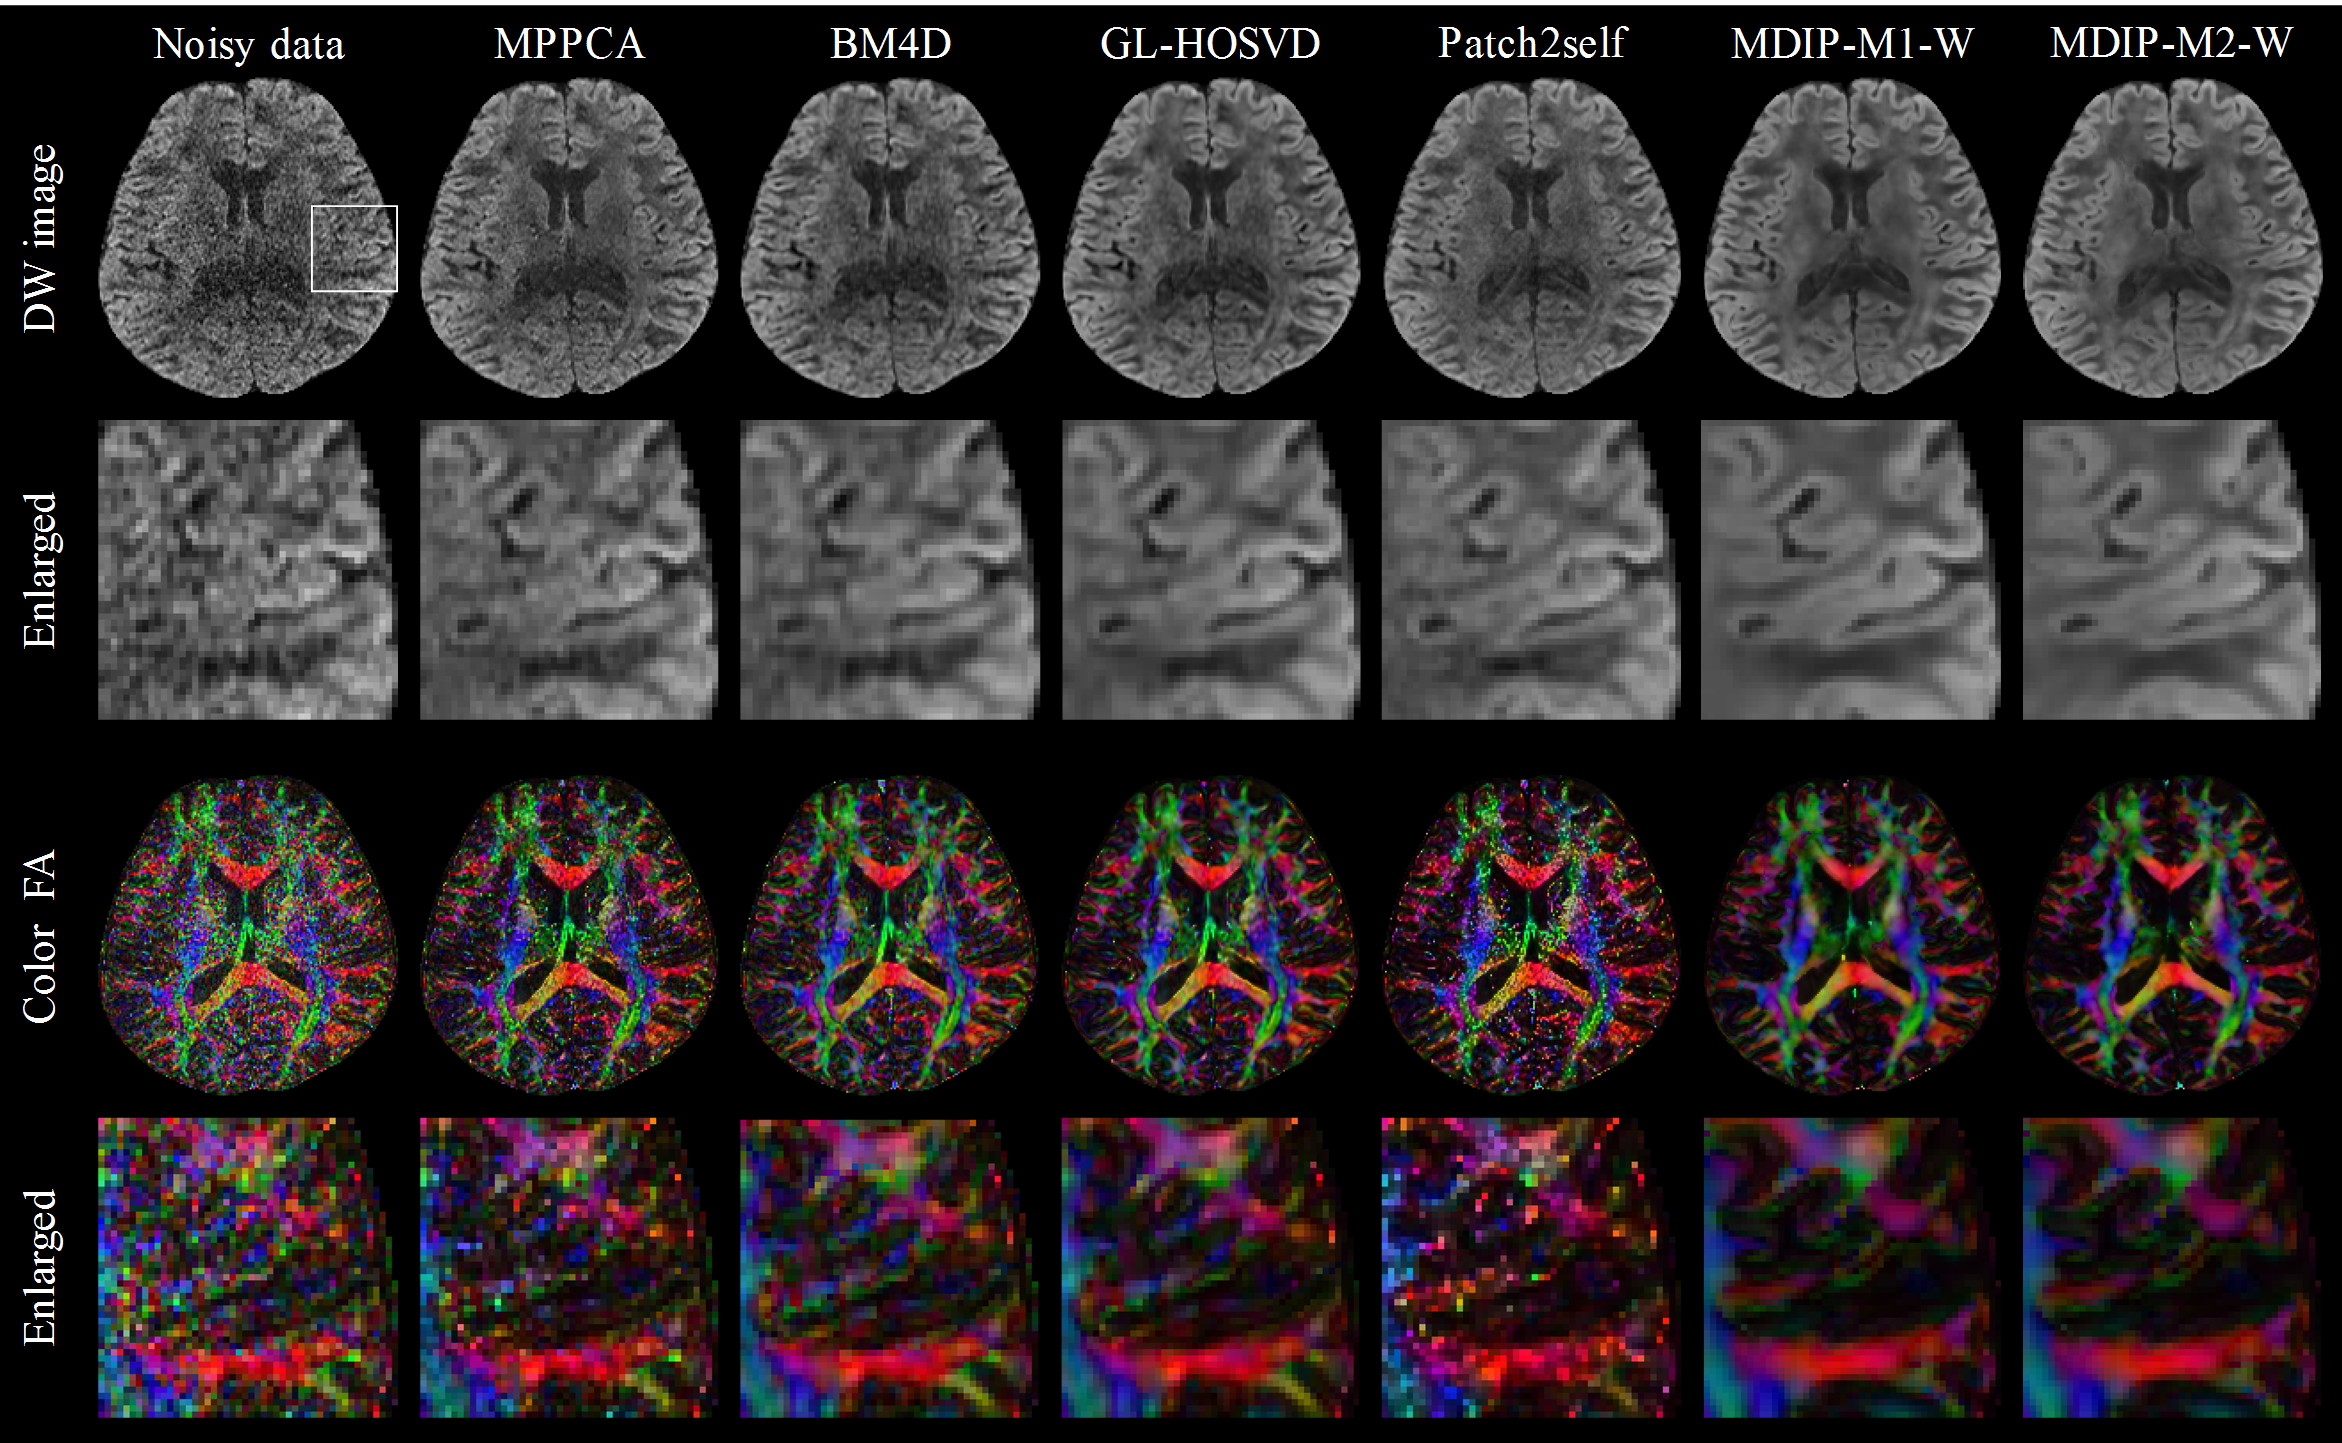
Fig.4 presents a visual comparison of DW images, color FA maps and corresponding enlarge maps generated by different methods, using the in-vivo data. The images generated by the proposed methods are less noisy with more details preserved.
Discussion and Conclusion
We proposed two novel noise-corrected loss functions based on the characteristics of the Rician distribution for unsupervised learning. The results demonstrated that the proposed loss functions can effectively improve the quality of the noisy DW images and the reliability of subsequent diffusion parameter estimation.Acknowledgements
This work was supported by the National Natural Science Foundation of China (61971214) and Natural Science Foundation of Guangdong Province (2023A1515012093).References
Figures