1131
Quantitative susceptibility mapping of the common marmoset brain at 9.4 T1Functional Imaging Laboratory, German Primate Center, Göttingen, Germany
Synopsis
Keywords: Large Animals, Nonhuman Primates, Susceptibility, Marmoset, Nonhuman primate, QSM, R2*, SWI, 9.4T, High-field
Motivation: Quantitative Susceptibility Mapping (QSM) is still not widely employed in non-human primates (NHP). Although it has been recently applied to cynomolgus and rhesus macaques, little attention has been given to other NHPs like marmosets.
Goal(s): Our goal was to establish QSM in marmosets at 9.4 T.
Approach: We conducted high-field MRI on 33 healthy marmosets to achieve superior spatial resolution and sensitivity. We evaluated the contrast-to-noise ratio in the QSM map for four subcortical structures and generated cortex intensity profiles.
Results: In the marmoset brain, QSM provided excellent contrast of subcortical structure, various white matter tracts, and the cortex.
Impact: Establishing QSM in marmosets may be helpful to those interested in comprehending brain tissue structure and organization, refining brain parcellation, and facilitating procedures like MRI-guided stereotactic surgery, injections, and precise neuronal targeting.
Introduction
Non-human primates (NHPs) have been pivotal in advancing our understanding of the human brain and developing treatments for neurological disorders1-3. However, despite their importance, some advanced MRI techniques, such as QSM, have yet to find widespread use in preclinical research. While QSM has been applied to cynomolgus and rhesus macaques, its potential in other NHPs, like marmosets, remains largely untapped4,5. Given the growing relevance of marmosets in neuroscience, it is crucial to broaden the application of QSM to this species. Their small brain size allows for high-resolution MR imaging using cutting-edge high-field MRI systems, making them particularly well-suited for QSM. Moreover, a high-resolution QSM template may enhance brain parcellation and foster reproducible research outcomes.Methods
Subjects: Our study included a cohort of 33 healthy common marmosets (Callithrix jacchus, 17 male/16 female). These marmosets varied in age from 23 to 168 months, equivalent to 2 to 15 years.Data Acquisition: MRI data was acquired at 9.4 T (Bruker BioSpin). A 3D multi-echo gradient-recalled echo (ME-GRE) sequence was used to obtain images at ten echo times (TEs) ranging from 3 to 30 ms, with an echo spacing of 3 ms, repetition time of 42 ms, flip angle of 25 ˚, spatial resolution of 0.21 x 0.21 x 0.21 mm³, two number of averages, and a total acquisition time of 17.5 minutes.
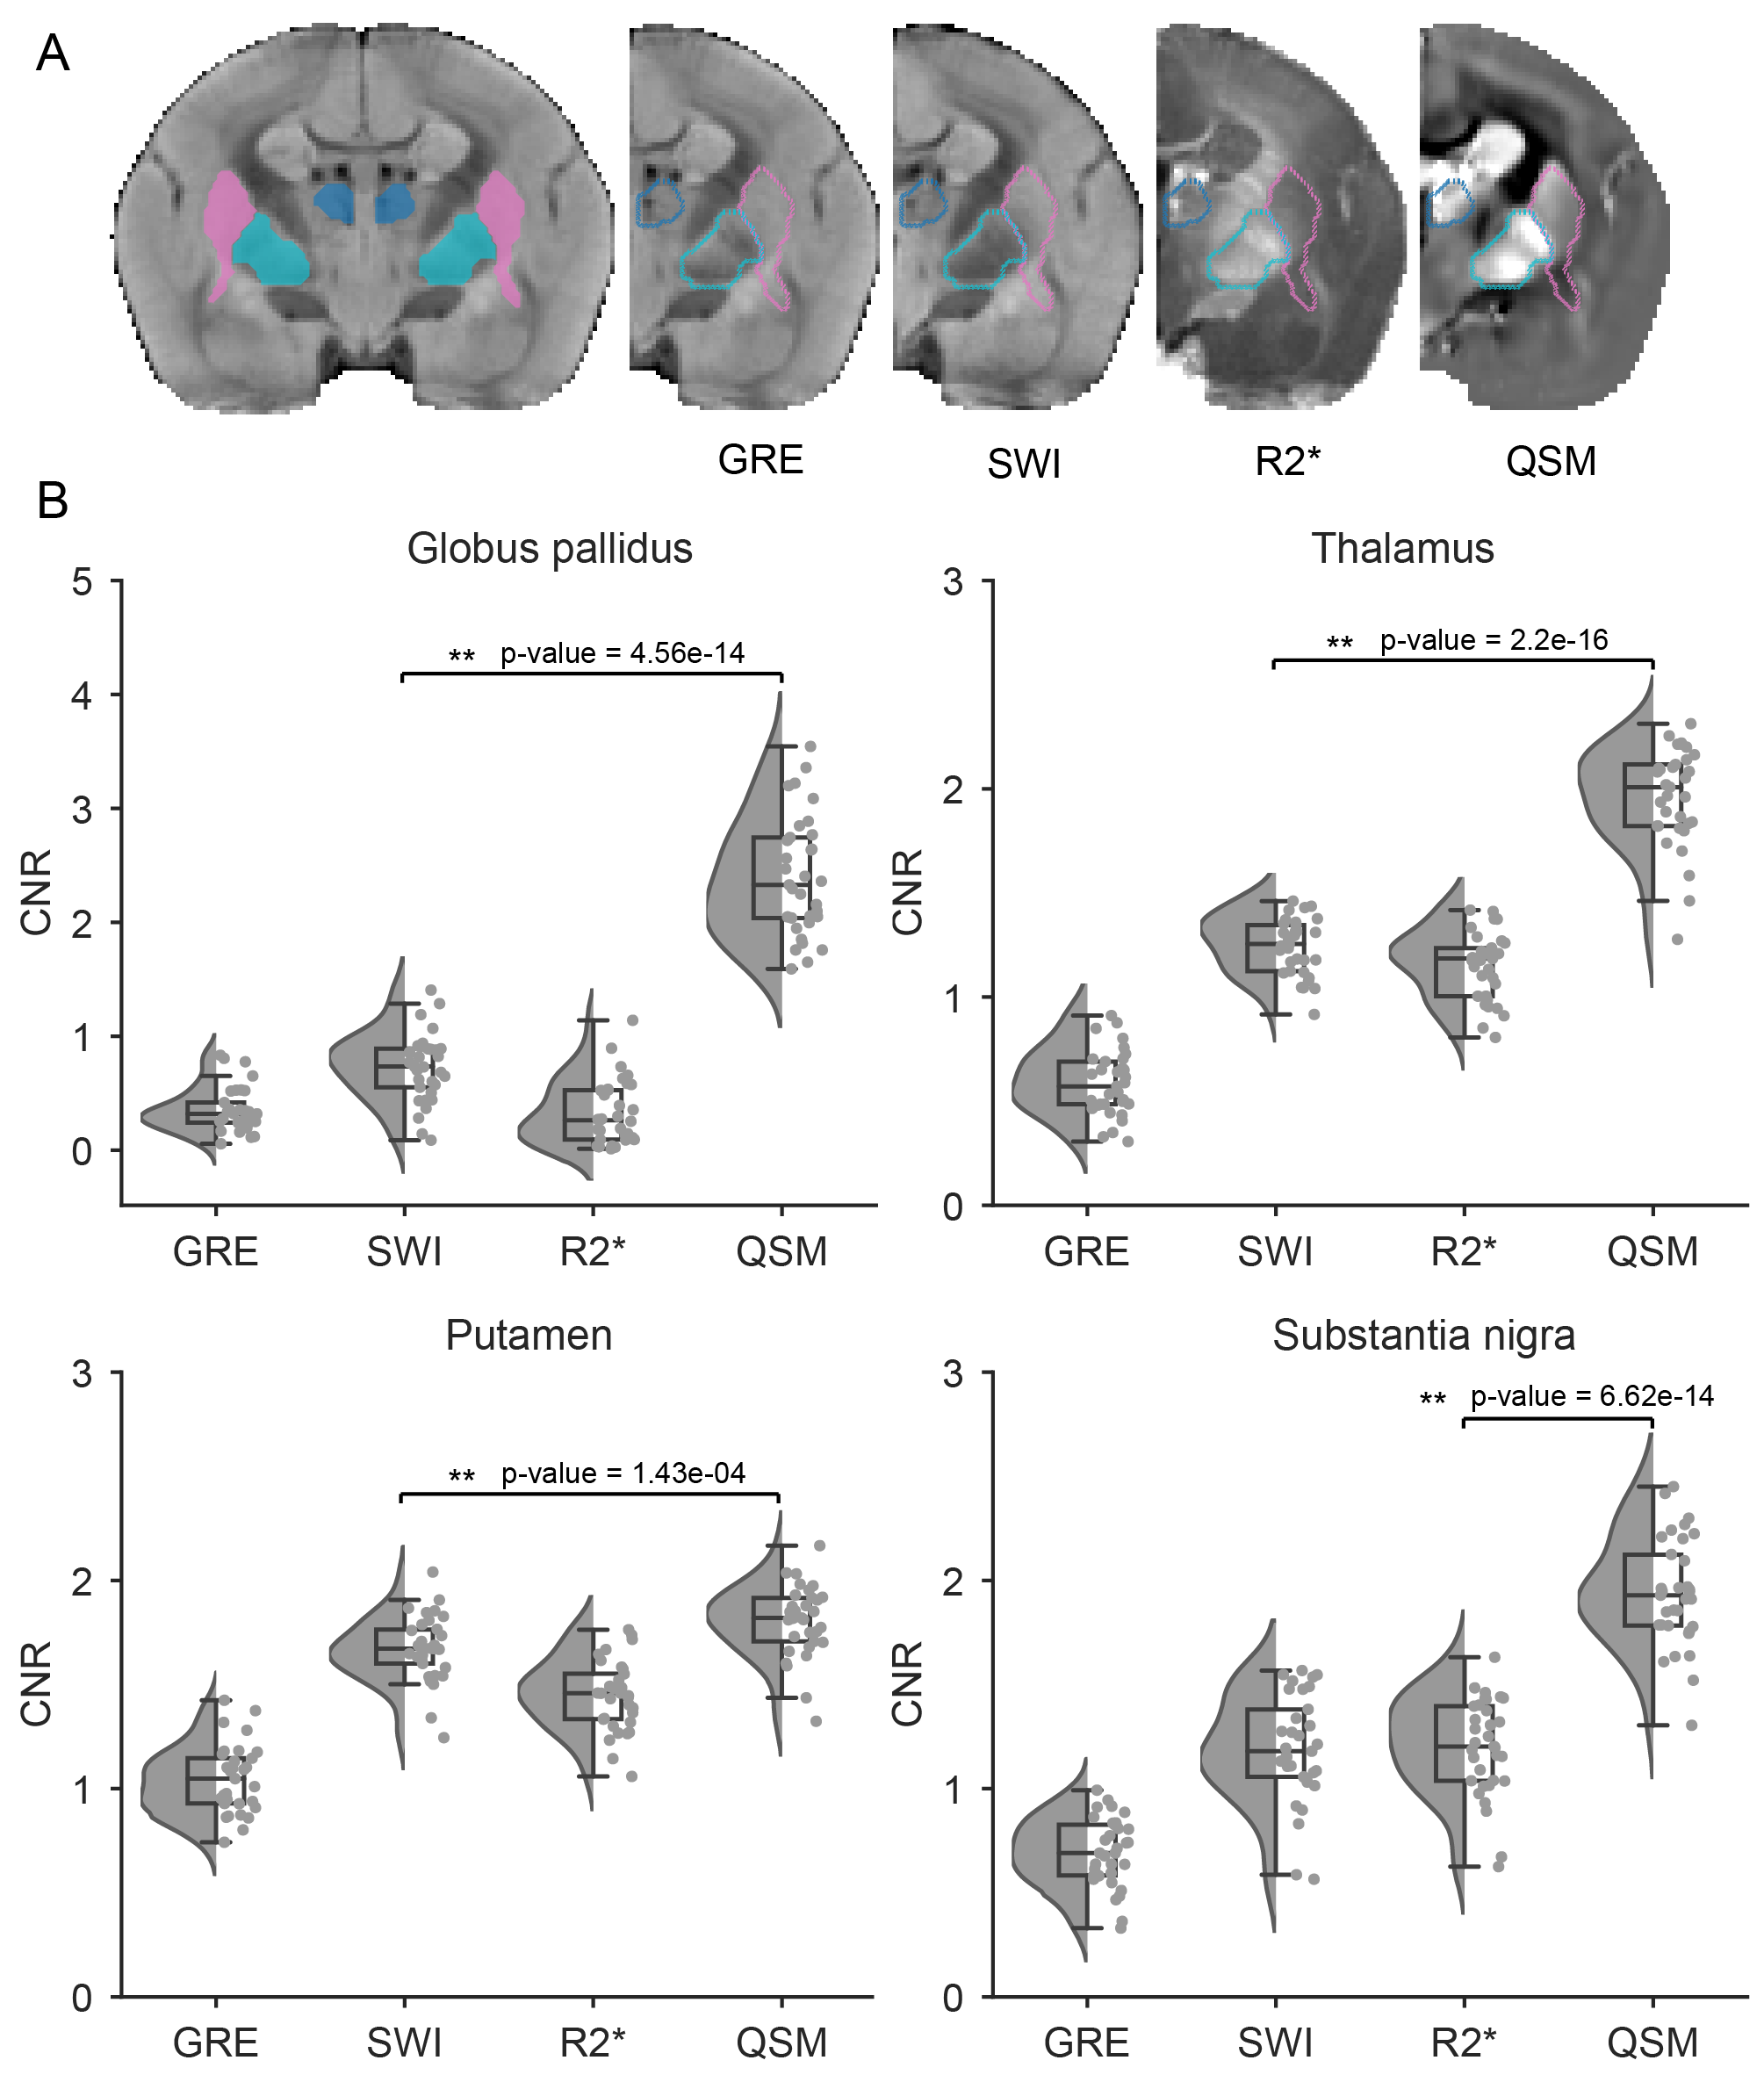
Data analysis: We utilized data from all ten echo times of the ME-GRE scans to generate R2* maps. To calculate the QSM and SWI6 maps, we only used data recorded for odd-numbered TEs (1, 3, 5, 7, and 9). QSM maps were reconstructed using the coil-combined ME-GRE phase images, and the reconstruction process involved phase unwrapping using the best-path algorithm, background field removal using Laplacian boundary value and variable spherical mean value filtering algorithms, and solving the inversion problem using the multiscale dipole inversion approach7–9. Finally, we generated population-averaged GRE, SWI, R2*, and QSM templates using the ANTs registration tool10. The subcortical regions of interest (ROI) were extracted from the MBM v2 atlas11 (Fig. 1A). We calculate the CNR for each region relative to the internal capsule (CNR = (mean (ROI) - mean (internal capsule)) / standard deviation (internal capsule), Fig. 1B).
Results
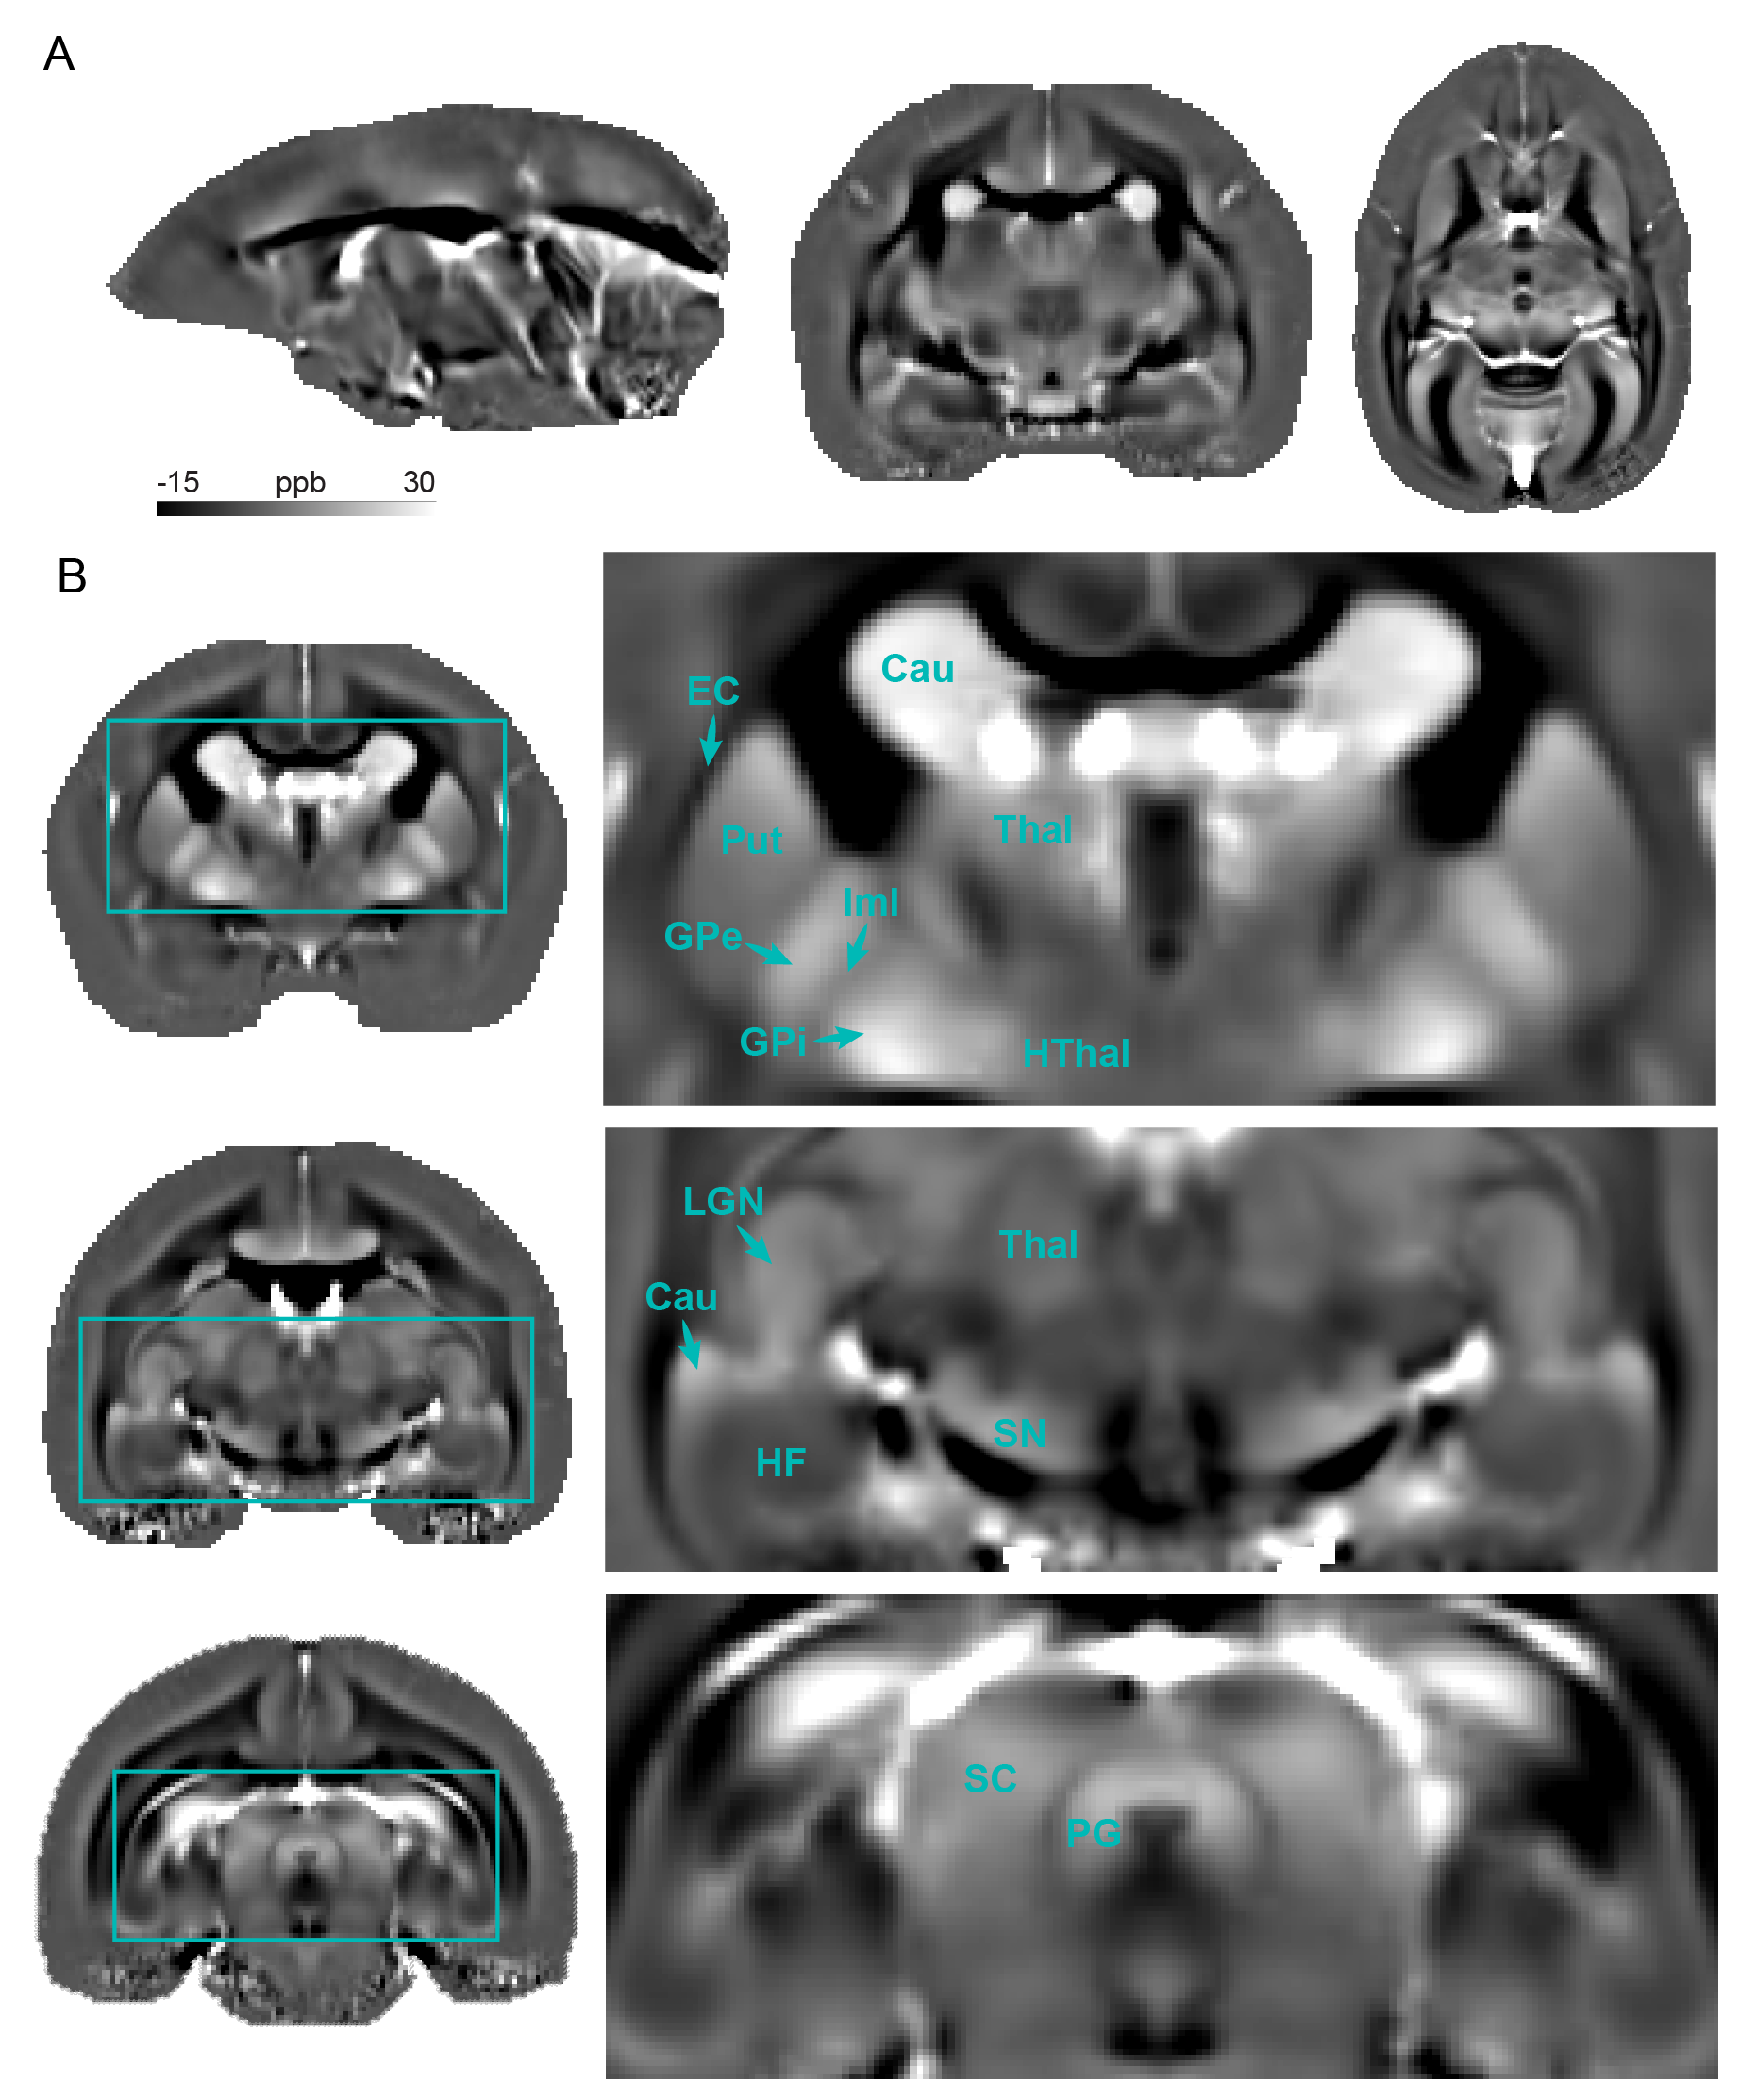
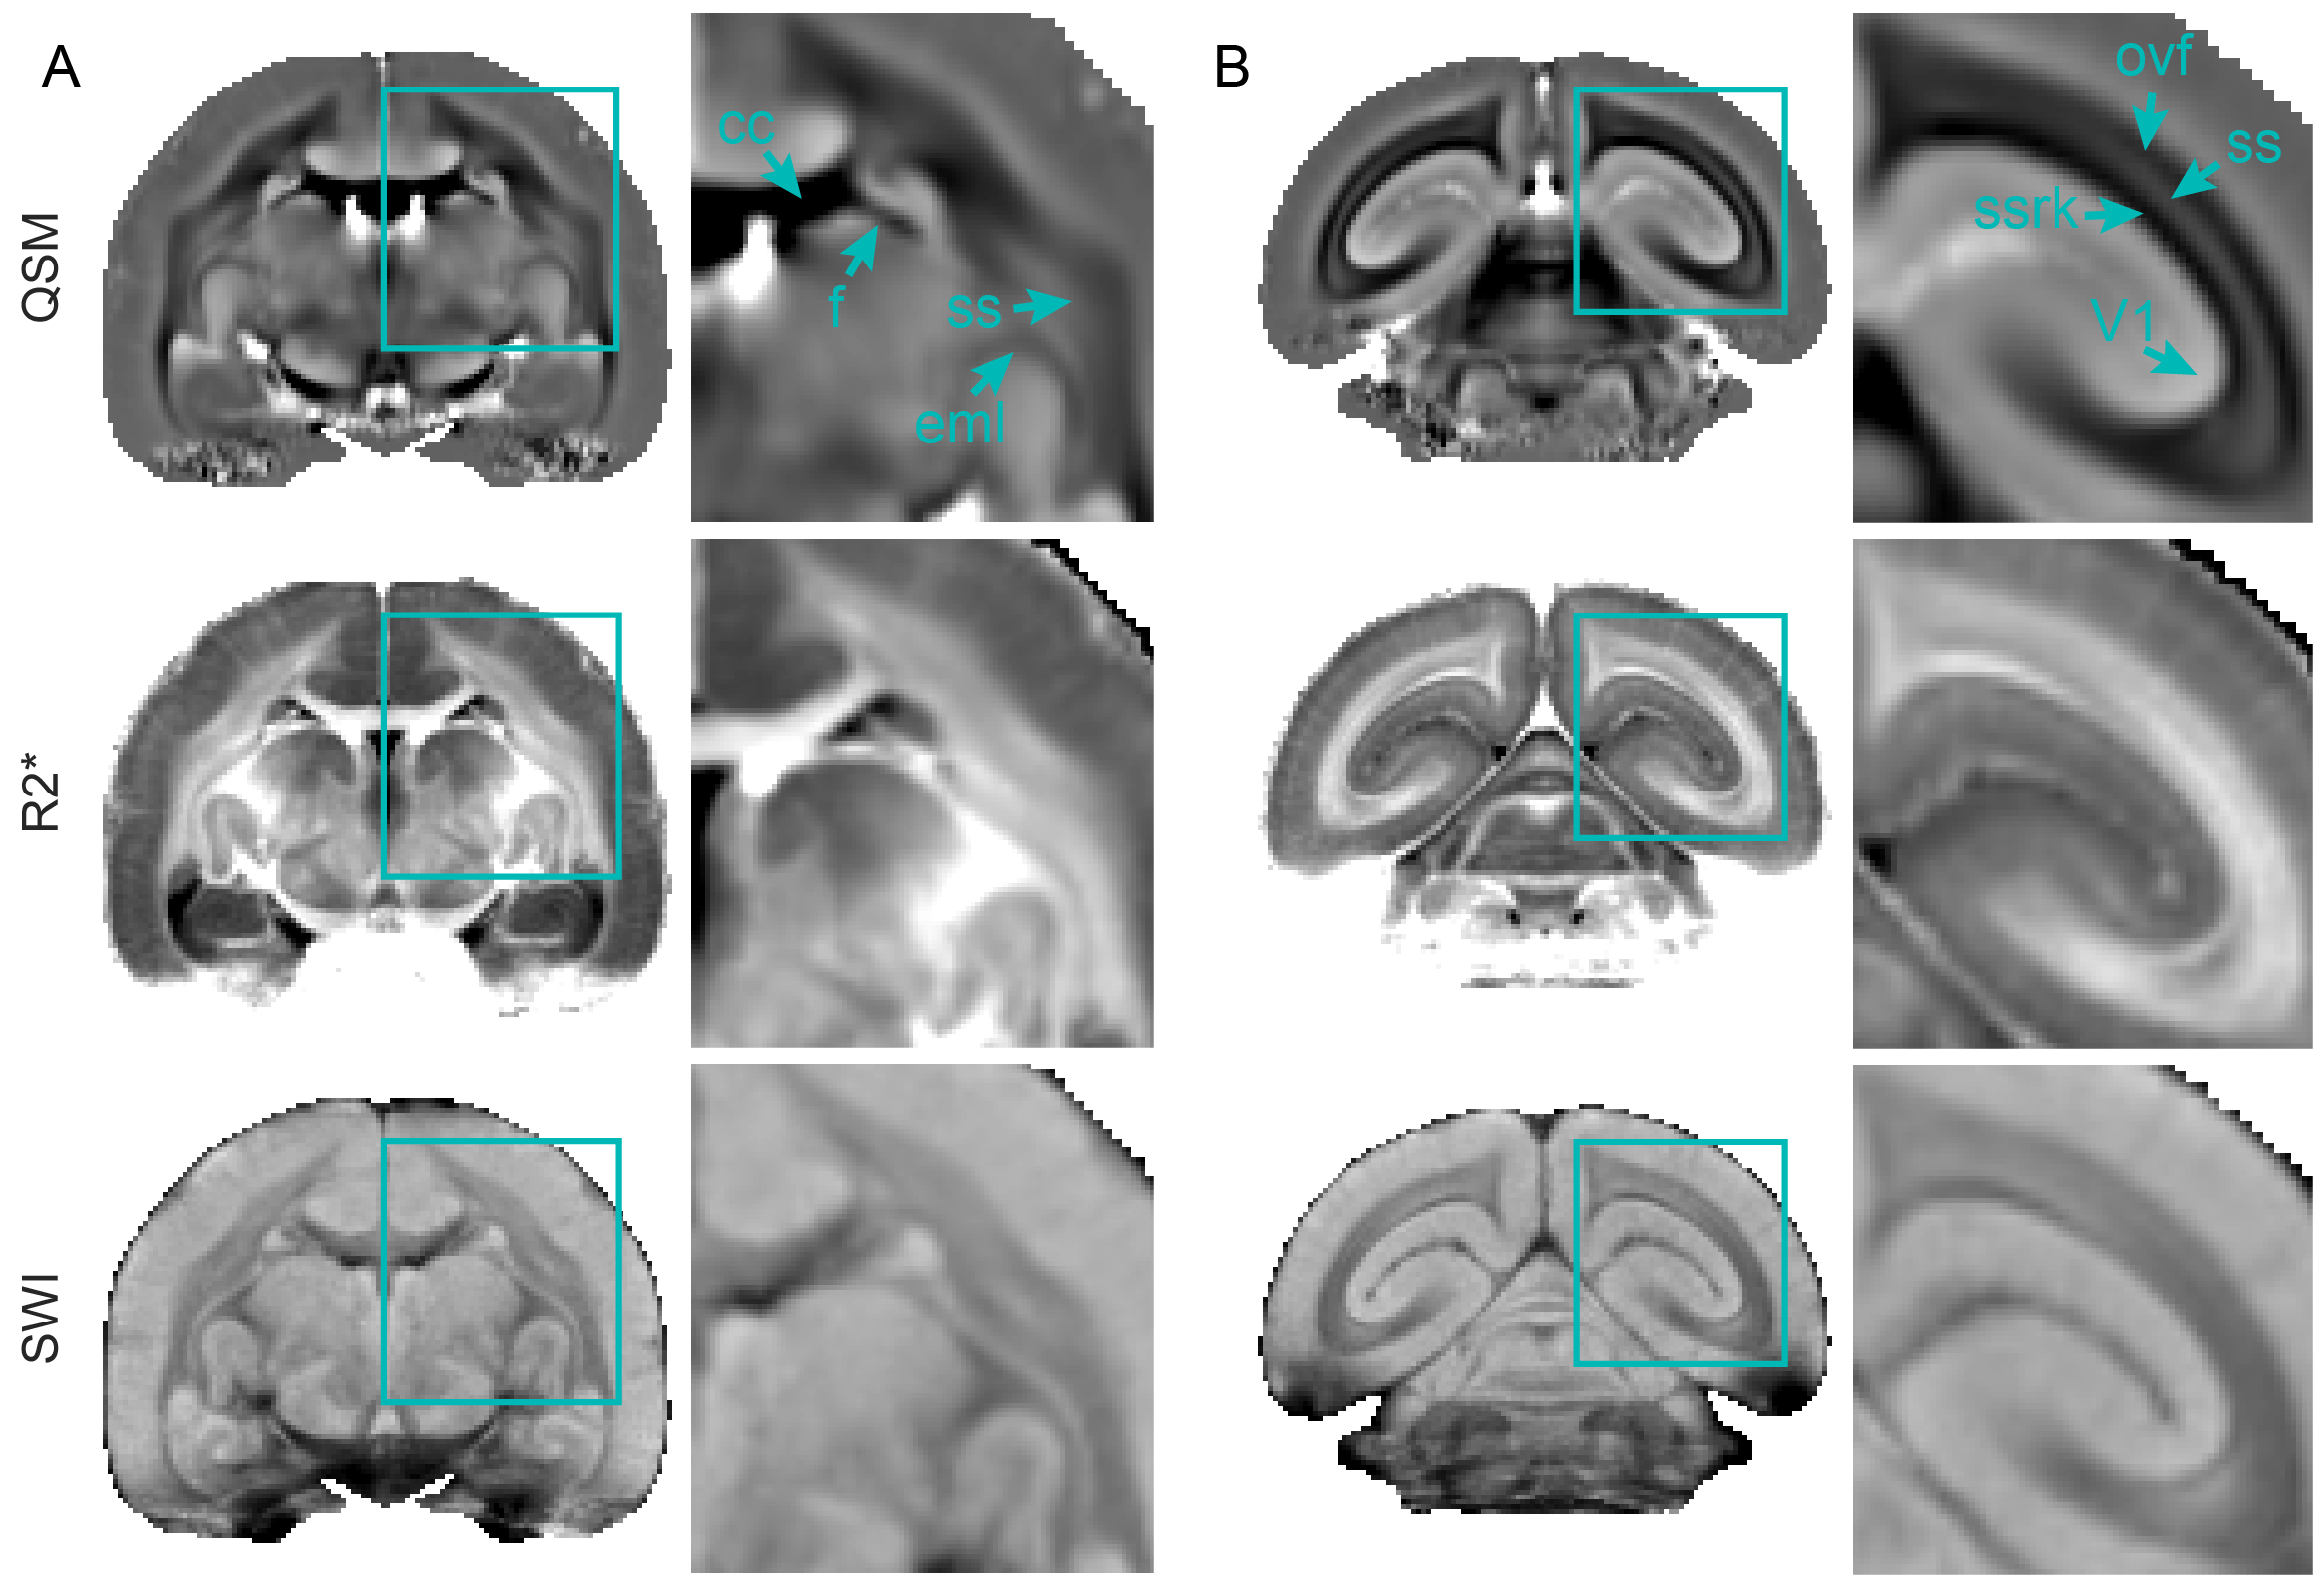
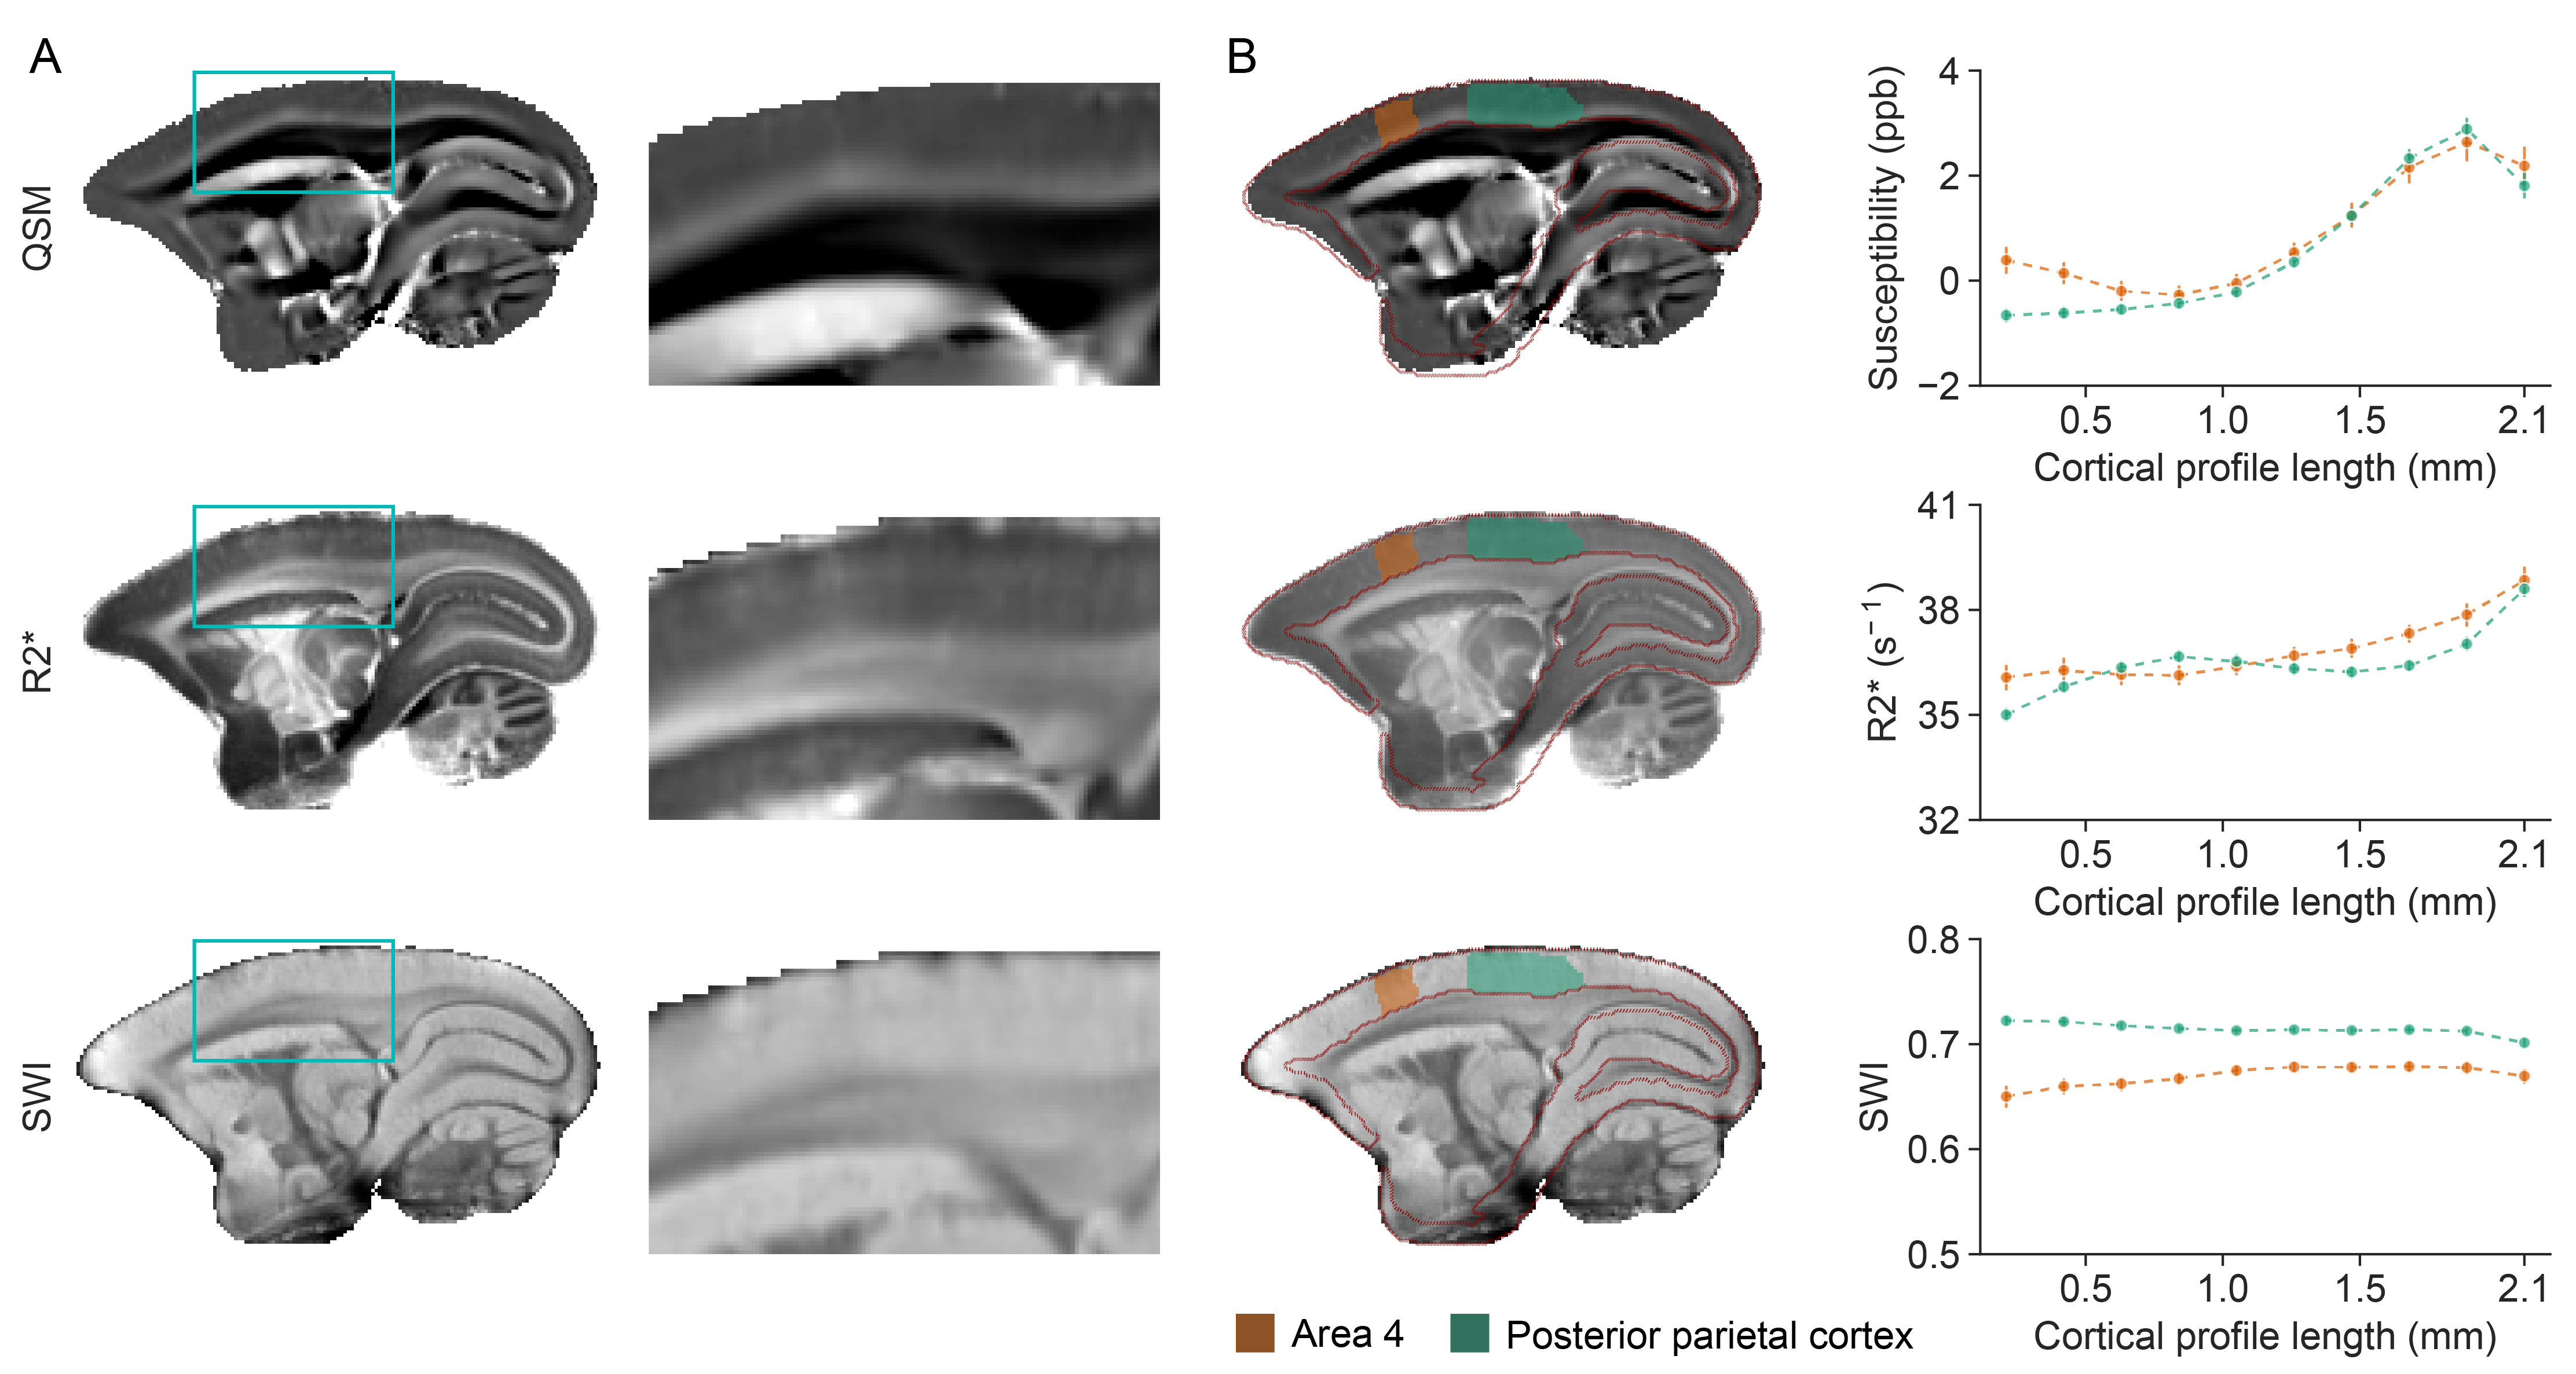
QSM demonstrated superior CNR compared to other MRI contrast in all subcortical regions examined, including the globus pallidus, thalamus, putamen, and substantia nigra (Fig. 1B). The paramagnetic contrast from the subcortical grey matter nuclei provided clear distinction from the surrounding tissues. Anatomically, we were able to identify several subcortical structures: caudate, putamen, internal and external globus pallidus, internal and external capsule, thalamus, hypothalamus, lateral geniculate nucleus, substantia nigra, periaqueductal grey, superior colliculus, and hippocampal formation (Fig. 2). Within the globus pallidus, the internal segment showed more paramagnetic contrast compared to the external segment. Moreover, QSM effectively represented the organization of the white matter fiber bundles, particularly evident in the occipital vertical fasciculus (ovf) and the stratum calcarinum (ssrk), which exhibited more diamagnetic contrast compared to the sagittal stratum (ss) (Fig. 3B). White matter fiber bundles with a left-to-right orientation, such as the anterior commissure (ac) and corpus callosum (cc), showed highly diamagnetic QSM contrast. Additionally, QSM unveiled a high susceptibility band in the cortex, located just above the white matter (Fig. 4). This high susceptibility band in the cortex was neither visible on R2* maps nor SWI and corresponds almost to an area of low fractional anisotropy (data not shown).Discussion and Conclusion
We successfully introduced QSM to common marmosets, opening avenues for translational studies in non-human primates. Utilizing high-field QSM, we effectively visualized the organization of subcortical structures, white matter, and cortical tissues. Our CNR analysis demonstrated QSM's superior contrast to GRE, SWI, and R2* in subcortical nuclei. Additionally, QSM exhibited sensitivity to white matter fiber bundle orientation and microstructure. The distinct susceptibility band in the cortex showed QSM's responsiveness to cortical architecture. Nevertheless, further research is required to investigate the underlying anatomical structures further and realize the full potential of QSM in marmosets.Acknowledgements
We would like to thank Dr. Judith Mylius for her support in the data acquisition.References
1. Nelson, E. E. & Winslow, J. T. Non-human primates: model animals for developmental psychopathology. Neuropsychopharmacology 34, 90–105 (2009).
2. Orsi, A. et al. Overview of the marmoset as a model in nonclinical development of pharmaceutical products. Regulatory Toxicology and Pharmacology 59, 19–27 (2011).
3. Dadarwal, R. Multi-contrast Magnetic Resonance Imaging of Myelin and Iron in the Brain. (2022). doi:10.53846/goediss-9436.
4. Dadarwal, R., Ortiz-Rios, M. & Boretius, S. Fusion of quantitative susceptibility maps and T1-weighted images improve brain tissue contrast in primates. NeuroImage 119730 (2022) doi:10.1016/j.neuroimage.2022.119730.
5. Yoshida, A., Ye, F. Q., Yu, D. K., Leopold, D. A. & Hikosaka, O. Visualization of iron-rich subcortical structures in non-human primates in vivo by quantitative susceptibility mapping at 3T MRI. NeuroImage 241, 118429 (2021).
6. Eckstein, K. et al. Improved susceptibility weighted imaging at ultra-high field using bipolar multi-echo acquisition and optimized image processing: CLEAR-SWI. NeuroImage 237, 118175 (2021).
7. Abdul-Rahman, H. S. et al. Fast and robust three-dimensional best path phase unwrapping algorithm. Appl. Opt., AO 46, 6623–6635 (2007).
8. Acosta-Cabronero, J. et al. A robust multi-scale approach to quantitative susceptibility mapping. Neuroimage 183, 7–24 (2018).
9. Zhou, D., Liu, T., Spincemaille, P. & Wang, Y. Background field removal by solving the Laplacian boundary value problem. NMR in Biomedicine 27, 312–319 (2014).
10. Avants, B. B., Epstein, C. L., Grossman, M. & Gee, J. C. Symmetric diffeomorphic image registration with cross-correlation: evaluating automated labeling of elderly and neurodegenerative brain. Med Image Anal 12, 26–41 (2008).
11. Liu, C. et al. A resource for the detailed 3D mapping of white matter pathways in the marmoset brain. Nature Neuroscience 23, 271–280 (2020).
Figures