1130
Imaging small intracortical blood vessels at 64 μm in-plane resolution in macaque monkey brain in vivo using a large-bore 7T MRI scanner1Department of Neurosurgery of the Second Affiliated Hospital, Interdisciplinary Institute of Neuroscience and Technology, School of Medicine, Zhejiang University, Hangzhou, China, 2MOE Frontier Science Center for Brain Science and Brain-Machine Integration, School of Brain Science and Brain Medicine, Zhejiang University, Hangzhou, China, 3Department of Physics, Carleton University, Ottawa, ON, Canada, 4College of Biomedical Engineering and Instrument Science, Zhejiang University, Hangzhou, China, 5Institute of Mental Health Research, Royal Ottawa Mental Health Centre, Ottawa, ON, Canada, 6School of Electrical Engineering and Computer Science, Faculty of Engineering, Architecture and Information Technology, The University of Queensland, Brisbane, Australia, 7Athinoula A. Martinos Center for Biomedical Imaging, Massachusetts General Hospital, Charlestown, MA, United States, 8Department of Radiology, Harvard Medical School, Boston, MA, United States, 9Division of Health Sciences and Technology, Massachusetts Institute of Technology, Cambridge, MA, United States, 10Key Laboratory for Biomedical Engineering of Ministry of Education, Zhejiang University, Hangzhou, China
Synopsis
Keywords: Blood Vessels, Vessels, Ultra-high field MRI
Motivation: Hemodynamics of the cerebral cortex are shaped by vascular architecture; however, it remains challenging to study the small intracortical vascular anatomy in vivo.
Goal(s): To test whether intracortical arterioles can be detected in vivo in non-human primates at 7 Tesla using a conventional human MRI scanner, and to study the organization of arterials and venules.
Approach: After conducting time-of-flight (TOF) contrast simulations, optimized TOF-MRA images from macaques were acquired using a 7T large-bore MRI scanner with 64-μm in-plane resolution.
Results: Intracortical arterioles and venules were reliably imaged and exhibited cortical area-specific differences in distribution. Imaging times were as fast as 10 minutes.
Impact: Using a standard human 7T MRI scanner, we illustrate that micron-scale intracortical arterioles are detectable non-invasively in vivo in primates. We suggest similar methods can be used to study human microvascular organization in health and disease.
Introduction
Understanding vascular anatomy and function is crucial for providing insights into brain metabolism, neuro-vascular coupling and pathophysiology. Intracortical vessels, in particular, play an important role in mesoscale blood flow regulation. Previous studies in cat1,2 and rat3, using small-bore preclinical MRI scanners (≥9.4T), provided insight into intracortical neurovascular organization at single-vessel resolution. However, there are substantial differences in the functional organization and underlying microvasculature of the cerebral cortex in primates4,5. To our knowledge, no study has measured these vessels in vivo non-invasively in primate. Challenges include the small vessel diameters (tens of microns), cortical folds which result in multiple vascular orientations, limited knowledge of blood flow velocities needed to optimize imaging, and typically weaker gradient coils in large-bore scanners needed for primates. Here we build upon a recent insight that non-contrast, time-of-flight (TOF) MRA can detect pial arteries far smaller than previously expected6 in humans. We push the resolution even further to image smaller intracortical arterioles in primates, achieved by careful optimization of imaging parameters guided by simulations.Methods
Animal preparation Two anesthetized macaques were used. All procedures followed the National Institutes of Health Guide for the Care and Use of Laboratory Animals and were approved by the Institutional Animal Care and Use Committee of Zhejiang University. Animals were maintained with 1–1.5% isoflurane anesthesia; Et-CO2, rectal temperature, blood oxygen saturation and heart rate were continuously monitored. Simulation To optimize TOF contrast of small blood vessels with slow flow, over a range of blood velocities, we developed an analytical framework for simulating TOF images containing one centrally positioned blood vessel, similar to a recent approach used in phase-contrast MRI7. Data acquisition Using a 7T whole-body human MRI scanner (Siemens Healthcare) and custom 16-channel RF surface coil8, we imaged vascular architecture in vivo in macaque monkeys non-invasively by optimizing a single-slice 2D TOF-MRA sequence with high in-plane resolution (64×64 μm2, 1-mm slice thickness, 20 min acquisition), TR=60 ms, FA = 60°, as determined by our simulations. Single slices were positioned on relatively flat extents of V1, V2, V4, and LIP.Results
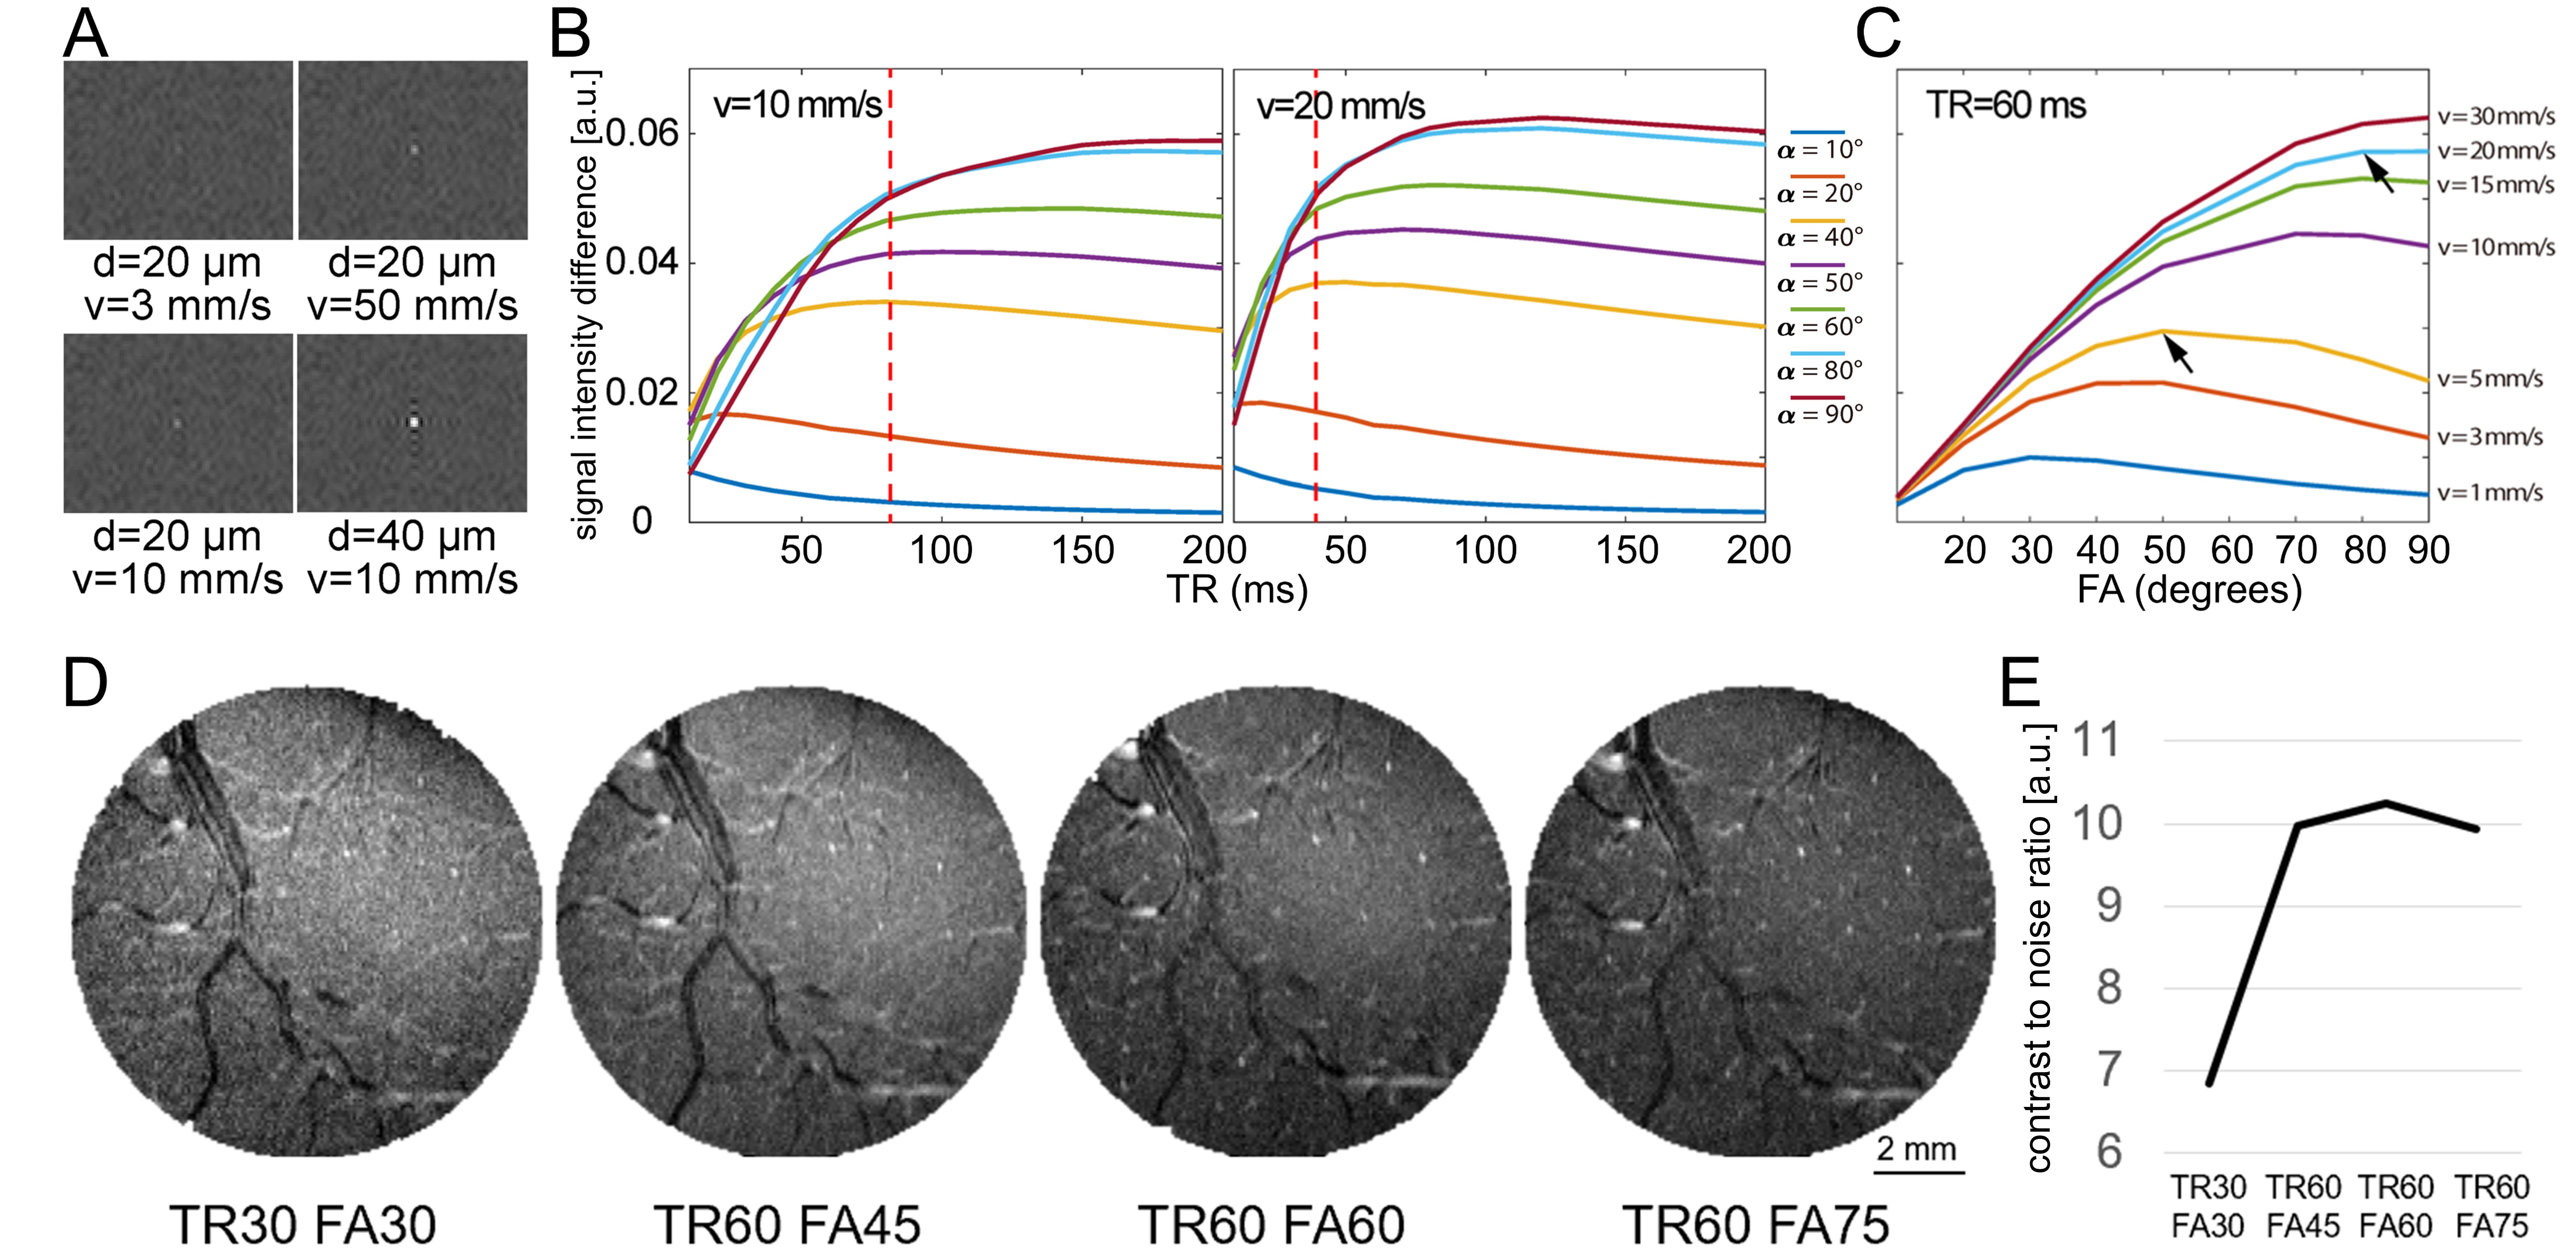
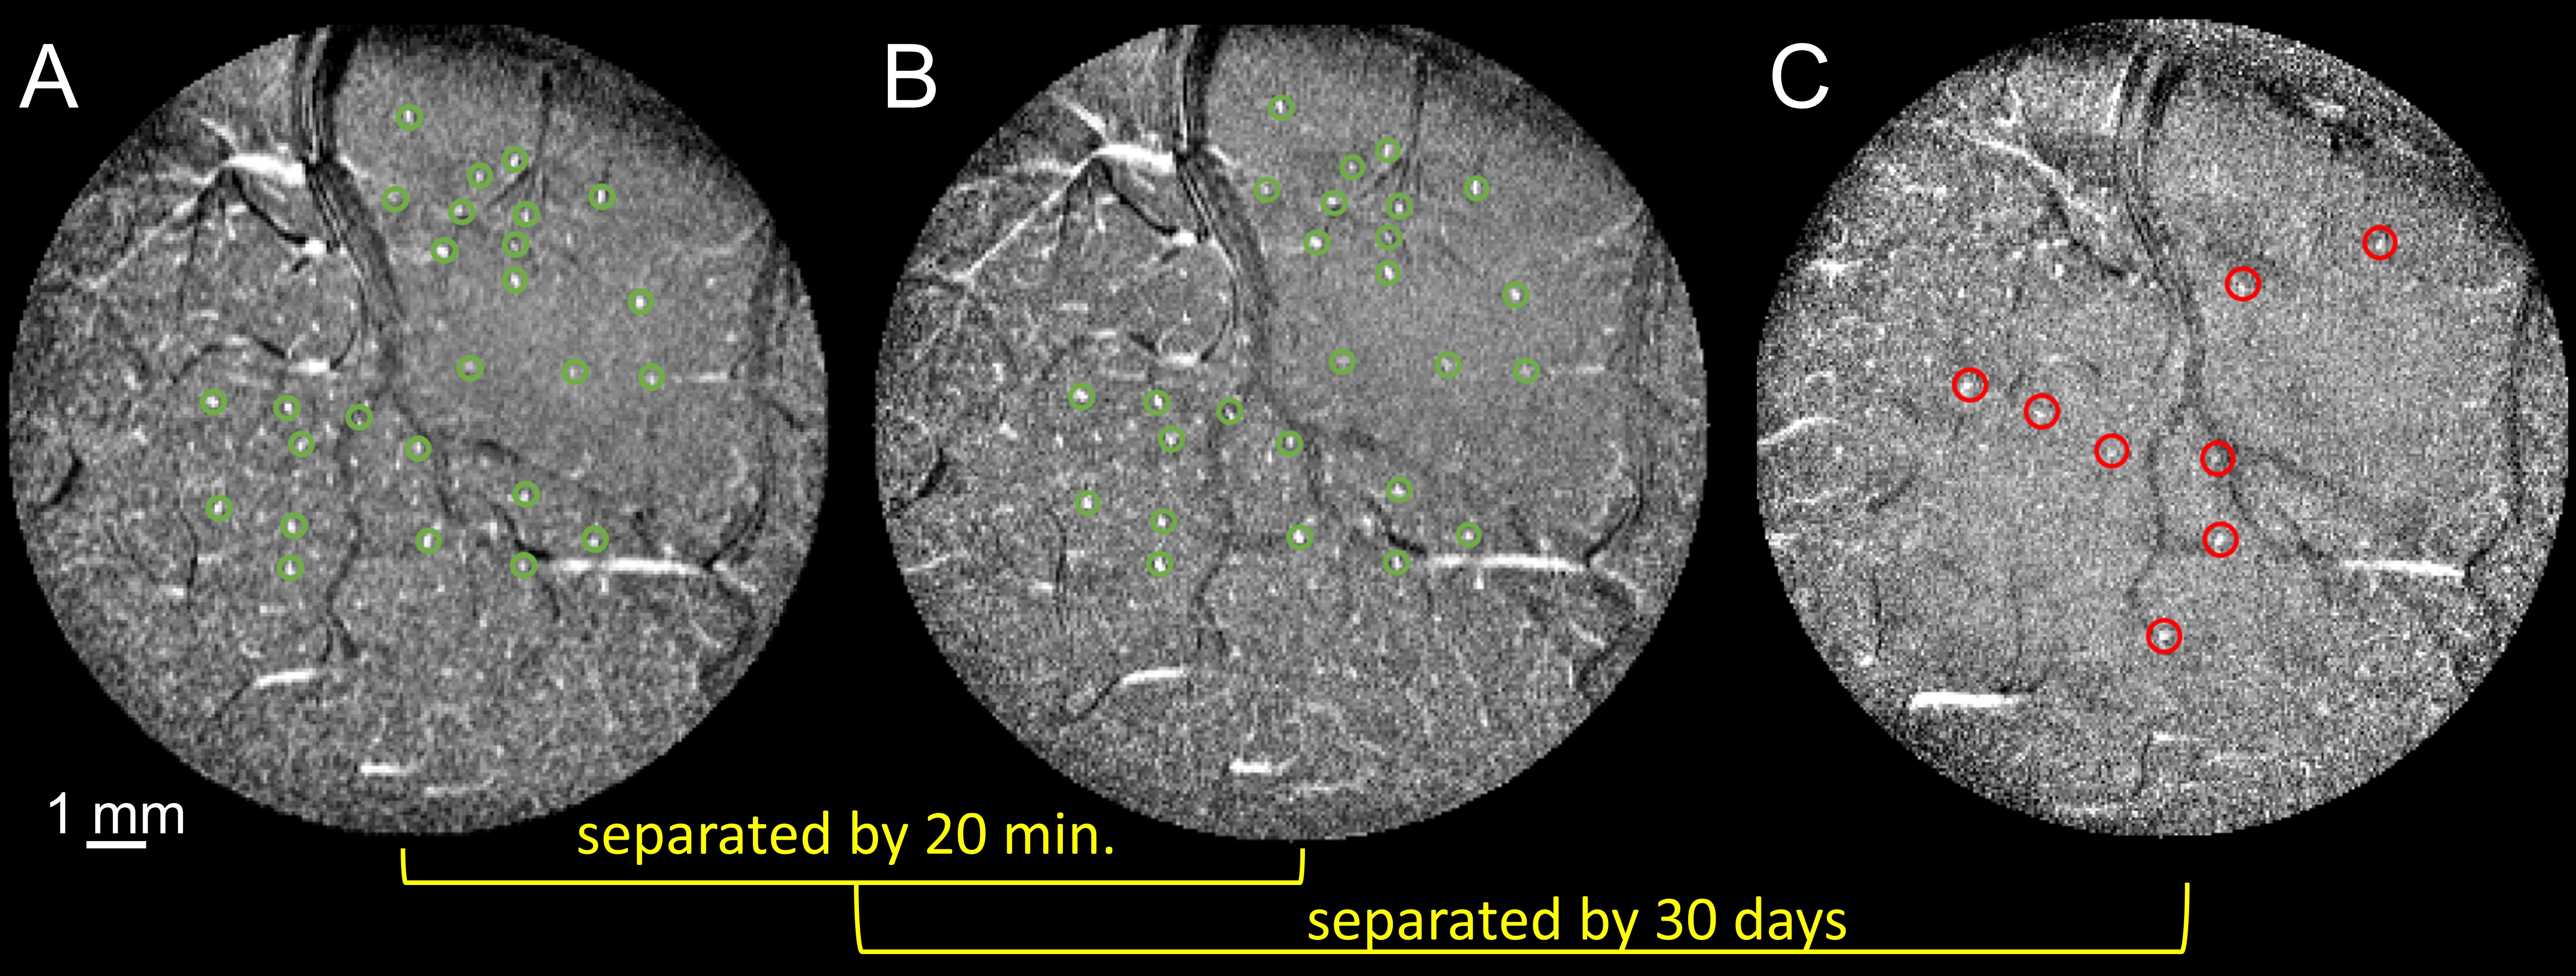
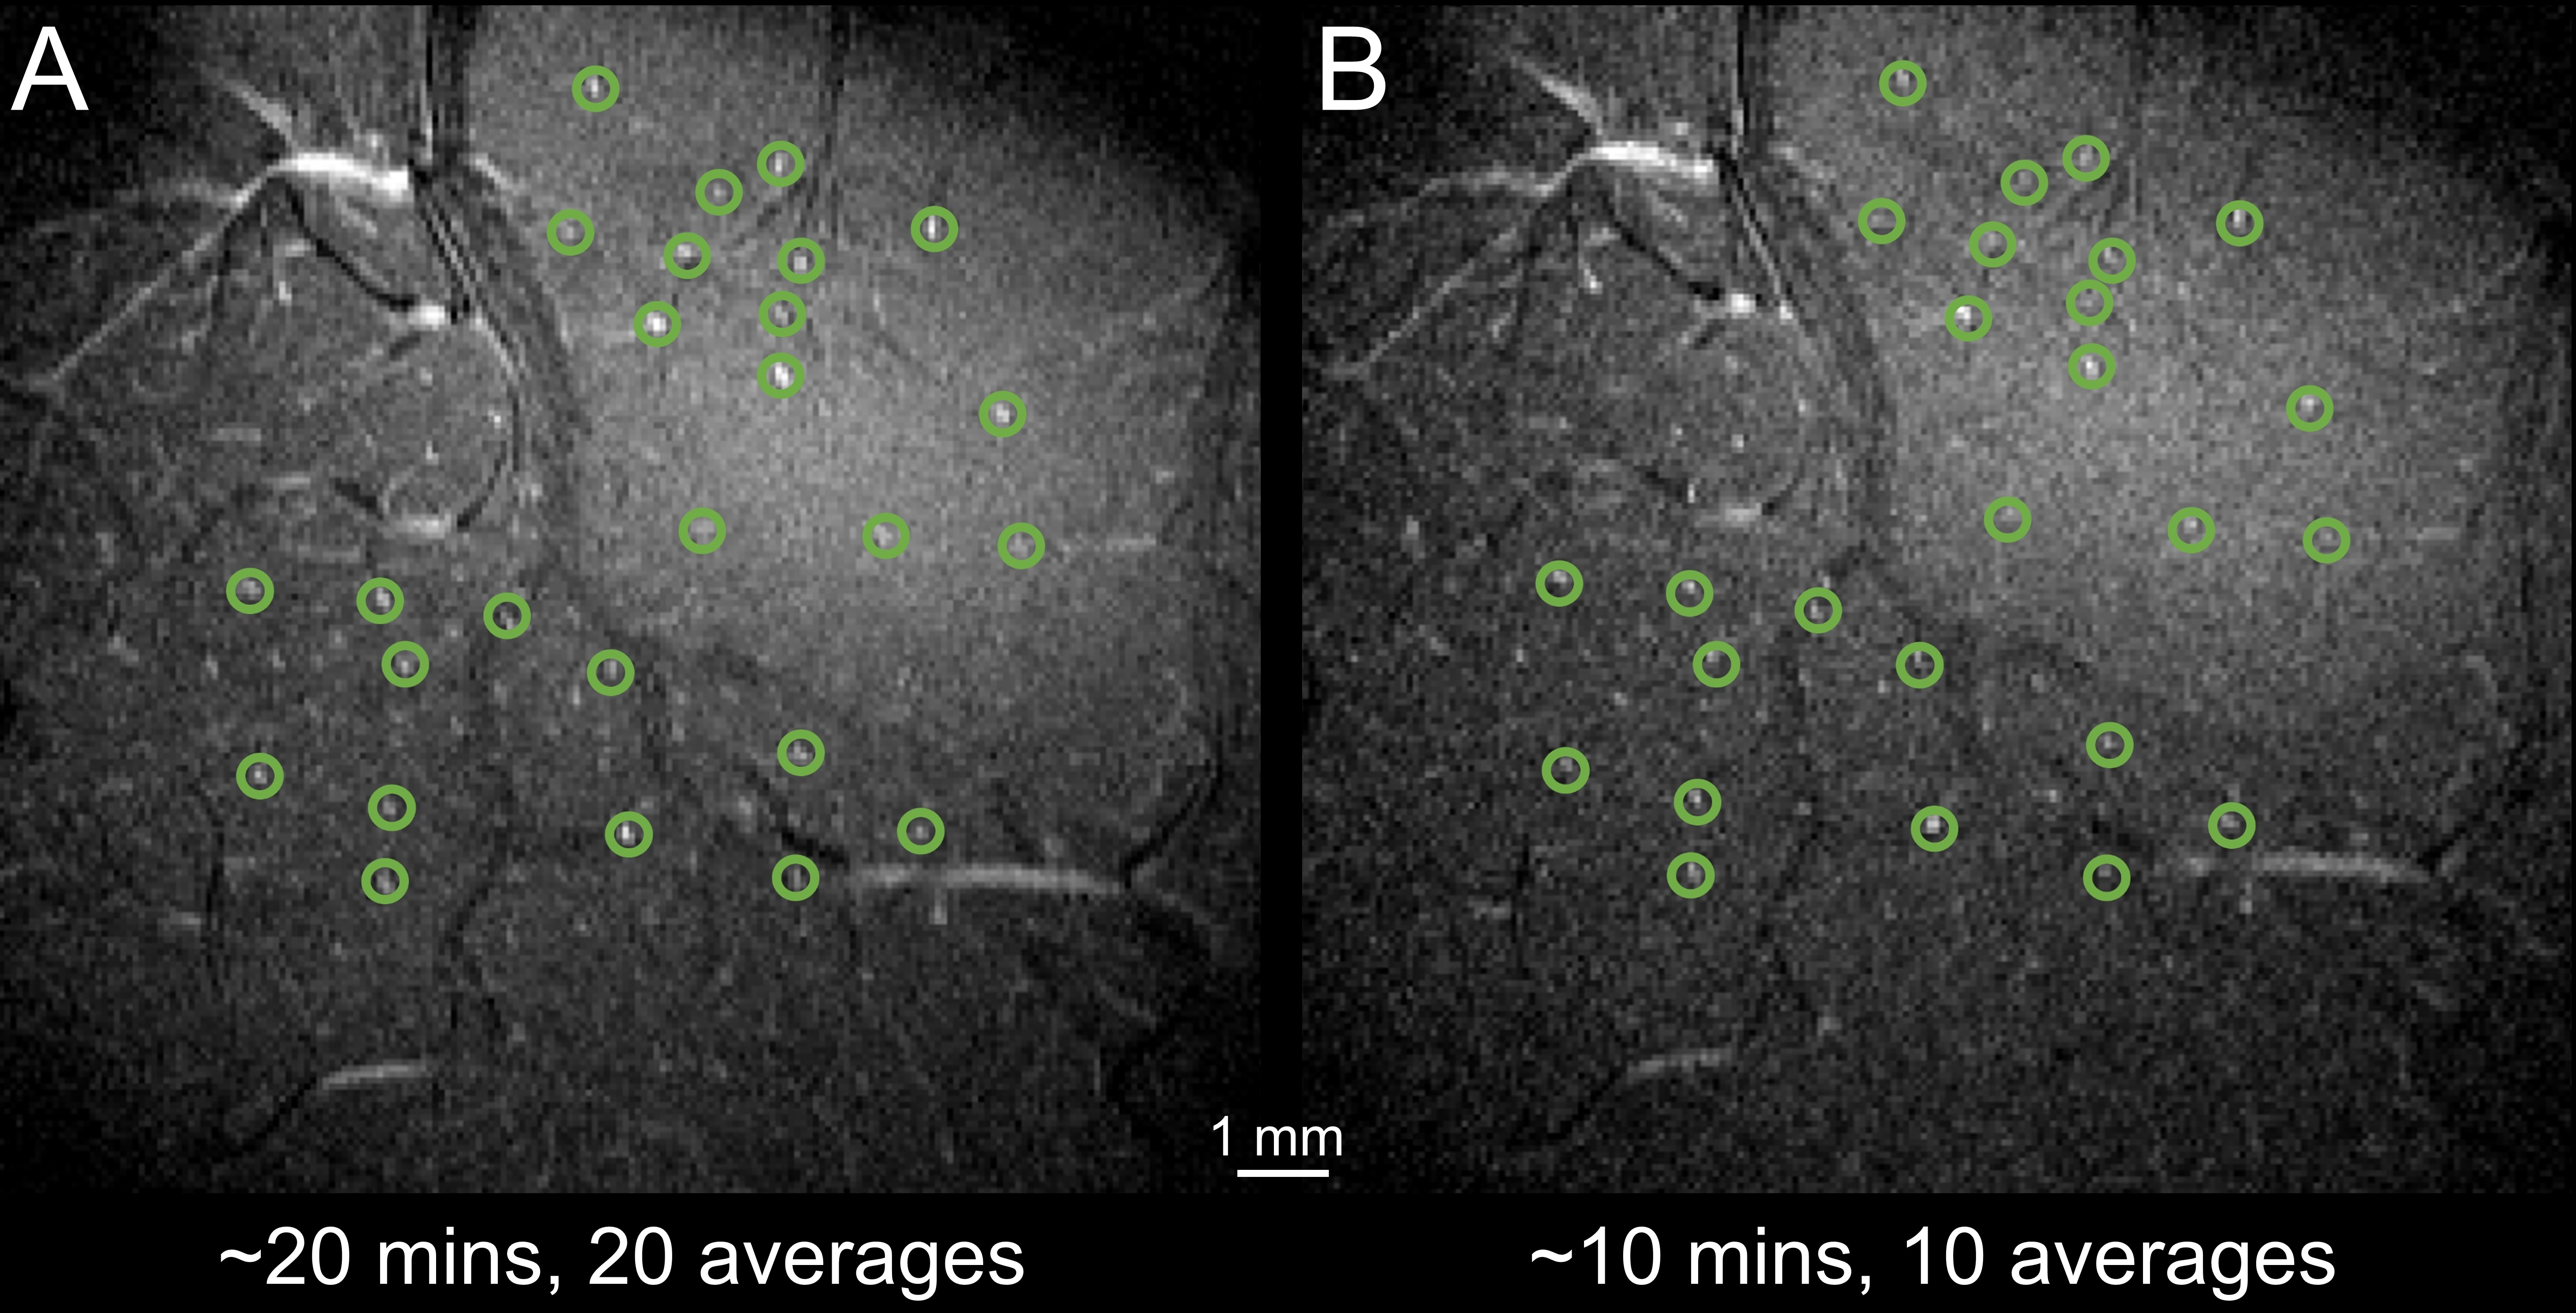
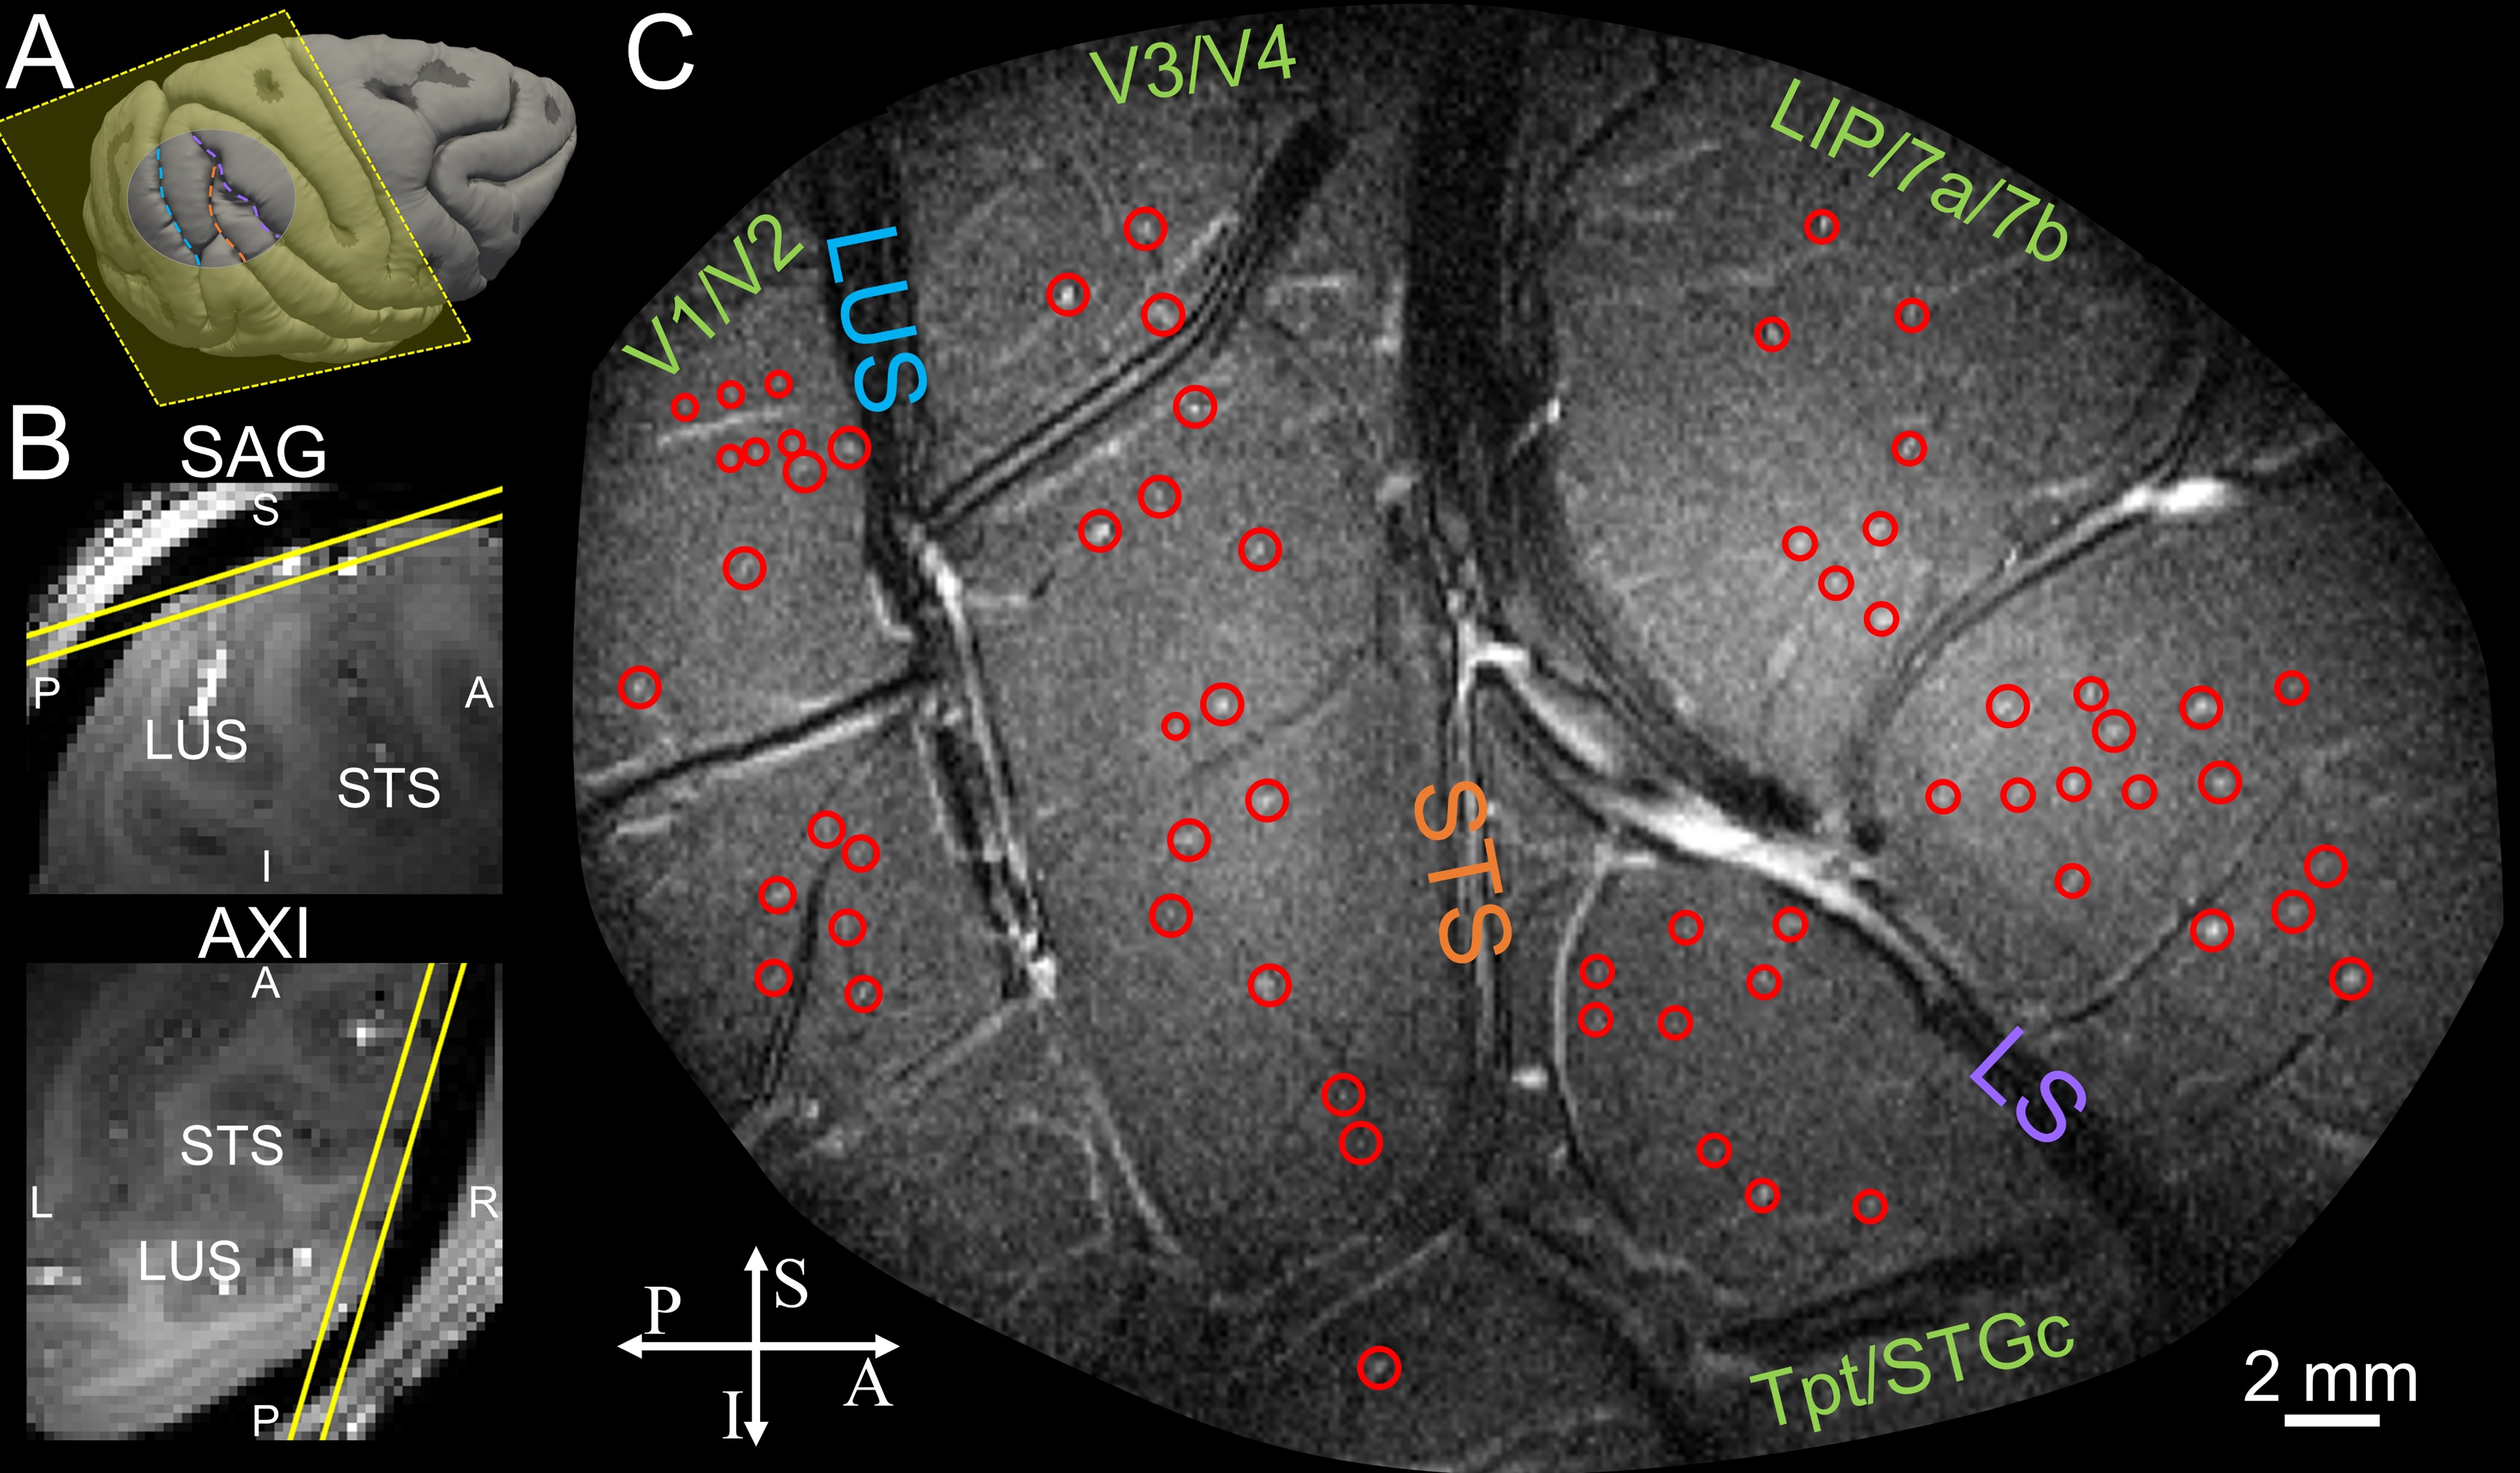
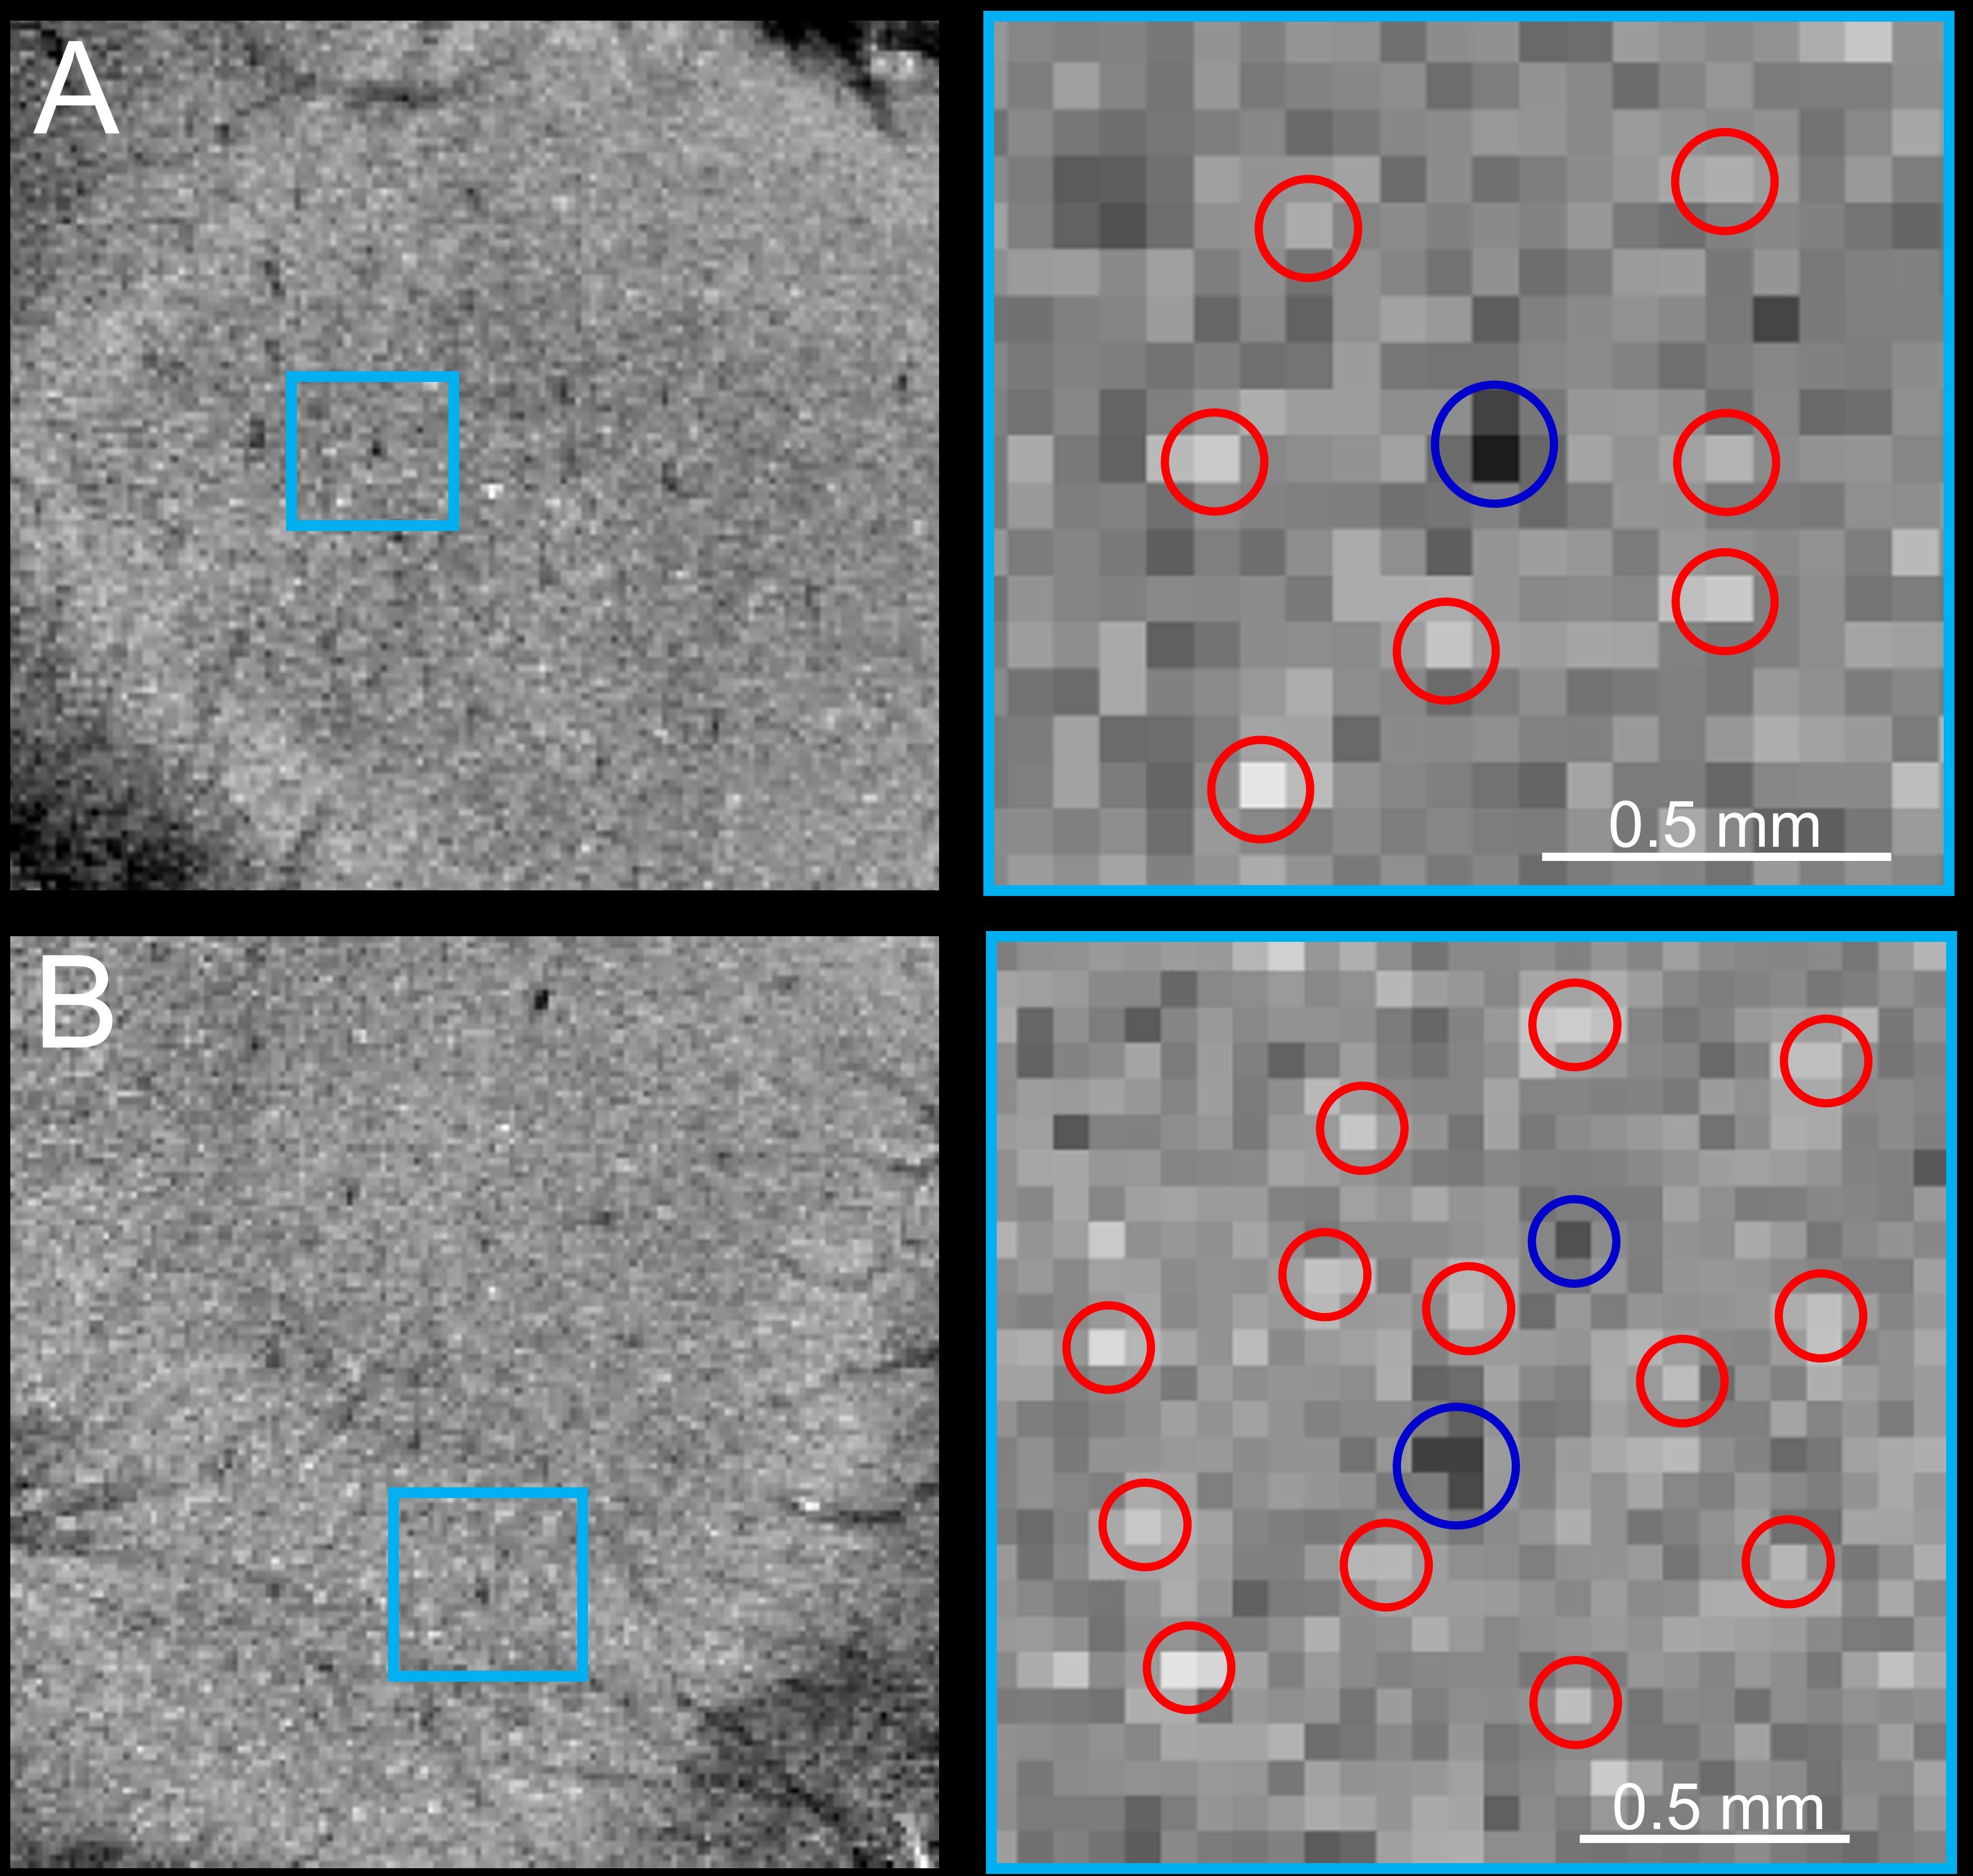
Simulated TOF images (Fig. 1A) demonstrate that a vessel as narrow as 20 μm in diameter with velocity as low as 10 mm/s is detectable (bottom left); detectability increased both with increasing diameter (40 μm, bottom right) and velocity (50 mm/s, top right). The optimal TR value varies with estimated velocity and FA (Fig. 1B). For 40° to 60°, blood-tissue contrast reaches a plateau at ~80 ms TR and at ~40 ms TR for vessels with low velocity (10 mm/s) and higher velocity (20 mm/s), respectively. The optimal FA also depends on blood velocity, as shown by the decreasing contrast at increased FA for vessels with slow flow (e.g., 5 mm/s) in Fig. 1C. Imaging macaque visual cortex using the optimal parameters reveals that the vessel detectability agrees well with simulation predictions (Fig. 1D). Qualitatively, vessels are faintly detected in all acquired images, however, vessel-tissue contrast is indeed highest at TR=60 ms and FA=60°, confirming that this protocol yielded higher detectability (Fig. 1E). Fig. 2 shows imaging of V1 and V2 is highly reproducible across different runs on the same day (A and B) and on different days (C, 30 days apart). To examine the duration of scanning needed, we found that high-quality images could be obtained with both 20-minute scans (Fig. 3A) as well as shorter 10-minute scans (Fig. 3B). Fig. 4 shows that intracortical vessels are observed at locations where the surface normal of the cortical gyrus is perpendicular to the imaging slice. This permitted simultaneous imaging across multiple areas (Fig. 4), such as V2, V4 and LIP, demonstrating opportunities to study multi-areal organization with vessel-specific resolution. Fig. 5 shows the detection of a cluster of arterial-venous units, comprising a venule surrounded by 5-9 arterials (Fig. 5A and 5B), similar to previous histologically findings9,10. Arterioles appear bright because of inflow effects while venules appear darker because of the fast T2* decay associated with higher concentration of deoxyhemoglobin. The diameter of a unit is ~0.7–1.3mm. The mean distance from arterioles to the central venule of the unit is 444μm (± 35μm).Discussion and Conclusion
Our data show that the spacing of nearby intracortical vessels is roughly similar to mesoscale (columnar) functional organization11, possibly supporting the notion of a vasculature-functional domain unit10,12–15. We present the first example of intracortical arterioles imaged in vivo in primates using a standard human 7T MRI scanner, illustrating that micron-scale vessels with slow blood flow are detectable non-invasively. This extends the capabilities of MRI for studying cerebrovasculature.Acknowledgements
This work was supported in part by STI 2030—Major Projects (2021ZD0200401to A.W.R.), the National Natural Science Foundation of China (U20A20221, 819611280292), the Key Research and Development Program of Zhejiang Province (2020C03004), MOE Frontier Science Center for Brain Science & Brain-Machine Integration (Zhejiang University), the Fundamental Research Funds for the Central Universities, NIH NIBIB (grants P41-EB030006 and R01-EB032746), NIA (grant RF1-AG074008), NIMH (grant U54-MH118919), and by the BRAIN Initiative (NIH NIMH grant R01-MH111419 and NIH NINDS grants U19-NS123717 and U19-NS128613).References
1. Bolan PJ, Yacoub E, Garwood M, Ugurbil K, Harel N. In vivo micro-MRI of intracortical neurovasculature. NeuroImage. 2006;32(1):62-69.
2. Park SH, Masamoto K, Hendrich K, Kanno I, Kim SG. Imaging brain vasculature with BOLD microscopy: MR detection limits determined by in vivo two-photon microscopy. Magn Reson Med. 2008;59(4):855-865.
3. Yu X, He Y, Wang M, et al. Sensory and optogenetically driven single-vessel fMRI. Nat Methods. 2016;13(4):337-340.
4. Schmid F, Barrett MJP, Jenny P, Weber B. Vascular density and distribution in neocortex. NeuroImage. 2019;197:792-805.
5. Zhang H, Fu P, Liu Y, et al. Large-depth three-photon fluorescence microscopy imaging of cortical microvasculature on nonhuman primates with bright AIE probe In vivo. Biomaterials. 2022;289:121809.
6. Bollmann S, Mattern H, Bernier M, et al. Imaging of the pial arterial vasculature of the human brain in vivo using high-resolution 7T time-of-flight angiography. eLife. 2022;11:e71186.
7. Zong X, Lin W. Quantitative phase contrast MRI of penetrating arteries in centrum semiovale at 7T. NeuroImage. 2019;195:463-474.
8. Zhang X, Zhang J, Gao Y, et al. A 16-Channel Dense Array for In Vivo Animal Cortical MRI/fMRI on 7T Human Scanners. IEEE Trans Biomed Eng. 2021;68(5):1611-1618.
9. Duvernoy HM, Delon S, Vannson JL. Cortical blood vessels of the human brain. Brain Research Bulletin. 1981;7(5):519-579.
10. Adams DL, Piserchia V, Economides JR, Horton JC. Vascular Supply of the Cerebral Cortex is Specialized for Cell Layers but Not Columns. Cereb Cortex. 2015;25(10):3673-3681.
11. Nonaka H, Akima M, Nagayama T, Hatori T, Zhang Z, Ihara F. Microvasculature of the human cerebral meninges. Neuropathology. 2003;23(2):129-135.
12. O’Herron P, Chhatbar PY, Levy M, et al. Neural correlates of single-vessel haemodynamic responses in vivo. Nature. 2016;534(7607):378-382.
13. Blinder P, Tsai PS, Kaufhold JP, Knutsen PM, Suhl H, Kleinfeld D. The cortical angiome: an interconnected vascular network with noncolumnar patterns of blood flow. Nat Neurosci. 2013;16(7):889-897.
14. Cox SB, Woolsey TA, Rovainen CM. Localized Dynamic Changes in Cortical Blood Flow with Whisker Stimulation Corresponds to Matched Vascular and Neuronal Architecture of Rat Barrels. J Cereb Blood Flow Metab. 1993;13(6):899-913.
15. Zheng D, LaMantia A, Purves D. Specialized vascularization of the primate visual cortex. J Neurosci. 1991;11(8):2622-2629.
Figures