1129
Charting vascular network architecture in primate brain using ferumoxytol-weighted laminar MRI1Center for Biosystems Dynamics Research, RIKEN, Kobe, Japan, 2Siemens Healthcare K.K., Tokyo, Japan, 3Department of Neuroscience, Washington University Medical School, St. Louis, MO, United States, 4Department of Radiology, Washington University Medical School, St. Louis, MO, United States
Synopsis
Keywords: Blood Vessels, Blood vessels
Motivation: Although the brain's vascular network plays a crucial role in supplying oxygen and glucose while removing metabolic by-products to meet the high energy demands of neural information processing, our understanding of the vascular network architecture in the primate brain remains limited.
Goal(s): To address this issue, our study aims to explore the variability of the vascular network and its relationship to underlying neuroanatomy.
Approach: We investigate brain vascularity in macaque monkeys using ferumoxytol-weighted laminar MRI.
Results: We demonstrate that vascularity exhibits 3-fold variation across brain regions, moderate variability across cortical layers, distinct translaminar clusters, and strong association with neuron and synaptic densities.
Impact: Laminar ferumoxytol-weighted MRI shows considerable potential to delineate pial vessel network, intracortical feeding arteries and draining veins and density of capillary networks. The capillary density exhibits close association with the underlying neuroanatomy.
Introduction
Mapping the vascular organization of the brain is of great importance to the fields of diagnostic radiology and neurology, and is relevant in a variety of basic neuroimaging research areas as well. However, the intricate task of mapping individual vessels across brain regions and cortical layers presents significant challenges, resulting in a limited understanding of development of the brain’s vasculature. To address this issue, here we investigate whole-brain vascular volume distribution using ferumoxytol-weighted laminar multi-echo gradient-echo imaging in macaque monkeys. We validate the results with published ‘ground-truth’ data for vascular densities1,2 and compare the vascularity with neuron and synaptic densities of the cerebral cortex3,4,5.Methods
Experiments were performed using a 3T MRI scanner (Prisma, Siemens) equipped with a custom-made 24-channel coil for macaque brain6. The experiments were conducted in accordance with the institutional guidelines. Macaque monkeys (N=4) were anesthetized using isoflurane.For cortical surface creation, structural T1w and T2w images (0.5 mm isotropic) were acquired. Gradient- and RF-spoiled 3D multi-echo gradient-echo images (0.32 mm isotropic, no partial Fourier, ten equidistant TEs, GRAPPA=2) were acquired before and after (12 mg/kg) ferumoxytol (AMAG Pharmaceuticals Inc, USA) injection. The total acquisition time before and after ferumoxytol injection were 40 and 120 min, respectively. Auxiliary ferumoxytol-weighted experiment was performed using vessel-density informed spatial resolution (0.23 mm isotropic and three TEs; N=1).
Data preprocessing was performed using non-human primate version of the human connectome project (NHP-HCP) pipeline6,7. R2*-fitting was performed using hMRI Toolbox8. Baseline R2* was subtracted from the post-ferumoxytol R2* maps to calculate ferumoxytol induced change (ΔR2*)9. The data was mapped into twelve native equivolumetric layers (ELs) using the Workbench command ‘-volume-to-surface-mapping’. Each vertex was corrected for normal of the cortex relative to B0 direction10. Laminar ΔR2* profiles were parcellated using the M132 brain atlas11 and hierarchical clustering was applied (Ward’s method). The dense ΔR2* was denoised using PCA and translaminar similarity was also investigated Pearson’s correlation coefficient. Additionally, the number of vessels were determined in volume using Frangi-filter12 and in the ELs using gradient-ridges. In V1, vessel surface density was calculated by dividing the number of vessels by the surface area of each EL.
Results
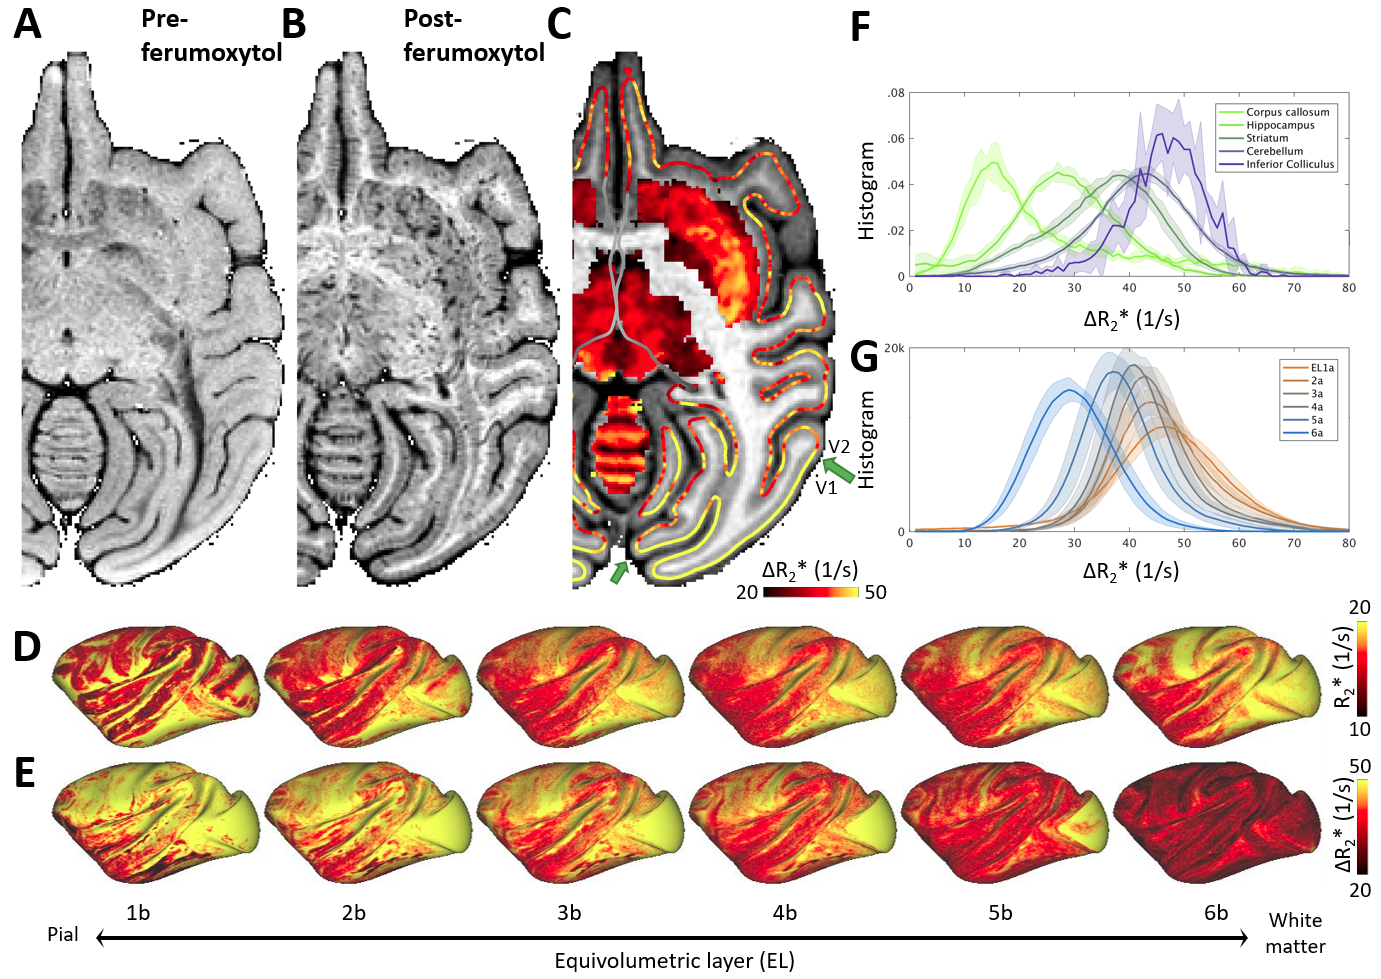
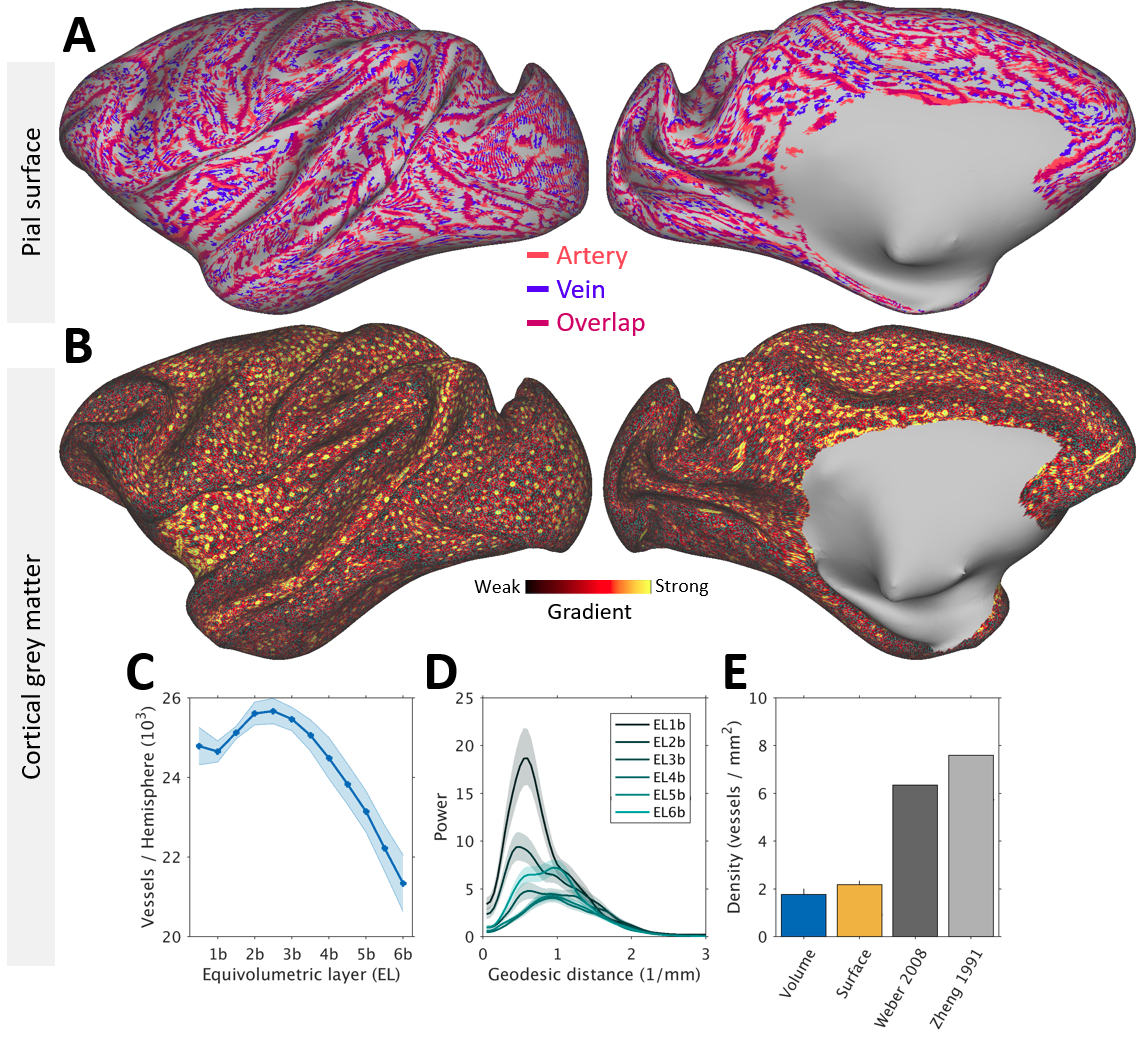
Figure 1 displays representative gradient-echo images before (Fig. 1A) and after (Fig. 1B) ferumoxytol injection (N=1). The R2* and ΔR2*, an indirect proxy measure of CBV9, volume maps for each subject were mapped onto the twelve native ELs (Fig. 1C) and averaged across the subjects (Fig. 1E,G). In subcortical structures, we found highest CBV in the inferior colliculus and lowest in the corpus callosum (Fig. 1F).Large vessels exhibited continuous signal-dropouts in the superficial gray matter enabling us to chart the pial vessel network (Fig. 2A). By critically adjusting the (spatial) resolution according to vessel surface density1,2, we also identified 24,000 ± 2,000 vessels per hemisphere. In V1, vessel density was ≈30% of the anatomical ground-truth (Fig. 2B-E).
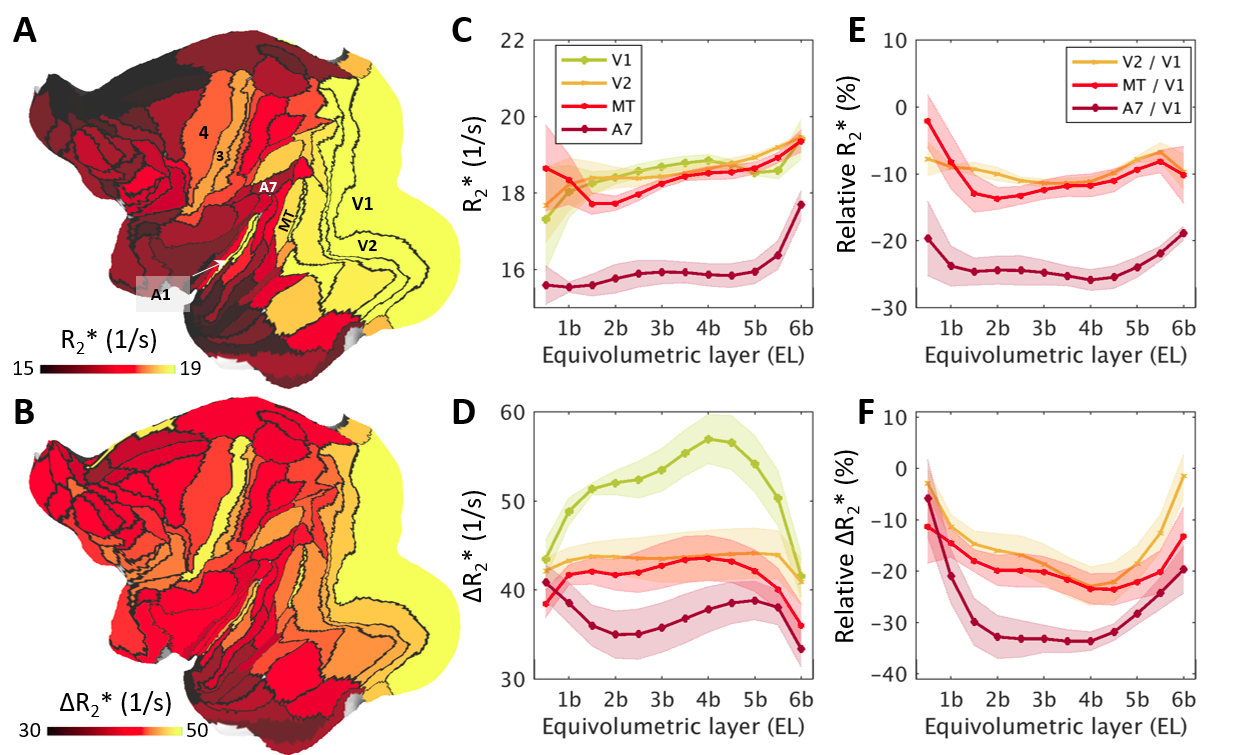
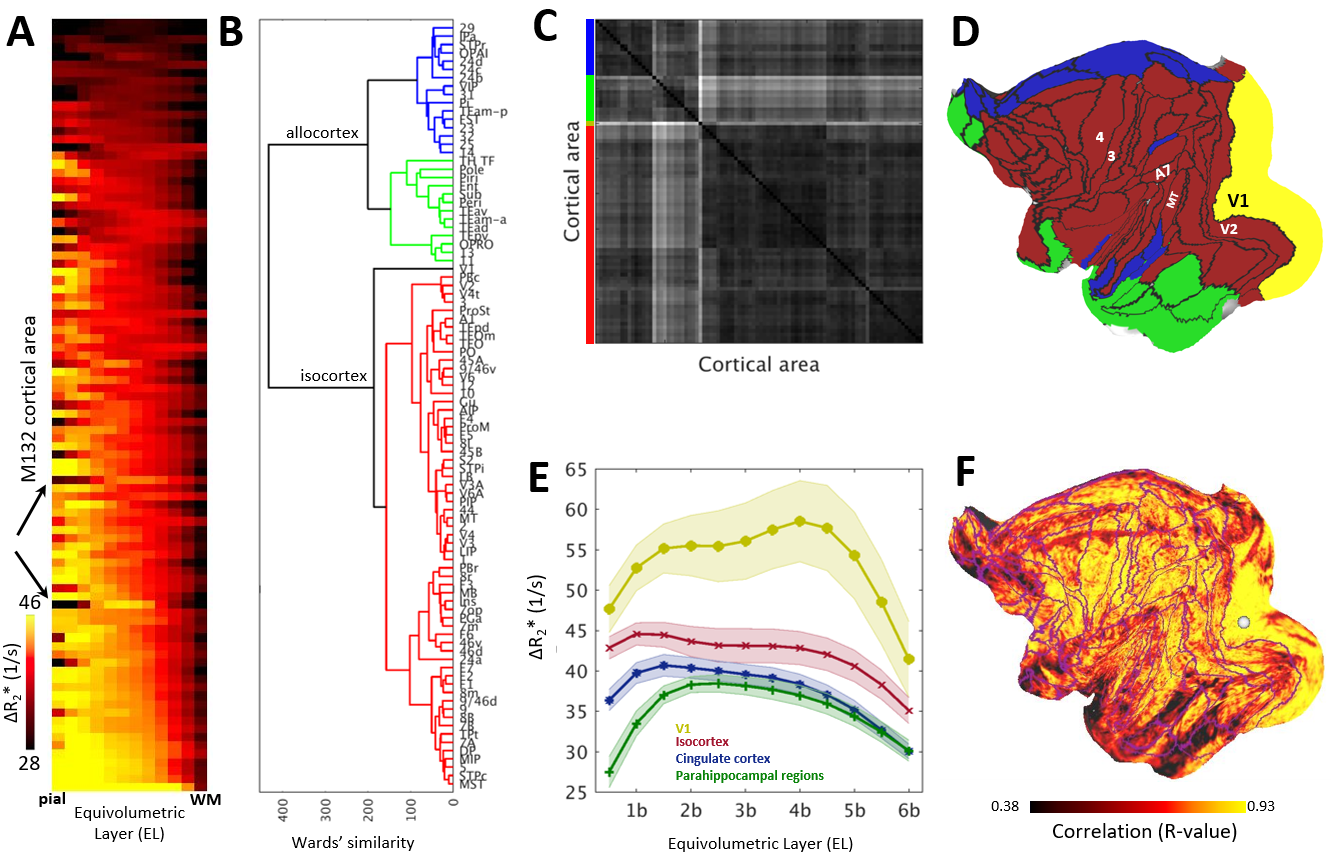
Across layers, R2* and ΔR2* profiles exhibited moderate variability (Fig. 3A,B, Fig. 4A). V1 showed denser vascularity in EL4b, which approximately corresponds to thalamic input layer, than in the surrounding cortical areas (Fig. 3B,D,F). The V2/V1 ΔR2* ratio in EL4b (77% ± 5%) (Fig. 3F) was also in excellent agreement with the ground-truth1,2. Agglomerative clustering revealed distinct groups of vascularity arranged between iso- and allocortical regions (Fig. 4B-E). V1 exhibited distinctive vascularization (Fig. 4B,D-F).
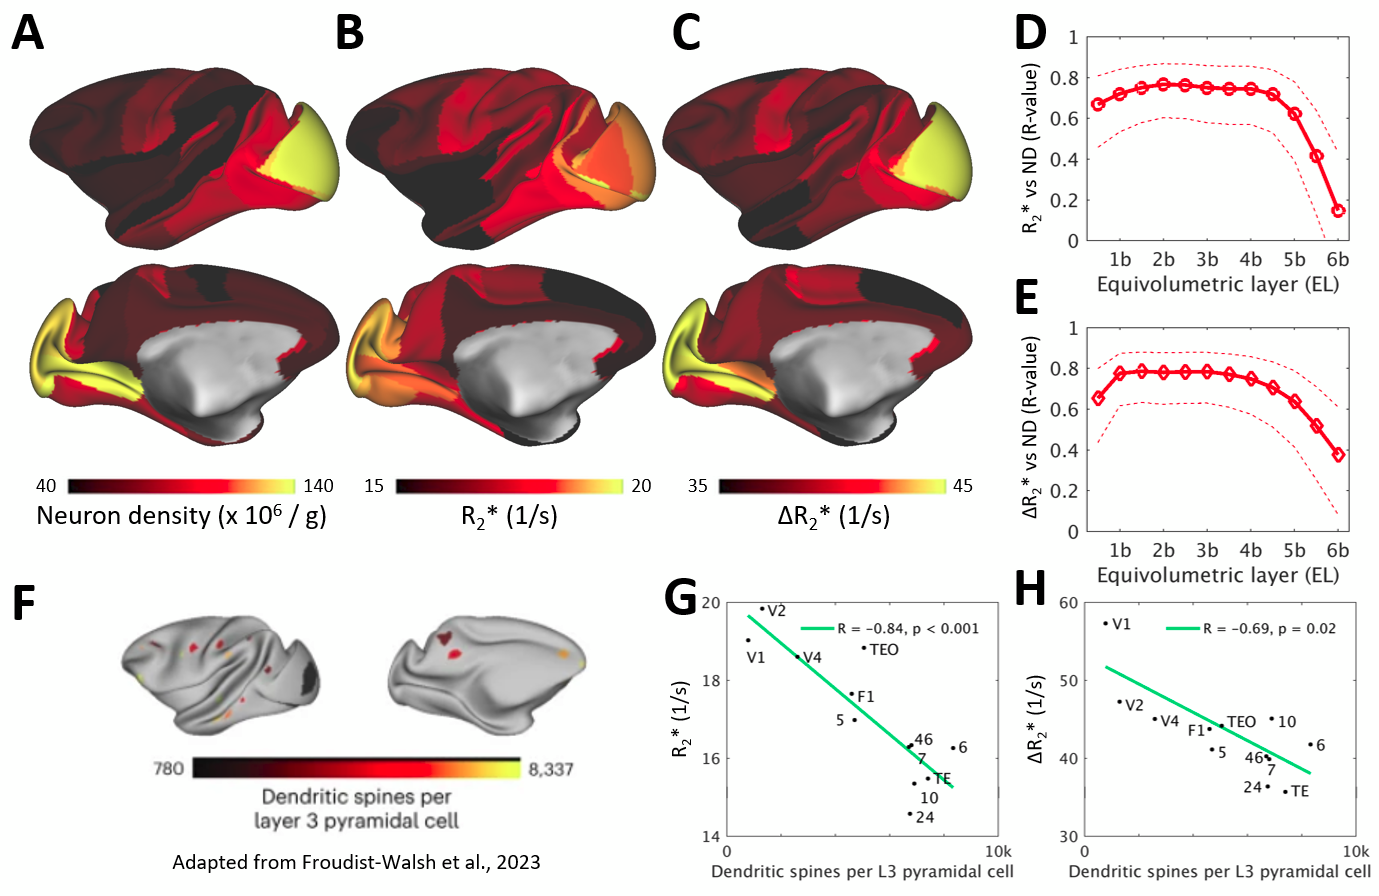
We next compared ΔR2* surface maps with quantitative neuron density maps3 using manually determined sample boundaries (Fig. 5A,C). Our analyses revealed that cerebrovascular volume is positively correlated with neuron density (R = 0.81, p < 10-20; Fig. 5E) and anticorrelated with the number of dendritic spines (R = -0.69, p = 0.02; Fig. 5H)4,5. Additionally, we discovered that baseline R2* was highly correlated with neuron density and anticorrelated with number of spines (Fig. 5B,D,G).
Discussion
We presented a noninvasive methodology to evaluate translaminar variations in vascular network architecture in the primate cerebral cortex. The quantitative cortical layer thickness adjusted ferumoxytol-weighted MRI enables exploration of systematic variations in energy supply architecture whereas vessel-frequency informed image acquisition enables benchmarking penetrating vessel density measures relative to the ‘ground-truth’. Furthermore, our findings establish a correlation between heterogeneous vascularity and neuroanatomical factors in the primate brain, in line with the view that neurons account for the majority (≈80%) of the brain’s energy budget13. The surface visualization of the pial and intracortical vessel networks may have clinical utilities.Conclusion
Our study provides methodological and conceptual advancements toward next-generation cerebrovascular MRI and a framework to benchmark cerebrovascular measures with regards to the anatomical ground-truth.Acknowledgements
The authors appreciate discussions and technical contributions from Akiko Uematsu, Timothy S. Coalson, Katsutoshi Murata, and Reiko Kobayashi. This research is partially supported by JSPS KAKENHI Grant Number (JP20K15945, JAA), by the program for Brain/MINDS and Brain/MINDS-beyond from Japan Agency for Medical Research and development, AMED (JP20dm037006, TH) and by NIH R01MH60974 (DCVE, MFG).References
1Zheng et al., 1991 Specialized vascularization of the primate visual cortex. J. Neurosci. 11 2622-2629.
2Weber et al., 2008 The Microvascular System of the Striate and Extrastriate Visual Cortex of the Macaque. Cereb. Cortex 18, 2318–2330.
3Collins, C.E., et al., 2010. Neuron densities vary across and within cortical areas in primates. PNAS 107, 15927–15932
4Elston, G.N., 1997. The occipitoparietal pathway of the macaque monkey: comparison of pyramidal cell morphology in layer III of functionally related cortical visual areas. Cereb. Cortex N. Y. N 1991 7, 432–452.
5Froudist-Walsh, S., 2023. Gradients of neurotransmitter receptor expression in the macaque cortex. Nat. Neurosci. 26, 1281–1294.
6Autio, J.A., et al., 2020. Towards HCP-Style macaque connectomes: 24-Channel 3T multi-array coil, MRI sequences and preprocessing. NeuroImage 215, 116800.
7Glasser, M.F., et al., 2013. The minimal preprocessing pipelines for the Human Connectome Project. NeuroImage 80, 105–124.
8Tabelow, K., et al., 2019. hMRI - A toolbox for quantitative MRI in neuroscience and clinical research. NeuroImage 194, 191–210.
9Boxerman, J.L., et al., 1995. MR contrast due to intravascular magnetic susceptibility perturbations. Magn. Reson. Med. 34, 555–566.
10Ogawa, S., et al., 1993. Functional brain mapping by blood oxygenation level-dependent contrast magnetic resonance imaging. A comparison of signal characteristics with a biophysical model. Biophys. J. 64, 803–812.
11Markov, N.T., et al., 2014. A Weighted and Directed Interareal Connectivity Matrix for Macaque Cerebral Cortex. Cereb. Cortex 24, 17–36
12Frangi, A.F., et al., 1998. Multiscale vessel enhancement filtering. Medical Image Computing and Computer-Assisted Intervention. Springer, Berlin, Heidelberg, 130–137.
13Attwell, D., et al., 2001. An Energy Budget for Signaling in the Grey Matter of the Brain. J. Cereb. Blood Flow Metab. 21, 1133–1145Figures