1126
Mapping glymphatic solute transportation through the perivascular space of hippocampal arterioles with 14 Tesla MRI1A.A. Martinos Center for Biomedical Imaging, Massachusetts General Hospital, Boston, MA, United States, 2Harvard Medical School, Boston, MA, United States
Synopsis
Keywords: Small Animals, Vessels, Glymphatic
Motivation: The perivascular space (PVS) plays a crucial role in facilitating the clearance of waste products and the exchange of cerebrospinal fluid and interstitial fluid in the central nervous system.
Goal(s): However, the limited depth penetration of current imaging methods impedes the study of glymphatic dynamics in deep brain regions.
Approach: In this study, we introduced an ultra-high-resolution dynamic contrast-enhanced MRI mapping approach based on single-vessel multi-gradient-echo methods.
Results: This technique allowed the differentiation of penetrating arterioles and venules from adjacent parenchymal tissue voxels and enabled the detection of Gd-enhanced signals coupled to PVS of penetrating arterioles in the deep cortex and hippocampus.
Impact: The study revealed significant PVS-specific Gd signal enhancements, shedding light on glymphatic function in deep brain regions. These findings advance our understanding of brain-wide glymphatic dynamics and impaired waste clearance, warranting further exploration of their clinical relevance and therapeutic applications.
Introduction
The glymphatic system facilitates the dynamic interchange of cerebrospinal fluid (CSF) and interstitial fluid (ISF), contributing to maintaining regular physiological equilibrium and effectively removing interstitial substances1-4. Among the various compartments encompassing the intracranial interstitial extracellular space, the PVS between the astrocyte endfeet and the parenchymal perforating vessels has been proposed to play a crucial role underlying the glymphatic clearance5-9. Two-photon optical imaging studies have well described the glymphatic cerebrospinal fluid circulation through the PVS from the surface diving arteries10. And, the latest work has shown the glymphatic flow through PVS of surface diving arteries can be further regulated by neuronal activity of the adjacent cortex11. However, given the limited penetrating depth of the optical imaging method, the dynamic changes of glymphatic flow in the deep cortex or subcortical regions remain to be elucidated. In this study, we developed a novel DCE Magnetic resonance imaging (MRI) approach based on the single-vessel multi-gradient-echo (MGE) imaging scheme12,13 to measure Gd-enhanced PVS in mouse brains using a 14T preclinical MRI scanner.Methods
We used the 14T scanner equipped with a 1T/m gradient to acquire four sets MRI datasets using MGE sequence: 1) A 3D MGE sequence to map the accumulative glymphatic transportation in whole brain, with the following parameters: TR: 50 ms; TE: 2, 4.5, 7, 9.5 ms; flip angle: 85°; matrix: 256 × 256 x 160; in-plane resolution: 50 μm isotropic. We first acquired blood Gd-based flow maps with MGE MRI (tail-vein Gd infusion, 12nl/min for 0.1-0.2ml for 90 min), highlighting all vessel voxels as vascular control maps. Secondly, we acquired another set of MGE images with the intraventricular Gd infusion (20nl/min, for 1-2ul for 90 min). 2) A 2D MGE sequence to map the glymphatic transportation dynamics, with the following parameters: TR: 80 ms; TE: 2.5, 5.5, 8.5, 11.5ms; flip angle: 85°; matrix: 256 × 256; in-plane resolution: 50 × 50 μm2; slice thickness: 250 µm. Scan cycle:12.24s, repetition:120. MGE images were acquired with the intraventricular Gd infusion (100nl/min, 1ul for 10 min) starting at the 21st cycle. 3&4) 2D sequences to map PVS, with the following parameters: TR: 120 ms; TE: 2.95 & 3.69 ms; flip angle: 85°; matrix: 320 × 320; in-plane resolution: 20 x20 μm2 & 15 x15 μm2; slice thickness: 250 µm. We first acquired blood flow maps with MGE MRI, highlighting all vessel voxels as vascular control maps. Secondly, we acquired an iron-based flow map for dampening vessels, then we acquired another set of MGE images with the intraventricular Gd infusion (100nl/min, for 1ul for 10 min).Results
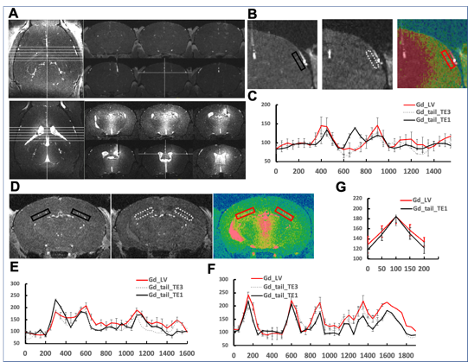
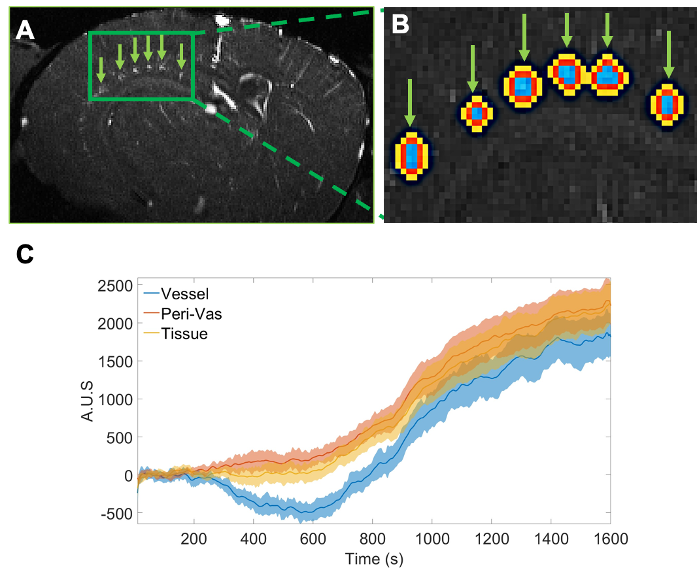
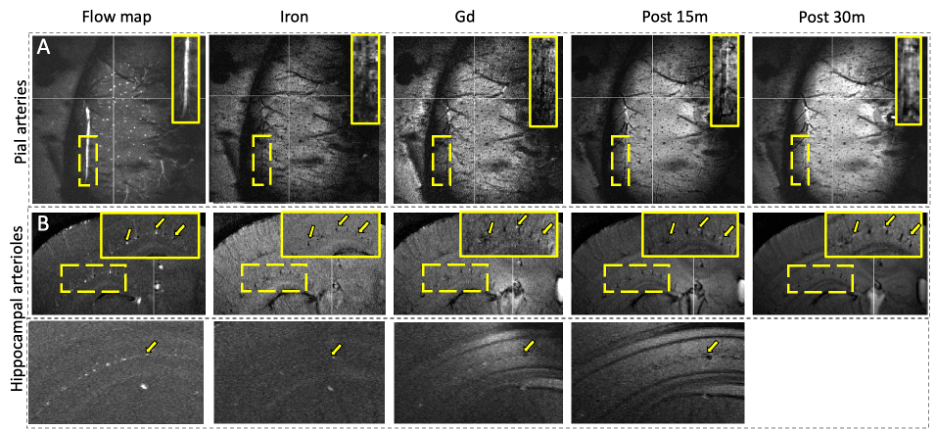
First, the 3D whole brain Gd-enhanced MR images were acquired with 50µm isotropic resolution (Fig 1), and 2D Gd-enhanced MR images were acquired with 20x20µm (Fig 3A&B) and 15x15µm (Fig 3C) in plane resolution using the MGE sequences. In the flow maps, vessels are indicated by bright signals, after intravenous iron injection, vessel signal were dampened, then after Gd infusion, there is a clear signal enhancement in the parenchyma regions near the ventricles. Second, the hippocampal single-vessel image was acquired with real-time intraventricular Gd infusion. The Gd-enhanced DCE signals from three different ROIs were plotted as the function of time before and after 10 min Gd infusion (Fig 2), demonstrating a salient early signal increase in the peri-vessel ROIs than the adjacent parenchymal tissue ROIs.Discussion
We distinguish vessels from PVS and adjacent parenchymal tissues with conventional MRI methodology by implementing a novel DCE MRI mapping scheme based on single-vessel MGE methods. The MGE sequence enables image acquisition at different echo times (TE). By setting a large flip angle with a short time of repetition (TR), we can highlight certain penetrating vessels based on their orientation to the MRI slices. Also, due to the different T2* values of the oxygenated and deoxygenated blood in arterioles and venules, it also offers a possibility to distinguish arterioles from venules. When Iron particles are infused into blood, it can dampen the blood signal due to T2* decay, providing a potential way to highlight the perivascular space near the vessels in ultra-high resolution MGE images. Thus, the MGE method offered an ideal image scheme to detect the penetrating micro-vessels, as well as its periarteriolar space, with unique orientation about the geometrical alignment of the MRI image field of view.Conclusion
The findings contribute to our understanding of glymphatic function and have the potential to shed light on neurological conditions where impaired waste clearance is implicated. Further research is warranted to explore the clinical implications and therapeutic potential of these discoveries.Acknowledgements
This research was funded by Alzheimer’s association (AARFD-23-1145375), NIH funding (RF1NS113278, RF1NS124778, R01NS122904, R21NS121642,), NSF grant 2123971, and the S10 instrument grant (S10 MH124733–01) to Martinos Center.References
1. Benveniste, H. et al. The Glymphatic System and Waste Clearance with Brain Aging: A Review. Gerontology 65, 106-119 (2019). https://doi.org:10.1159/000490349
2. Da Mesquita, S. et al. Functional aspects of meningeal lymphatics in ageing and Alzheimer’s disease. Nature 560, 185-191 (2018). https://doi.org:10.1038/s41586-018-0368-8
3. Kress, B. T. et al. Impairment of paravascular clearance pathways in the aging brain. Annals of neurology 76, 845-861 (2014). https://doi.org:10.1002/ana.24271
4. Zeppenfeld, D. M. et al. Association of Perivascular Localization of Aquaporin-4 With Cognition and Alzheimer Disease in Aging Brains. JAMA Neurol 74, 91-99 (2017). https://doi.org:10.1001/jamaneurol.2016.43705
5. Marina, N. et al. Astrocytes monitor cerebral perfusion and control systemic circulation to maintain brain blood flow. Nature communications 11, 131 (2020). https://doi.org:10.1038/s41467-019-13956-y
6. Kisler, K., Nelson, A. R., Montagne, A. & Zlokovic, B. V. Cerebral blood flow regulation and neurovascular dysfunction in Alzheimer disease. Nature Reviews Neuroscience 18, 419-434 (2017). https://doi.org:10.1038/nrn.2017.48
7. MacVicar, B. A. & Newman, E. A. Astrocyte regulation of blood flow in the brain. Cold Spring Harb Perspect Biol 7 (2015). https://doi.org:10.1101/cshperspect.a020388
8. Iliff, J. J. et al. A paravascular pathway facilitates CSF flow through the brain parenchyma and the clearance of interstitial solutes, including amyloid β. Sci Transl Med 4, 147ra111 (2012). https://doi.org:10.1126/scitranslmed.3003748
9. Attwell, D. et al. Glial and neuronal control of brain blood flow. Nature 468, 232-243 (2010). https://doi.org:10.1038/nature09613
10. Iliff, J. J. et al. A paravascular pathway facilitates CSF flow through the brain parenchyma and the clearance of interstitial solutes, including amyloid beta. Sci Transl Med 4, 147ra111 (2012). https://doi.org:10.1126/scitranslmed.3003748
11. Holstein-Rønsbo, S. et al. Glymphatic influx and clearance are accelerated by neurovascular coupling. Nature neuroscience 26, 1042-1053 (2023). https://doi.org:10.1038/s41593-023-01327-2
12. Yu, X. et al. Sensory and optogenetically driven single-vessel fMRI. Nature methods 13, 337-340 (2016). https://doi.org:10.1038/nmeth.3765
13. He, Y. et al. Ultra-Slow Single-Vessel BOLD and CBV-Based fMRI Spatiotemporal Dynamics and Their Correlation with Neuronal Intracellular Calcium Signals. Neuron 97, 925-939 e925 (2018). https://doi.org:10.1016/j.neuron.2018.01.025
Figures