1125
Towards a multi-parametric MRI-based myelin marker in the developing mouse brain1Bernard and Irene Schwartz Center for Biomedical Imaging, Department of Radiology, New York University Grossman School of Medicine, New York, NY, United States, 2Department of Neural and Behavioral Sciences, Penn State University, Hershey, PA, United States
Synopsis
Keywords: Biomarkers, Neuro
Motivation: Although several myelin markers have been introduced using MRI, their ability to accurately detect myelin has been limited in sensitivity and specificity.
Goal(s): MP-MRI shows promise in improving myelin mapping, but validating its effectiveness remains a challenge. Our aim is to create a MP-MRI indicator and verify its accuracy through 3D myelin histology.
Approach: We compared myelin histology in MOBP-eGFP mouse brains, which exhibit enhanced myelination with various MRI markers in the same subjects.
Results: We observed varying degrees of correlation between MRI markers and MOBP signals in different brain regions. Employing PLSR analysis revealed that MP-MRI has potential to enhance myelin mapping.
Impact: The integration of multiple MRI markers in multiparametric MRI has the potential to improve our capacity for mapping myelin in the brain. A direct biomarker of myelin would be highly impactful for management of patients with MS and de/dysmyelinating disorders.
Introduction
Myelin is crucial for maintaining normal brain function and is a primary target for treatment in disorders involving myelin dysfunction. MRI offers a range of adaptable tissue contrasts, including those based on tissue relaxation (T1, T2), magnetization transfer (MT), and diffusion properties, allowing for sensitive detection of myelin-related injuries. However, the sensitivity and specificity of these MRI parameters to myelin are not well-established, primarily due to the absence of a direct correspondence between them. In fact, a recent meta-analysis1 indicates that only a small number of MRI-based myelin markers show strong correlation with histological measurements and no single MRI myelin marker can accurately reflects histology.An encouraging strategy to enhance myelin specificity involves leveraging the unique advantages of multiple MRI contrasts, each focusing on a specific aspect of myelin. Statistical or multi-parameter modeling methods2,3 can effectively characterize myelin in this approach. For instance, combining information from MT and T2* MRI signals can enhance specificity in identifying cortical myelin4. It's essential to take into account potential collinearity among MRI parameters, and most importantly, accurate myelin histology data is crucial for validation.
In this study, we obtained multi-parametric MRI data from the MOBP-eGFP mouse brain, which exhibits increased myelination during postnatal development. We applied partial least square regression (PLSR), a method capable of mitigating collinearity among MRI parameters, to discern connections between the measured MOBP and MRI parameters.
Methods
MRI: Ex vivo MRI data from MOBP-eGFP mouse brain (postnatal day 14 (P14), 35 (P35), 56 (P56), n = 5) were acquired using a 7 Tesla MRI system at room temperature. Co-registered T1, T2, MTR, inhomogeneous MTR (ihMTR), and diffusion MRI metric maps (see Fig.1 for details) were acquired using the parameters shown in Fig. 1. 3D myelin histology was obtained from the same animals using serial two-photon tomography. Analysis: The ROIs were manually defined in the FA images and matching STPT images for the genu and splenium of the corpus callosum (gcc and scc), cerebral peduncle (cp), external capsule (ec), motor and sensory cortex (mCX and sCX). Average MRI parameters and MOBP intensities for each ROI were obtained.Results
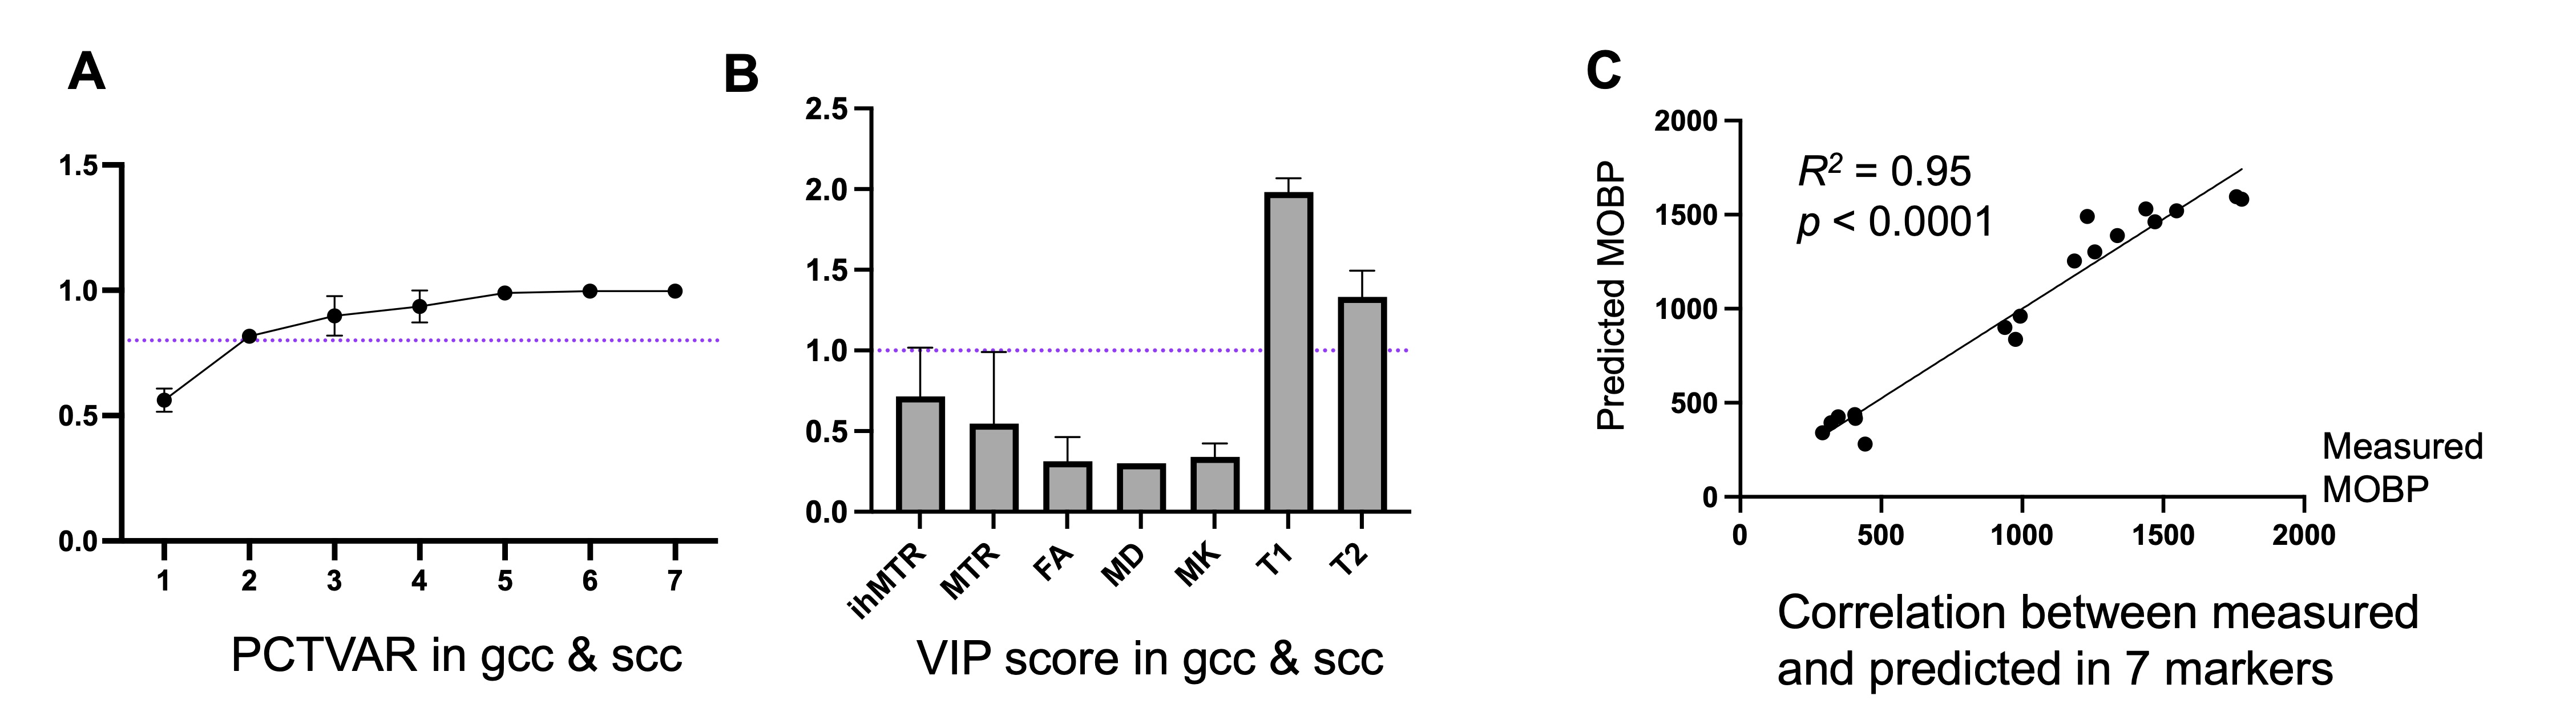
Multi-parametric MRI and histology of MOBP-eGFP mice: Fig. 1 shows representative maps of four representative MRI parameters and STPT data. The white matter (WM) and gray matter (GM) contrasts in MRI were relatively low at P14 due to low myelin content in mouse brain (myelination starts at around P7 in the mouse brain) and increased with age. In the cc (yellow arrow), time related changes in ihMTR, MTR, FA, and T2 can be appreciated. The correlation between MOBP values and MD and T1 were stronger than the other MRI parameters (Fig. 2). Correlation matrices for measurements from multiple ROIs (Fig. 3) showed collinearity among MRI parameters.PSLR-based myelin predictor: PSLR uses latent components to remove collinearity among input parameters. PSLR results of WM ROI data showed that 2 components were needed to explain 80% variance in WM MOBP signals (Fig. 4A), with major contributions from T1 and T2 (variable importance in projection > 1, Fig. 4B). The PSLR-predicted MBP values from MRI parameters showed strong correlations with actual MOBP signals (Fig. 4C).
Discussion
Our findings in the MOBP-eGFP mouse model align with prior research1. For instance, both MTR and T2 exhibited a robust correlation with MOBP signals in white matter, similar to ihMTR and T2 in gray matter regions (Fig. 3B & C). Notably, MD and T1 displayed strong correlations with MOBP signals in the corpus callosum (Fig. 2), but demonstrated comparatively weaker correlations with MOBP signals in other white matter regions (Fig. 3), indicating a complex relationship between them. The results from the PSLR analysis (Fig. 4) suggest that a combination of multiple MRI parameters is necessary to account for the observed variations in tissue MOBP signals. However, determining the optimal set of MRI parameters will necessitate further investigation.This study has several constraints. The utilization of ex vivo MRI, which is recognized to diverge from in vivo MRI, poses challenges in translating the findings to in vivo studies and mouse brains under pathological conditions. Additionally, while MOBP is expressed in both oligodendrocytes and myelin sheaths, there are other significant aspects of myelin, such as myelin lipids, which are not encompassed by the MOBP signals examined in this study. Furthermore, several MRI myelin markers, like myelin water fraction, were not part of this investigation. Consequently, future research is essential to further development of optimal MRI-based myelin markers.
Conclusion
The use of multi-parameter MRI can improve our capacity to identify and assess myelin in developmental myelination and remyelination.Acknowledgements
No acknowledgement found.References
1 Mancini, M. et al. An interactive meta-analysis of MRI biomarkers of myelin. Elife 9, doi:10.7554/eLife.61523 (2020).
2 Knight, M. J., Wearn, A., Coulthard, E. & Kauppinen, R. A. T2 Relaxometry and Diffusion Tensor Indices of the Hippocampus and Entorhinal Cortex Improve Sensitivity and Specificity of MRI to Detect Amnestic Mild Cognitive Impairment and Alzheimer's Disease Dementia. J Magn Reson Imaging 49, 445-455, doi:10.1002/jmri.26195 (2019).
3 Cercignani, M. & Bouyagoub, S. Brain microstructure by multi-modal MRI: Is the whole greater than the sum of its parts? Neuroimage 182, 117-127, doi:10.1016/j.neuroimage.2017.10.052 (2018).
4 Mangeat, G., Govindarajan, S. T., Mainero, C. & Cohen-Adad, J. Multivariate combination of magnetization transfer, T2* and B0 orientation to study the myelo-architecture of the in vivo human cortex. Neuroimage 119, 89-102, doi:10.1016/j.neuroimage.2015.06.033 (2015).
Figures
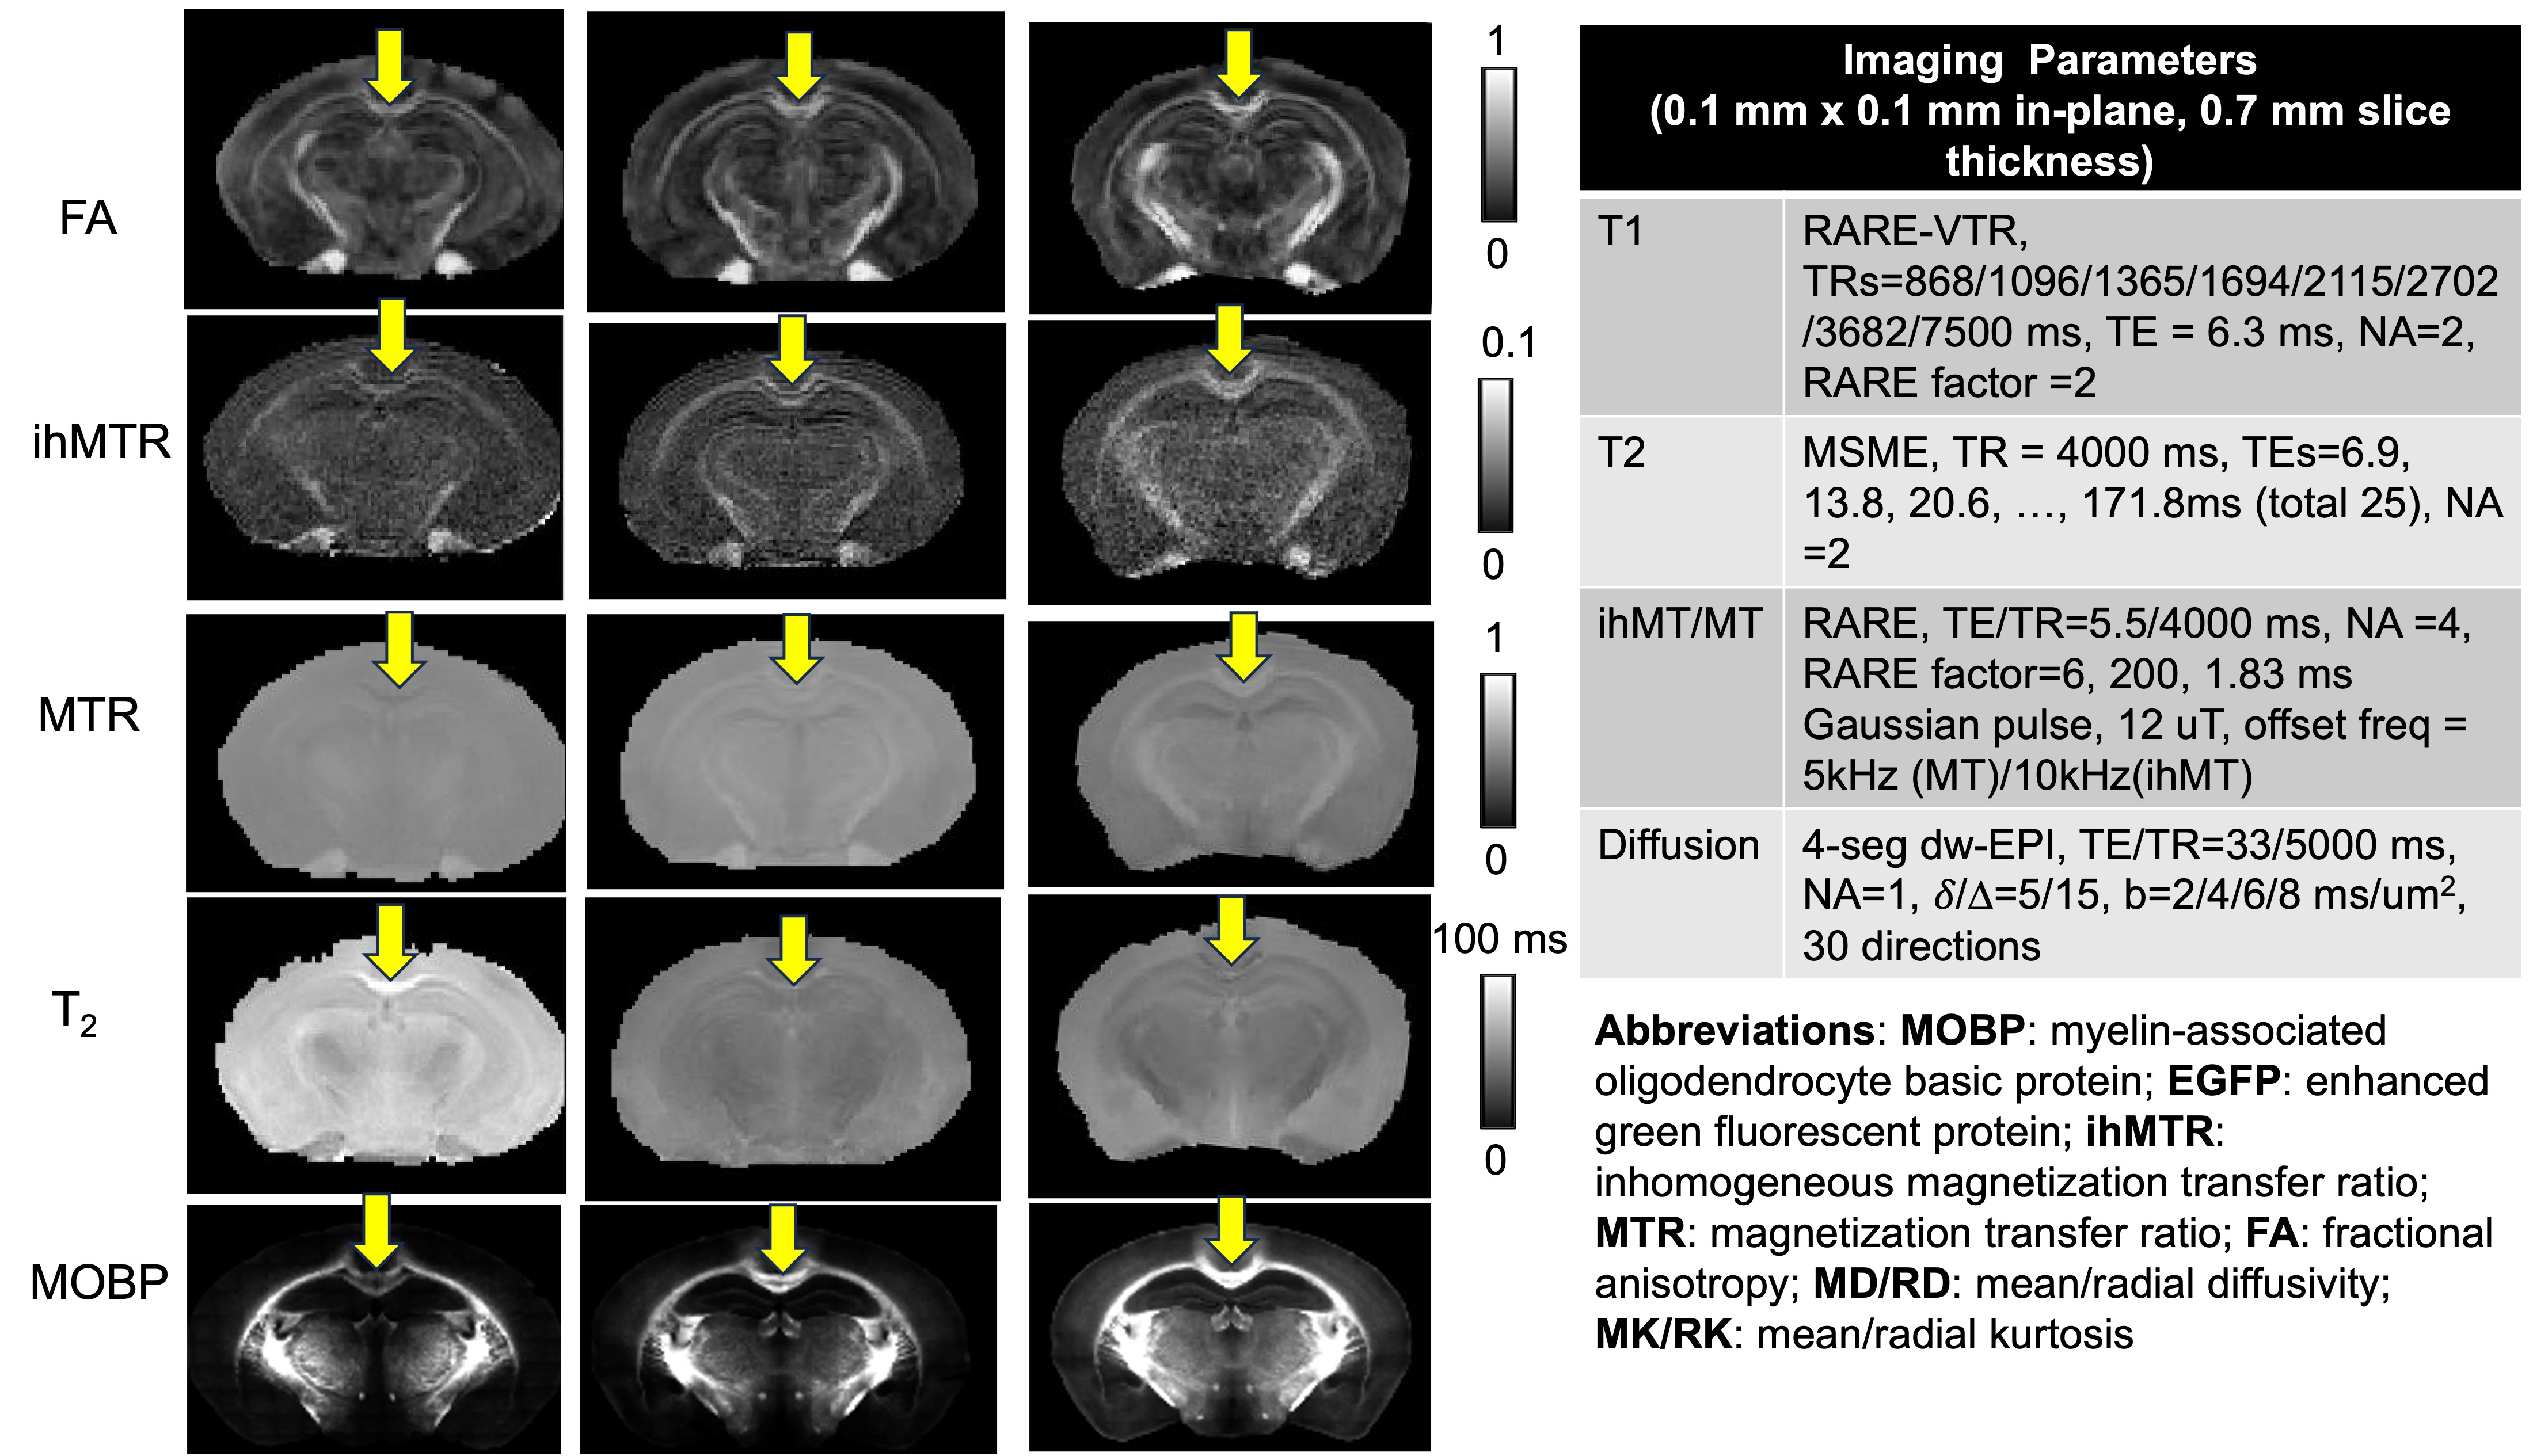
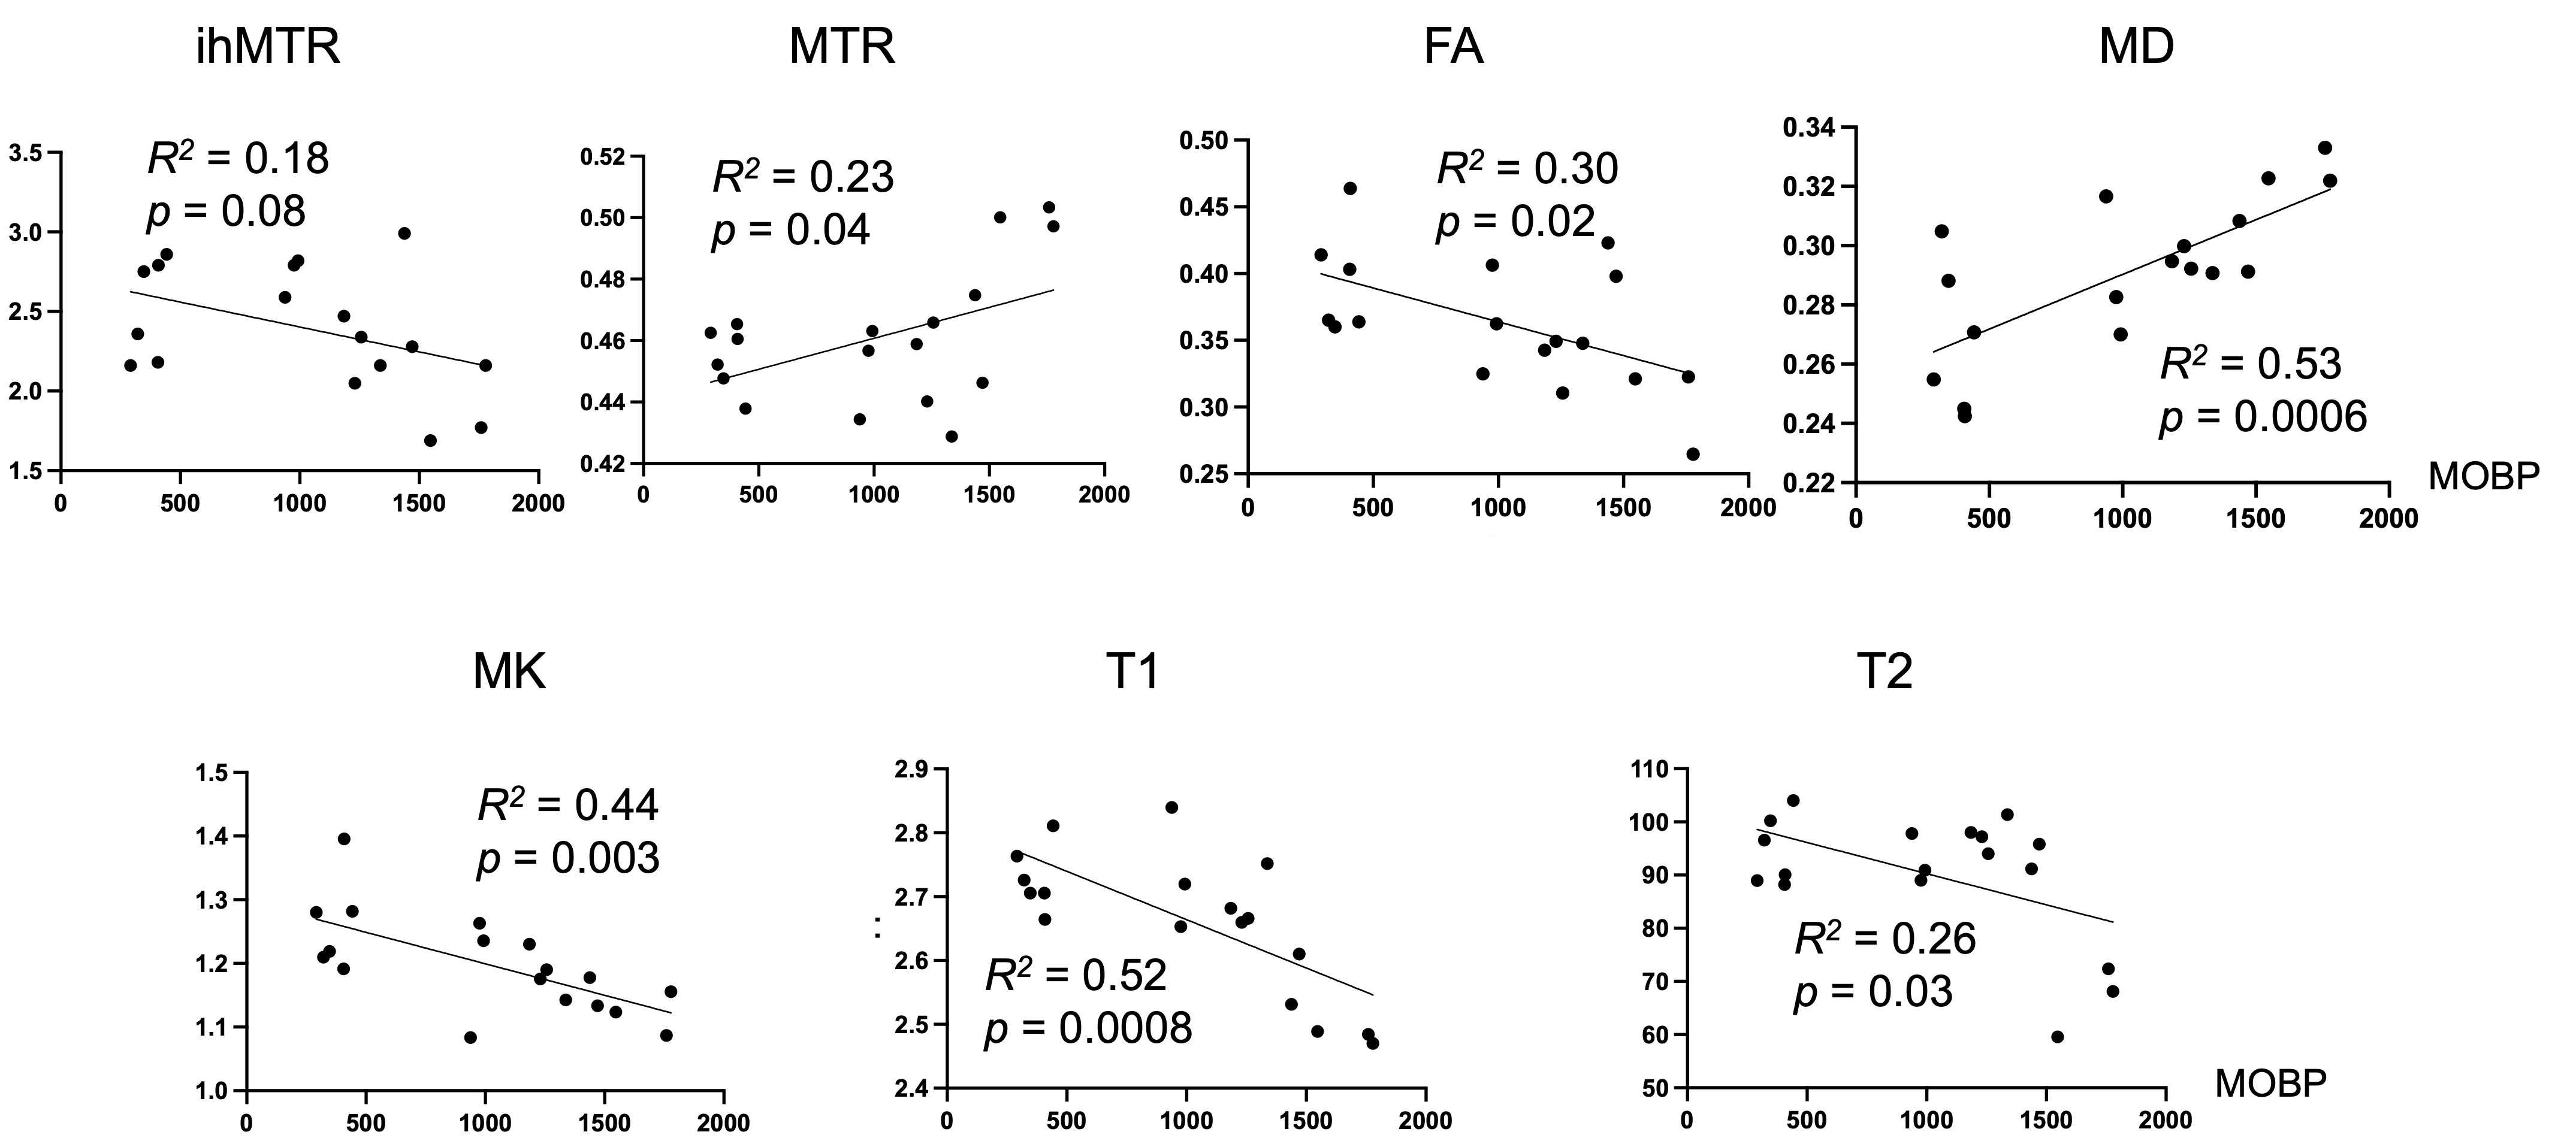
Fig. 2: Correlation plots between individual MR parameters and MOBP in the gcc and scc.
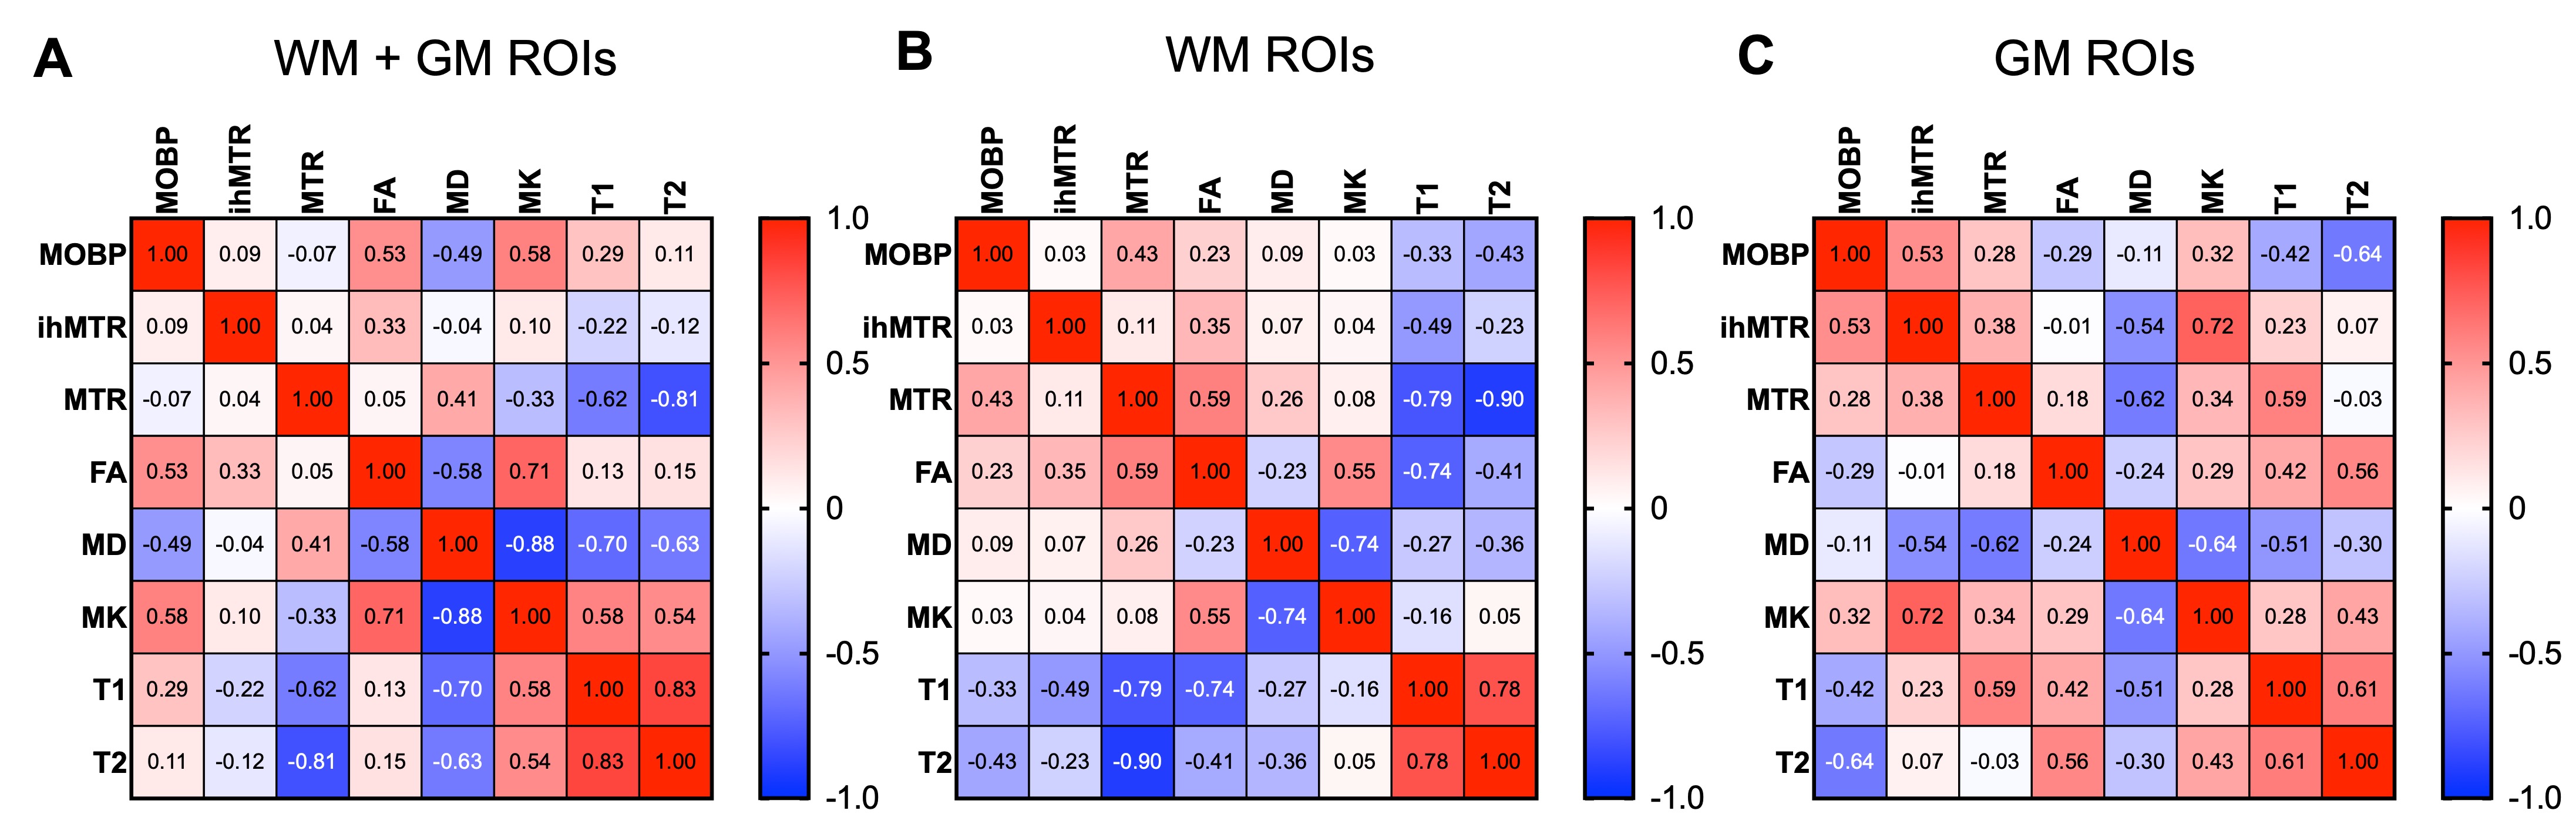
Fig. 3: Correlations among MOBP signal and MRI parameters for both WM and GM ROIs (A), WM ROIs only (B), and GM ROIs only (C).