1124
Pupil-fMRI correlation-based Explainable AI to classify Alzheimer’s Disease1Athinoula A. Martinos Center for Biomedical Imaging, Department of Radiology, Massachusetts General Hospital, Harvard Medical School, Charlestown, MA, United States, 2School of Traditional Medicine, Southern Medical University, Guangzhou, China, 3Department of Neuroscience, Boston University, Boston, MA, United States
Synopsis
Keywords: Task/Intervention Based fMRI, Alzheimer's Disease, pupil dynamics
Motivation: The pupil-fMRI correlation analysis reveals that erroneous pupillary light responses in AD mice are highly correlated to specific neuromodulatory systems.
Goal(s): This study applied an explainable AI method with a pre-trained deep convolutional neural network to process pupil-fMRI interactive measurements of awake mice to verify AD biomarkers.
Approach: Using the GradCAM method, we produced the saliency heatmap, which can be used to verify the underlying responsible functional nuclei for classification that could be impaired due to AD degeneration.
Results: This study applied a novel GradCAM-based machine learning scheme to elucidate AD-specific pupillary responses based on impaired neuromodulatory dysfunction as a non-invasive AD biomarker.
Impact: The GradCAM-based saliency map obtained with an XAI method could be used to verify the statistical differential maps of PLR-based fMRI correlation between AD and WT mice, providing a novel non-invasive AD bioimaging marker.
Introduction
Alzheimer's disease (AD) leads to brain degeneration and declined cognition in patients who are typically diagnosed based on behavioral testing scores. Irregular pupillary light responses (PLR) have been reported in AD patients1–4, demonstrating an alternative non-invasive method for AD diagnosis. However, the controlling mechanism underlying pupillary dynamics is involved in both sympathetic and parasympathetic pathways, as well as multiple neuromodulatory systems, complicating the pupillary index of brain degeneration. Our previous work has revealed different neuromodulatory circuits underlying varied pupillary spectrums using a machine learning-based prediction model5. An intriguing observation from awake AD mice showed that AD-specific PLR is significantly coupled with cholinergic neuromodulatory circuits from the basal forebrain to the hippocampus and cingulate cortex, which typically shows dysfunction in AD brains. In this work, we implemented the XAI method with the GradCAM module to identify functional nuclei mostly responsible for the classification of AD and WT brains based on the PLR feature-fMRI maps, providing a quantitative differentiation of pupil dynamics in AD and WT mice.Materials and Methods
Data recording: Awake mouse fMRI images were acquired using a 14T ultra-wide horizontal bore scanner. We employed a multi-slice 2D EPI scan (TE=6.2ms, TR=1s, NR=205) at a resolution of 100x100x200µm, utilizing nine C57BL/6J wild-type (WT) mice and nine 5xFAD transgenic AD mice with implanted 600MHz single-loop surface coils. In well-trained awake mice, we conducted whole-brain fMRI and real-time pupillometry with three trials per mouse per scanning section. Each trial comprised 10 visual stimulation epochs (8s on, 32s off) using LED lights (488nm 5Hz, 530nm 5.1Hz, 20ms duration). Baseline data consisted of five scans (10s) before stimulation. Data Analysis: We proposed a grayscale-based pupil size detection method, applying z-score normalization to pupil dynamics data. The fMRI images were processed using Analysis of Functional Neuroimages (AFNI)6,7. Three PLR features were extracted for each epoch: Pc (constriction difference), Pd (dilation difference), and T (dilation recovery rate). Pc was used in amplitude-modulated pupil-fMRI correlation analysis for constriction-related fMRI maps, while Pd and T were utilized in an AM generalized linear model for dilation-related fMRI maps. These correlation maps were used in convolutional neural network (CNN) based AD-WT classification, where a pre-trained 3D VGG198 network with added layers (flatten, Relu, and softmax) was employed. The dataset was divided into 113 training and 30 testing samples. Training used an Adam optimizer with sparse categorical cross-entropy loss (learning rate=0.00001, batch size=8, epochs=50). GradCAM9 was applied to identify functional nuclei responsible for classification.Results
Fig 1 shows the mean PLR, the trial-specific measurements of PLR features of AD and WT mice, and the PLR feature related differential statistic map of WT vs. AD mice. Fig 1C shows that the -based differential statistic map of WT vs. AD highlights the septal area (LS/MS), cingulate cortex (Cg), and hippocampus (Hippo). Fig 2 shows the processing flow of the pupil and fMRI datasets through the CNN and the creation of the GradCAM-based heatmap. We were able to supervise VGG19 training to produce 85% prediction accuracy (out of a total of 30 trials as testing datasets). The representative GradCAM-based heatmap is from an AD mouse, highlighting the color-coded septal areas contributing to the AD classification. Fig 3 shows the results of CNN classification and GradCAM visualization. Fig 3a shows the learning curve with different training sample sizes (10 epoch training). Fig 3b shows the classification outcomes of the re-trained VGG19 and an example of the false outcome due to overfitting issues. Fig 3c shows the averaged saliency map of AD and WT brains, which can be verified with the statistic-based differential maps between AD and WT mice.Discussion
With the XAI method, we can use the voxel-wise pupil-fMRI correlation maps of awake mice to reveal multiple function nuclei responsible for the irregular PLR in AD mice, presenting a robust function-behavioral linkage in degenerative brains. More datasets will be helpful to improve classification accuracy and reduce overfitting errors.Conclusions
We have reported a novel high-resolution awake mouse fMRI methodology to bridge the function and pupil dynamic behavior of AD mice and a deep learning method to provide solid evidence to monitor the pupillary response as a potential biomarker of the neurodegeneration of AD patients.Acknowledgements
This research was funded by NIH Brain Initiative funding (RF1NS113278, RF1NS124778, R01NS122904, R01NS120594, R21NS121642), NSF grant 2123971, and the S10 instrument grant (S10 MH124733–01) to Martino’s Center.References
1. El Haj, M. & Moustafa, A. Alzheimer’s disease in the pupil: pupillometry as a biomarker of cognitive processing in Alzheimer’s disease. 2022;77–85.
2. Granholm, E. L. et al. Pupillary Responses as a Biomarker of Early Risk for Alzheimer’s Disease. Journal of Alzheimer’s Disease. 2017; 56:1419–1428.
3. Kremen, W. S. et al. Pupillary dilation responses as a midlife indicator of risk for Alzheimer’s disease: association with Alzheimer’s disease polygenic risk. Neurobiol Aging. 2019;83:114–121.
4. Chougule, P. S., Najjar, R. P., Finkelstein, M. T., Kandiah, N. & Milea, D. Light-Induced Pupillary Responses in Alzheimer’s Disease. Front Neurol.2019;10.
5. Sobczak, F., Pais-Roldán, P., Takahashi, K. & Yu, X. Decoding the brain state-dependent relationship between pupil dynamics and resting state fMRI signal fluctuation. Elife. 2021;10:e68980.
6. Cox, R. W. AFNI: Software for Analysis and Visualization of Functional Magnetic Resonance Neuroimages. Computers and Biomedical Research. 1996;29:162–173.
7. Cox, R. W. & Hyde, J. S. Software tools for analysis and visualization of fMRI data. NMR Biomed. 1997;10:171–178.
8. Simonyan K, Zisserman A. Very deep convolutional networks for large-scale image recognition[J]. arXiv preprint arXiv:1409.1556, 2014.
9. Selvaraju R R, Cogswell M, Das A, et al. Grad-cam: Visual explanations from deep networks via gradient-based localization[C]//Proceedings of the IEEE international conference on computer vision. 2017: 618-626.
Figures
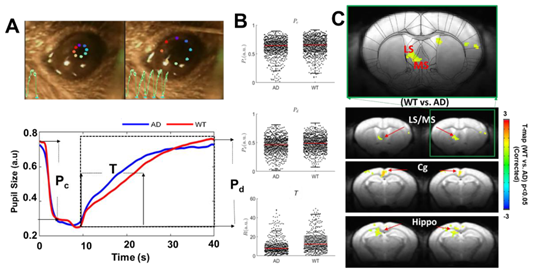
Fig 1 Awake mouse fMRI with real-time pupillometry. A. The pupillary light responses of awake WT and AD mice and the mean PLR plots to show the Pc, Pd and T features). B. The trial-specific measurements of PLR features: Pc, Pd, and T of AD and WT mice. C. The Pd-based differential statistic map of WT vs. AD highlights the septal area (LS/MS), cingulate cortex (Cg) and hippocampus (Hippo) (n=10 for each group, a total of 60 trials per group).
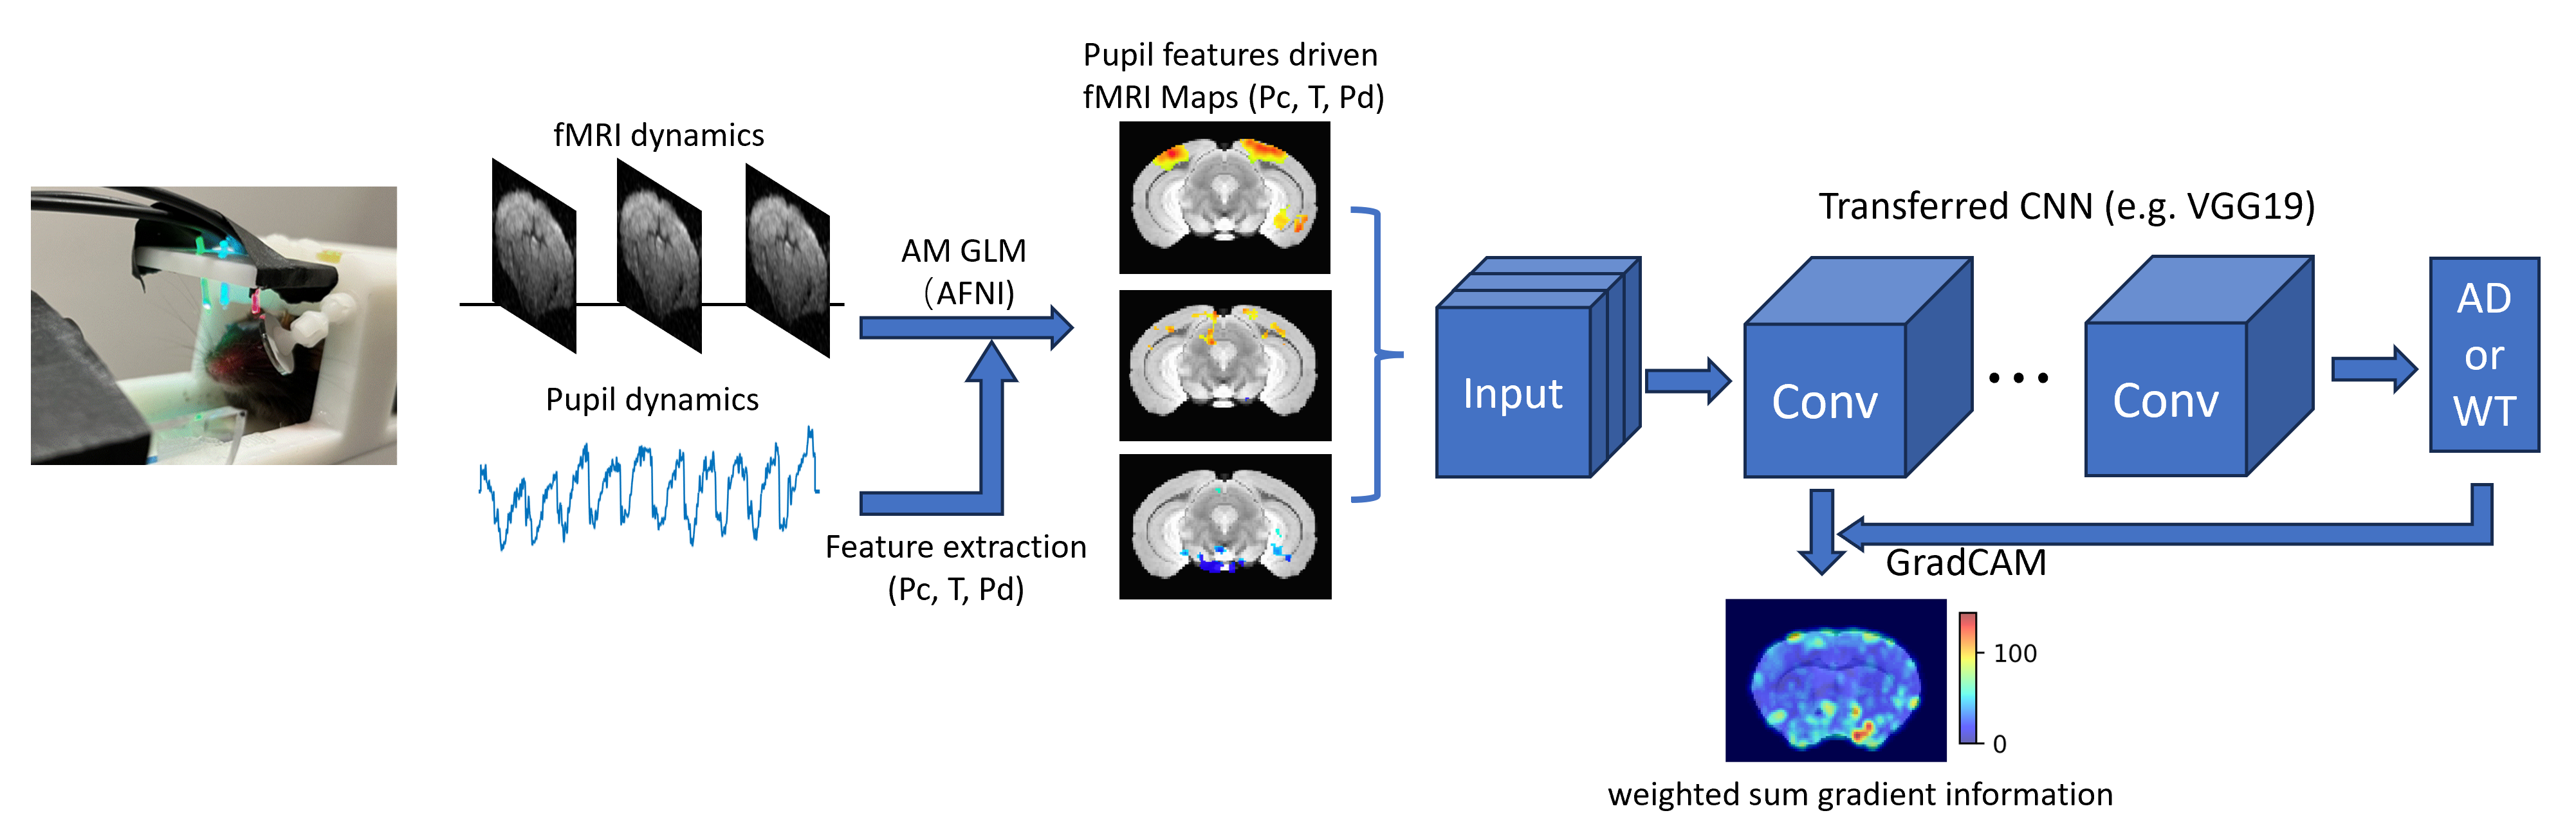
Fig 2 The re-trained VGG19 network for AD brain classification and GradCAM visualization based on the PLR-fMRI interaction.
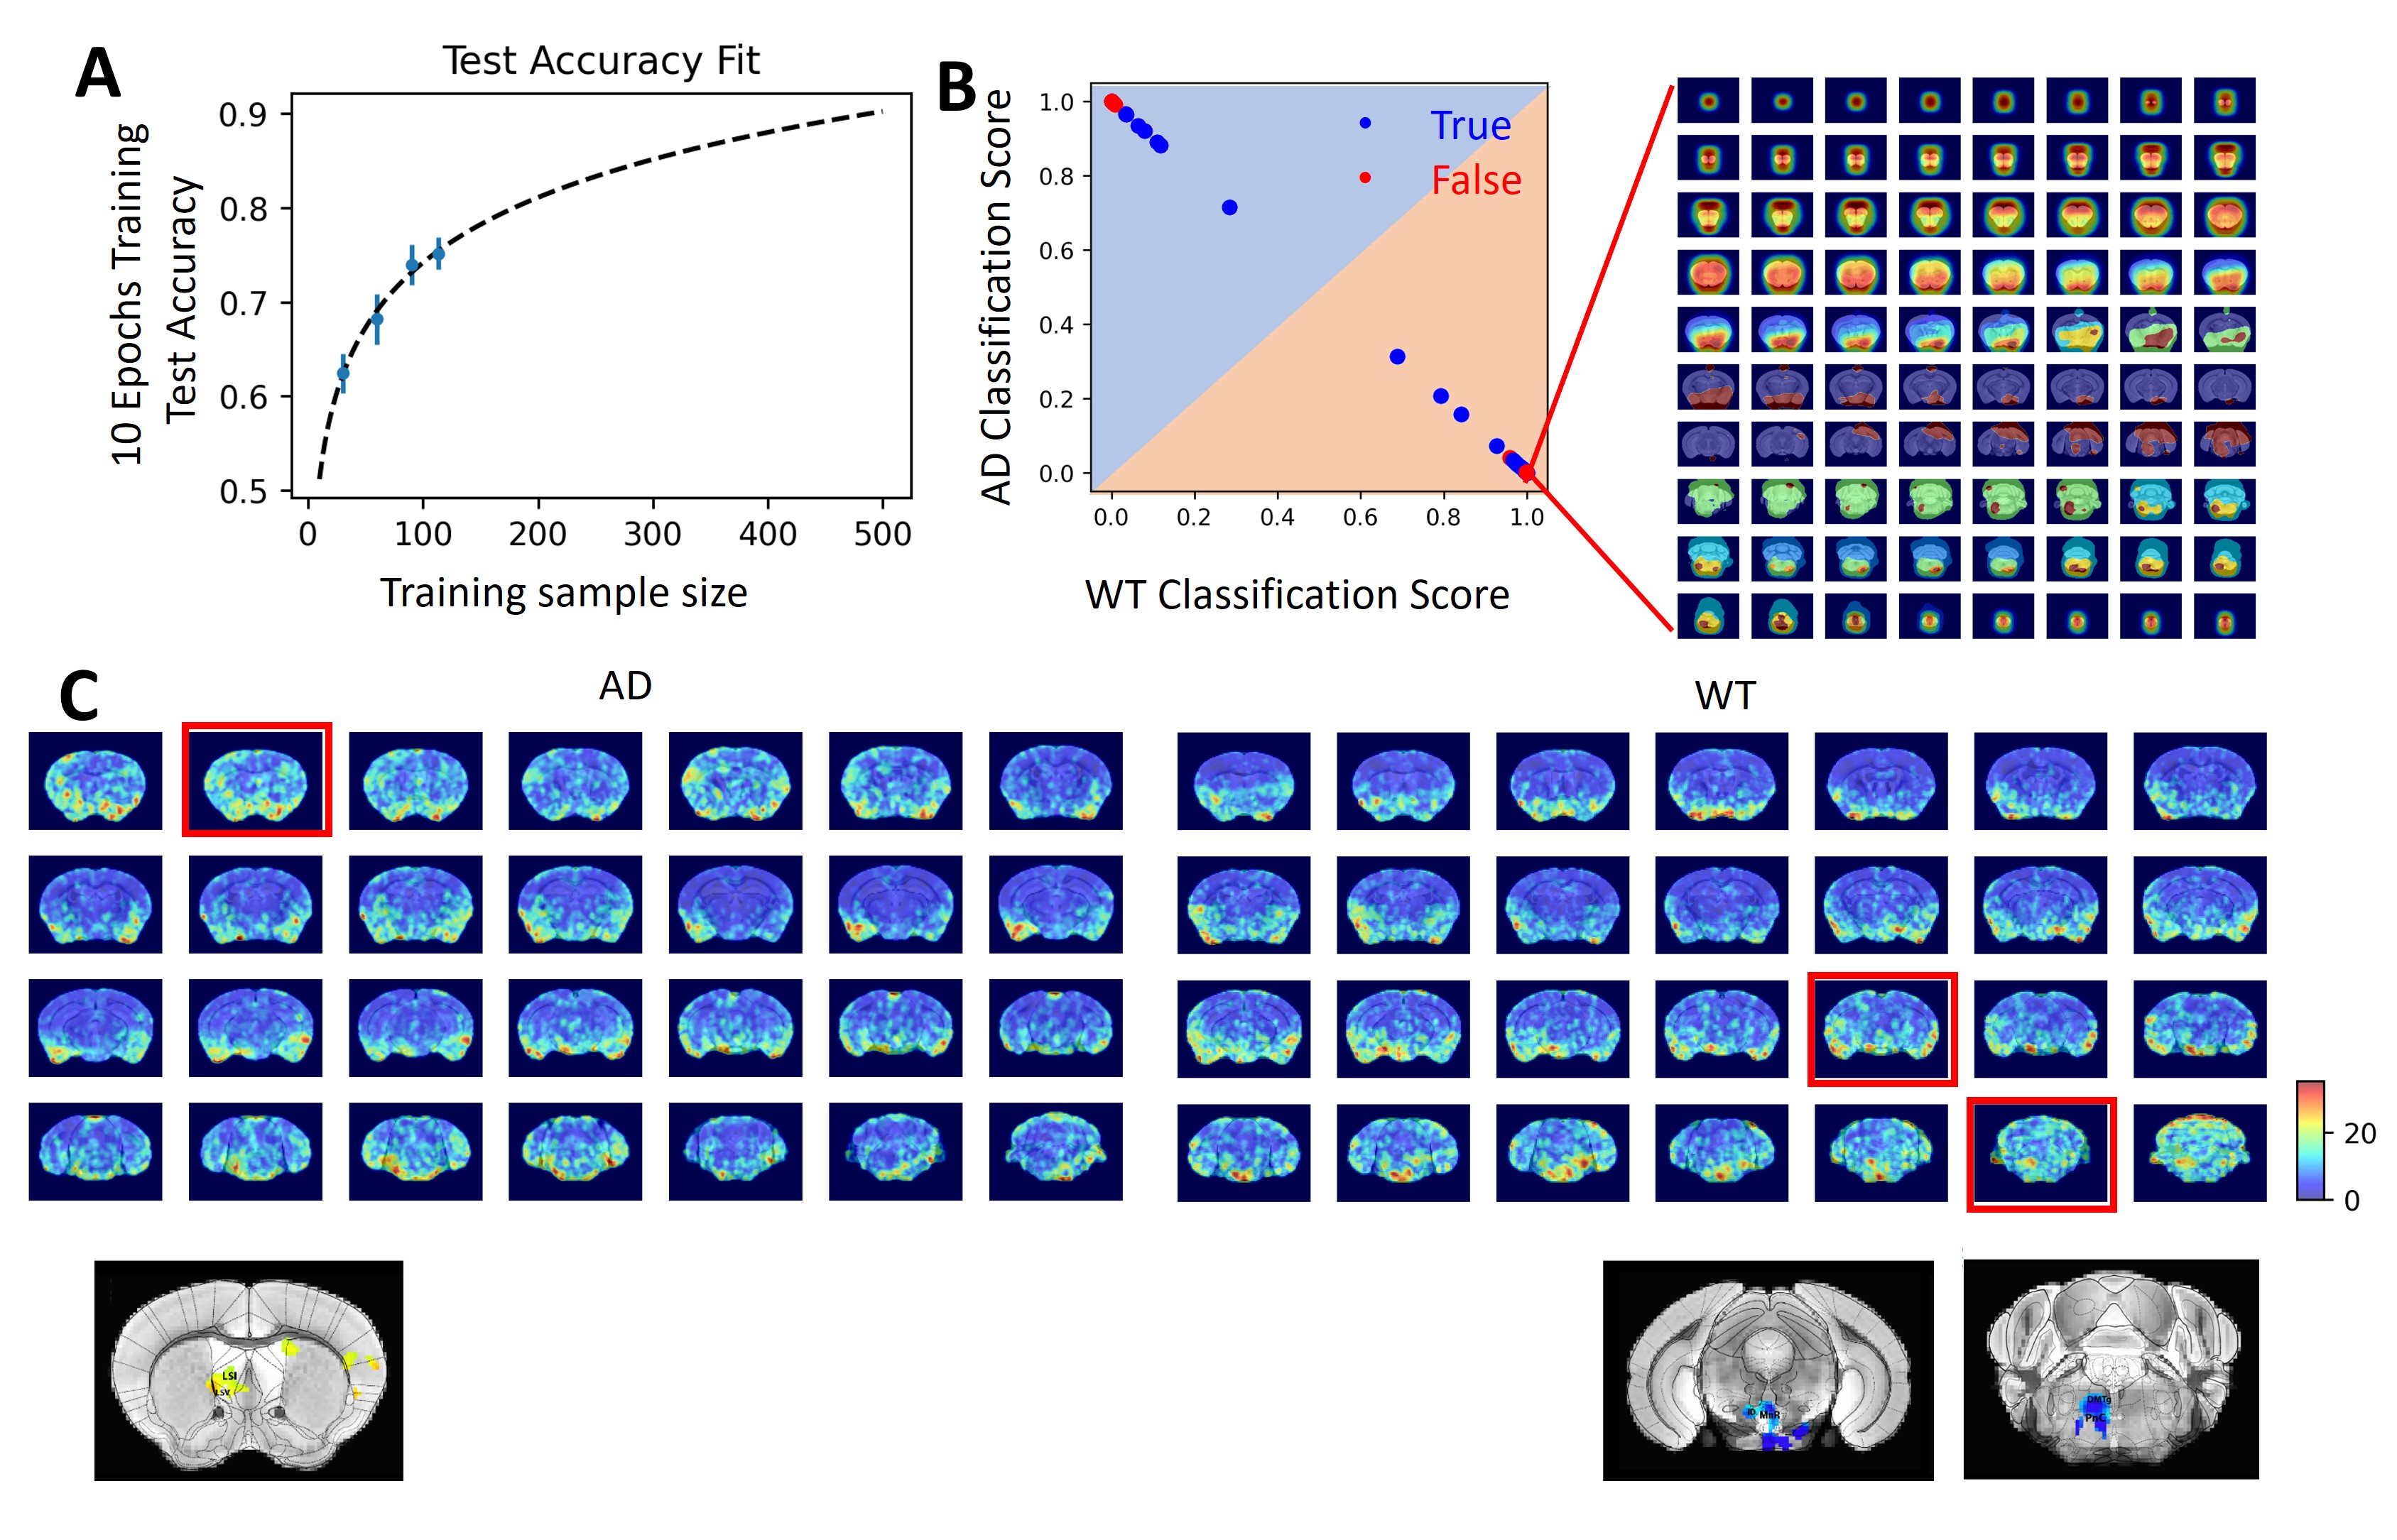
Fig 3 The results of CNN classification and GradCAM visualization. A. The learning curve with different training sample sizes. B. The classification outcomes of the re-trained VGG19 and an example of the false outcome. C. The averaged saliency map of AD and WT brains.